Chainlink, Cosmos, Aave Price Analysis: 04 June

Since Bitcoin retraced by 7% and dropped down to $36,000 once again, a wave of selling pressure was evident across the broader cryptocurrency market. The likes of Chainlink, Cosmos, and Aave each fell by over 10% and eyed certain support levels on their respective charts.
Chainlink [LINK]

Chainlink’s ascension was stalled at the $32.5-resistance level as sellers re-emerged in the market. On the 4-hour timeframe, a few candlesticks broke below the $29-support and headed close to the next defensive line around $24. Maintaining losses at $24 could result in some sideways action and a breakout can be expected once again when the broader market reverses direction. However, gains would likely be limited to the upper ceiling at $35.3.
A bearish crossover in the MACD showed that bears were back in control after the last few days of bullish trading. Even the RSI fell sharply and moved below 40.
Cosmos [ATOM]

Cosmos’ rally failed to topple its 38.2% Fibonacci level ($17.6) and the bulls were at risk of losing 23.6% Fibonacci level ($14.20) due to the selling pressure. A breakdown could see ATOM fall back towards the demand zone between $10.4 and $8.6, although there was some additional support at the $11-mark.
The Momentum Squeeze Indicator showed that bulls were rapidly losing control in a volatile market. A close below $13 could also open up some short opportunities. The RSI has noted a steady uptrend since 30 May, but that trend was reversing as the index slipped into the bearish territory at the time of writing.
Aave [AAVE]
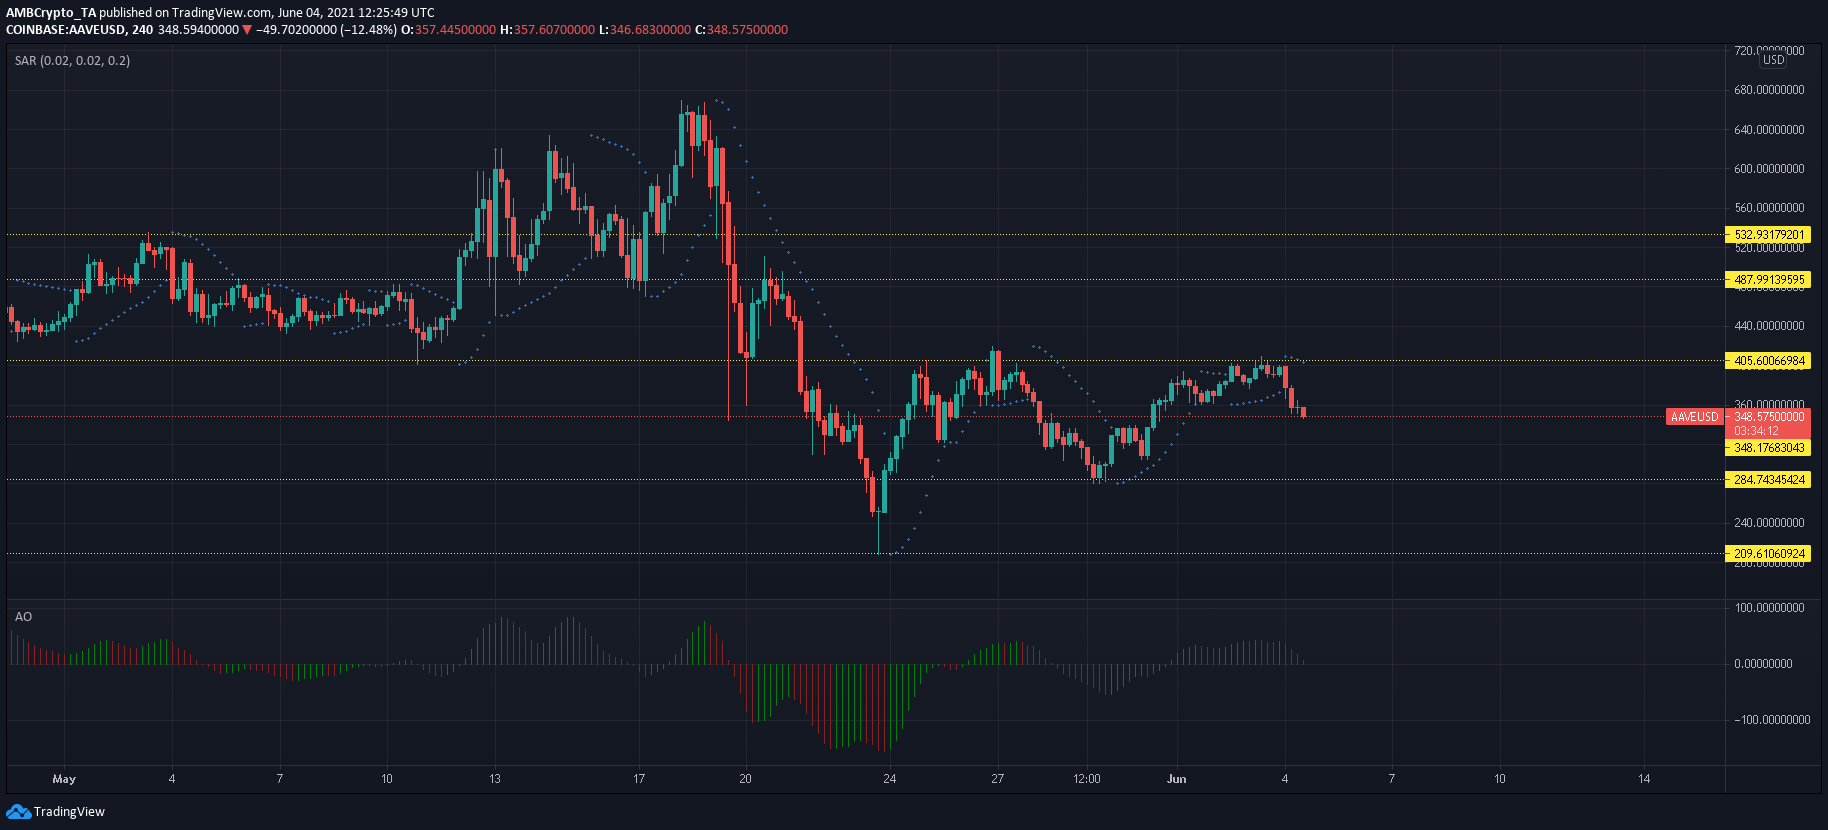
Aave was no exception to the broader market correction as its value dropped by 12% over the last 24 hours. At press time, its price hovered close to the $248.2-support and a breakdown seemed likely according to its technicals. The Awesome Oscillator highlighted rising bearish momentum and eyed a drop below half-line. The Parabolic SAR’s dotted markers shifted above the candlesticks at the $405-resistance and showed that a downtrend was in effect.
Despite the losses, AAVE’s safety net lay between $209-285 and an extended sell-off would likely be countered within this zone.


