Chainlink, EOS, Dash Price Analysis: 24 May

Chainlink needed to overcome the $23.1-resistance to witness an extended rally, at press time. The buyers stepped in at $4, but a bumpy road lay ahead for EOS. Finally, Dash presented an important target level around the $241-level.
Chainlink [LINK]
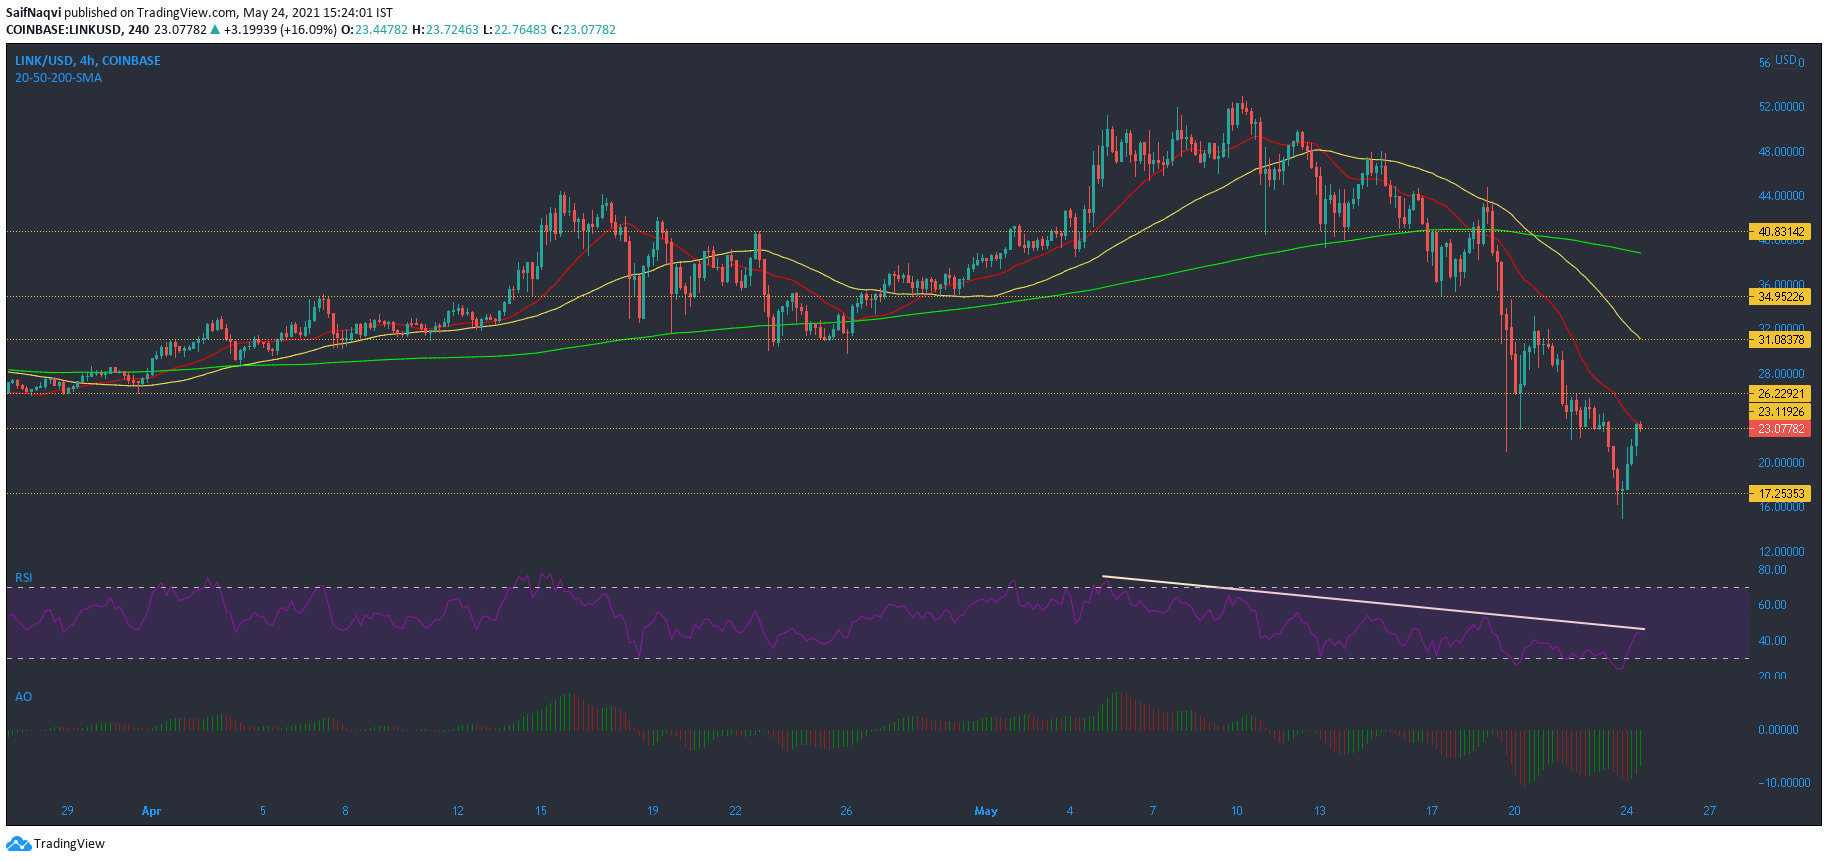
After the latest sell-off, Chainlink finally cut its losses at the $17.25-support – a level last seen back in January. Buyers are now in control and at press time, the world’s 13th largest cryptocurrency was trading at $23, up by 20% since yesterday.
In fact, LINK made a strong case for an extended rally but that hinged on a critical zone around the $23.1-resistance. A successful breakout above this point and $26.2 would push LINK towards $31. Even if a breakout is denied, flipping $23.1 to a defensive line and maintaining it would be crucial to LINK’s short-term success.
The RSI jumped above the oversold zone and stabilized at 44. 52-53 is the region for a bullish control. Finally, the Awesome Oscillator noted a series of green bars and even rose above half-line on the hourly timeframe.
EOS
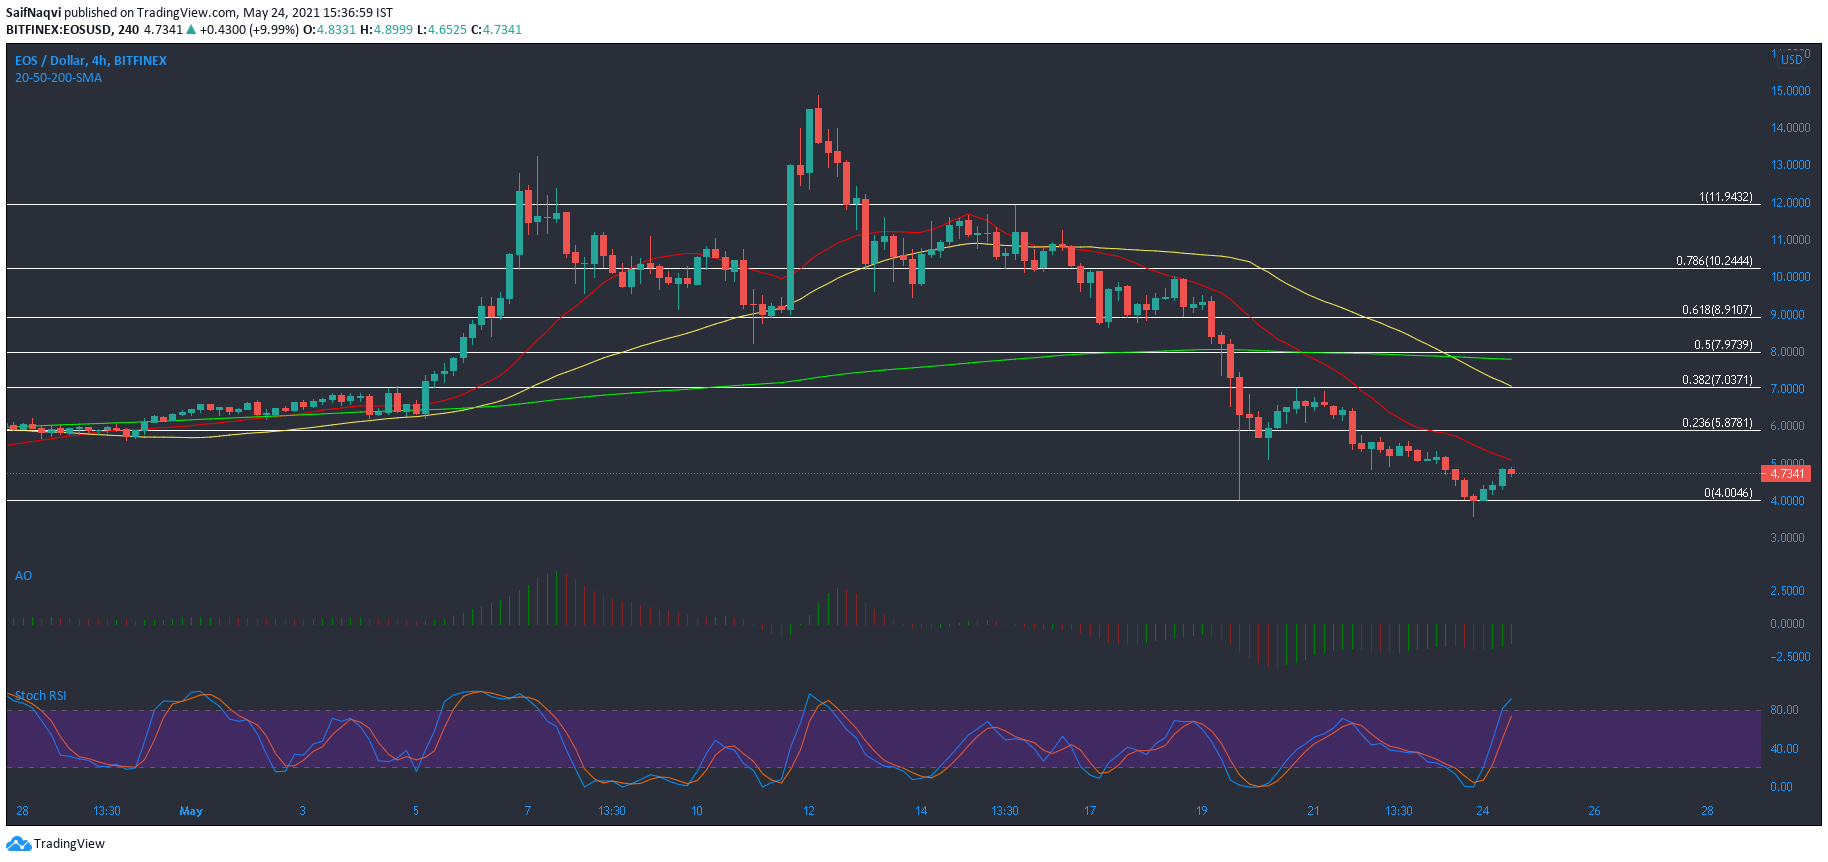
Even though EOS further shed its value from $7 to $4, its movement was well within expectations, especially considering a shaky broader market. While EOS’s recovery was measured compared to its counterparts, it showed the potential for stronger gains over the coming sessions.
However, EOS needs to retake a few levels to enable a faster recovery. The first challenge lay in the form of 20-SMA which floated around $5, and the second resided at the 23.6% Fibonacci level ($5.87). A breach of these levels would result in an overall price gain of 46% when calculated from the $4-support level.
Conversely, a bearish outcome would likely call into action the $4-support once again. While the Awesome Oscillator highlighted buying pressure, the Stochastic RSI’s overbought nature created skepticism against a bullish outcome.
Dash [DASH]
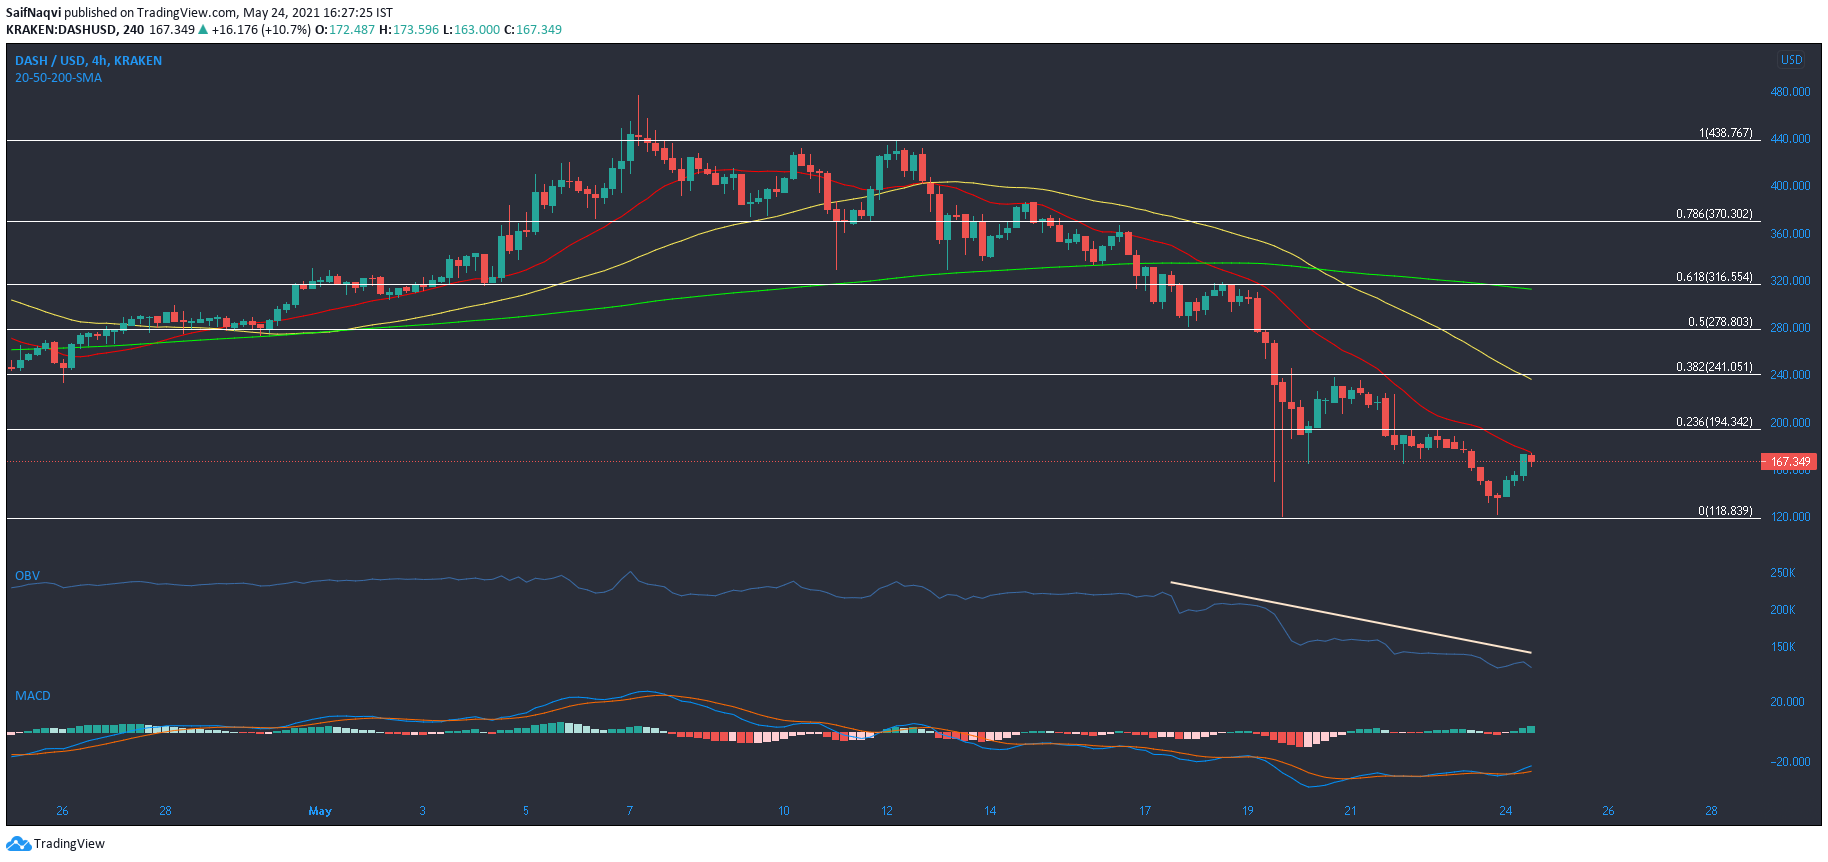
Similar to EOS, several obstacles lay ahead for Dash’s bullish comeback on the charts. The 20-SMA (red), 23.56% Fibonacci level ($194.342), and 38.2% Fibonacci level ($241) all posed threats for the privacy-focused cryptocurrency. Failing to rise above the first hurdle at 20-SMA could lead to a fallback towards $118 once again. Additional support levels resided at $94 and $85 (not shown).
One way to stand clear of a bearish market would be to regain control of the 38.2% Fibonacci level ($241). This area was largely in focus during two pullbacks in April and came out unscathed each time. The region also coincided with the 50-SMA and bolstered its importance. A bullish crossover in the MACD was a step in the right direction. On the other hand, a downwards pointing OBV backed an unfavorable outcome as selling pressure outmatched buying pressure.


