Chainlink, Ethereum Classic, Uniswap Price Analysis: 18 May

Chainlink indicated an extended bear run but retaking key levels could allow for a bullish comeback. Ethereum Classic projected an 18% hike from a falling wedge breakout. Finally, Uniswap needed to reclaim $36.8-39.1 to reverse bear market conditions.
Chainlink [LINK]
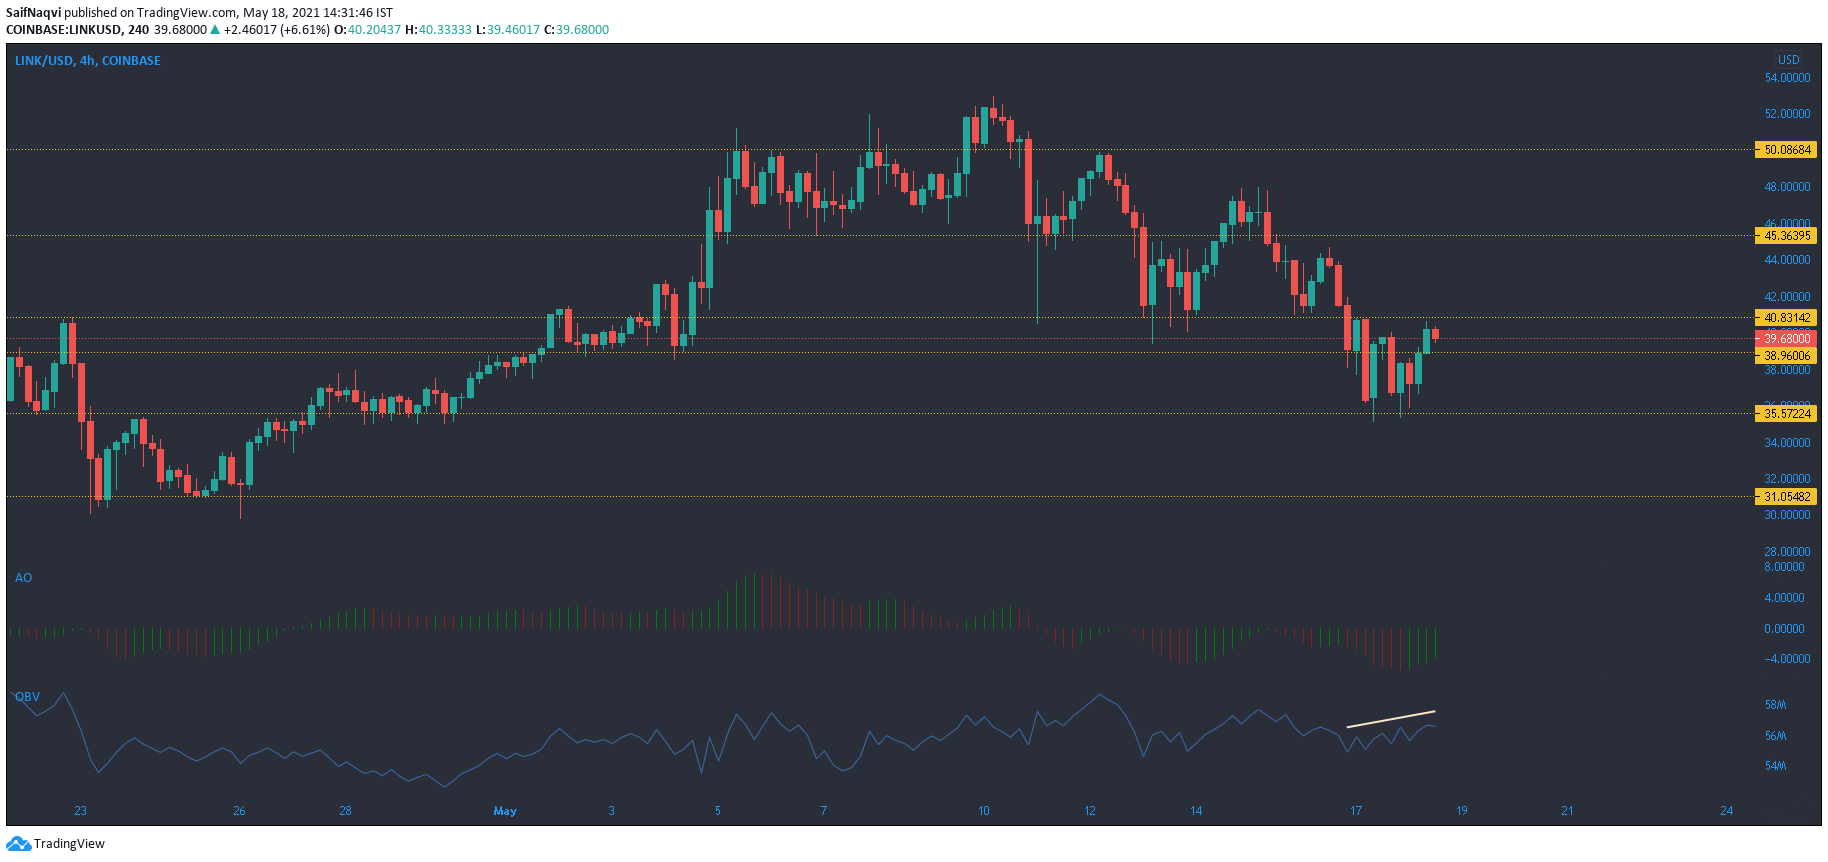
The 4-hour chart highlighted severe bearish conditions for Chainlink as the candlesticks traded below their 20-SMA, 50-SMA and even the 200-SMA. Weekly losses amounted to 14% at the time of writing and 24-hour trading volumes remained muted across exchanges. Such a dire predicament only pointed to an extended bearish outcome. While bulls did face an uphill task to regain control, climbing above certain resistance levels would expedite LINK’s recovery process. The first area lay around $40.8 and the 200-SMA. The second was around $44-46 and the 50-SMA.
LINK’s technicals suggested some buying resurgence in the form of green bars on Awesome Oscillator. Choppy movement on OBV suggested profit taking at various points, but a rise was noted over the past few days. However, further cues were required for LINK’s recovery but a broader market rally could be the catalyst of such an outcome.
Ethereum Classic [ETC]
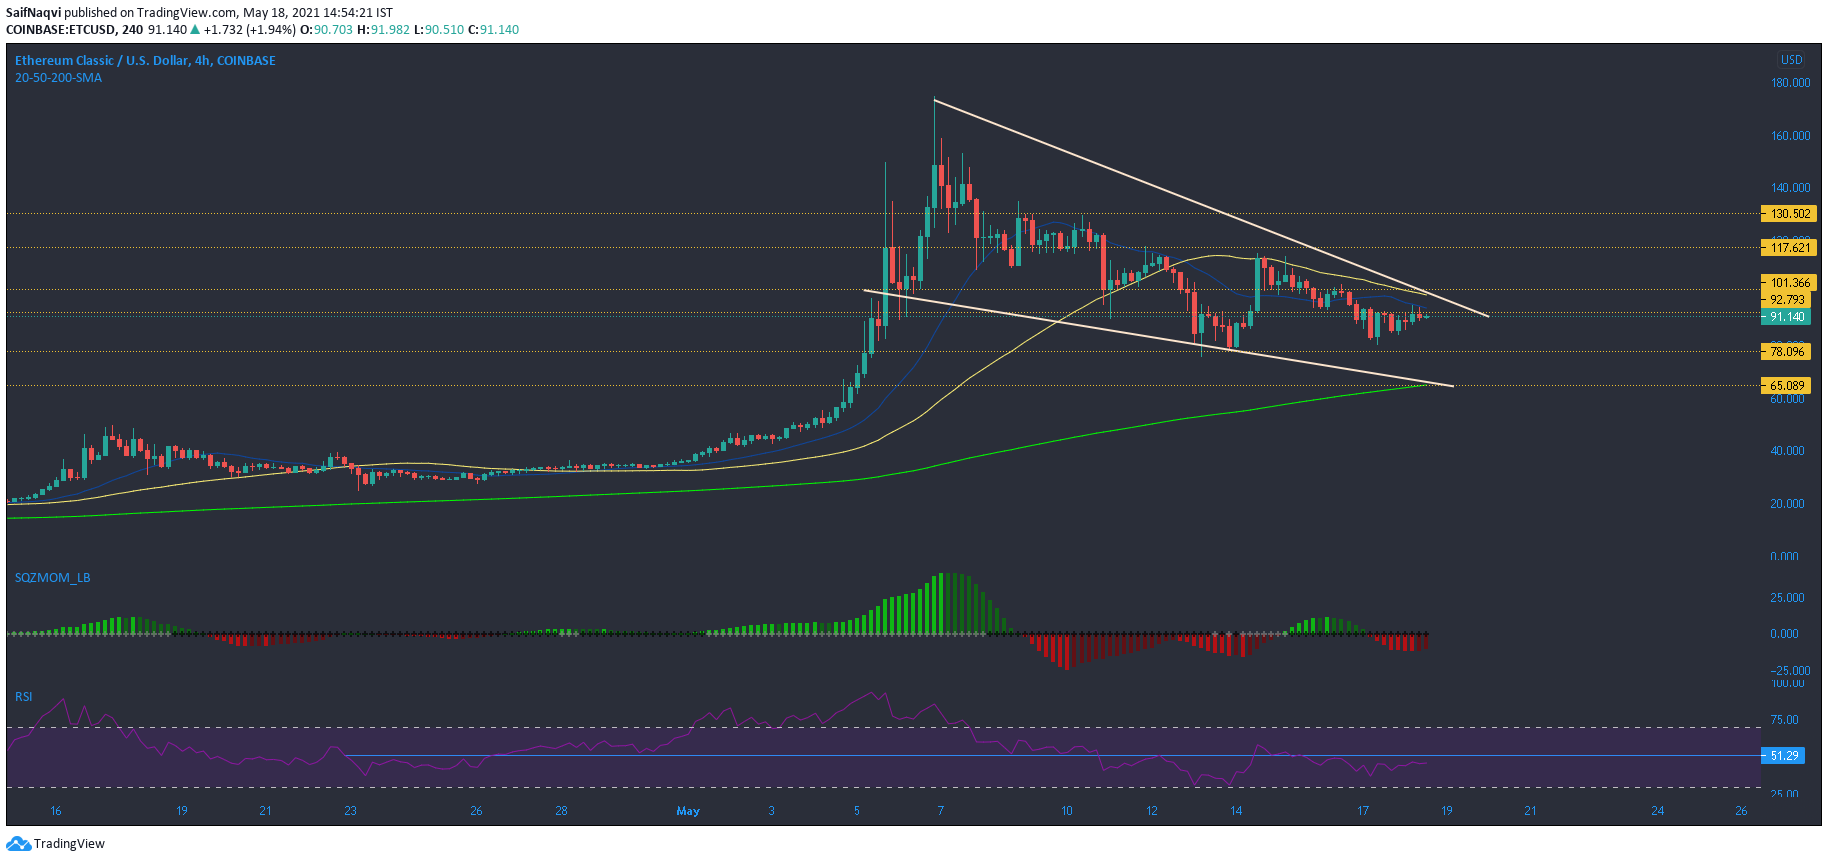
While Ethereum Classic’s previous rally may have been fueled by ETH’s run above $4K, its 4-hour chart showed the likelihood of another price swing independent of broader market cues. A falling wedge pattern pointed towards the upside and although gains were unlikely to outmatch those seen during the first week of May, it would still allow traders to see some returns.
A crucial resistance mark lay around $101.3-102 and the 50-SMA. A breakout above this area could trigger an 18% price rally towards the next ceiling at $116. Conversely, a fall below $65 would likely invalidate ETC’s pattern.
Squeeze Momentum Indicator noted some bullish momentum and the first green bar followed by a white dot would present a buy signal. RSI was yet to recover from bearish territory but a move above 52 could enable sharp upwards movement.
Uniswap [UNI]

Much like most alts in the broader market, Uniswap fared poorly after ETH retraced from its all-time high. UNI’s value dropped by 25% over the last three days alone and bearish signals persisted at the time of writing. Lower highs on RSI indicated weakening as UNI fell below multiple support levels on the 4-hour timeframe.
On the plus side, Awesome Oscillator showed some buying pressure. If bulls topple a strong resistance area between $36.8-39.1, there could be some talks of a comeback. A rise above $41.3 could even culminate into a price hike above the record mark.