Polkadot, THETA, Tron Price Analysis: 18 May

Polkadot trimmed losses at $38.5 support and needed to maintain this to avoid a sharp sell-off. THETA traded within a descending triangle and a breakdown could result in a 20% retracement. Finally, a rise above $0.126-resistance could see a shift of market control over to the bullish side for Tron.
Polkadot [DOT]
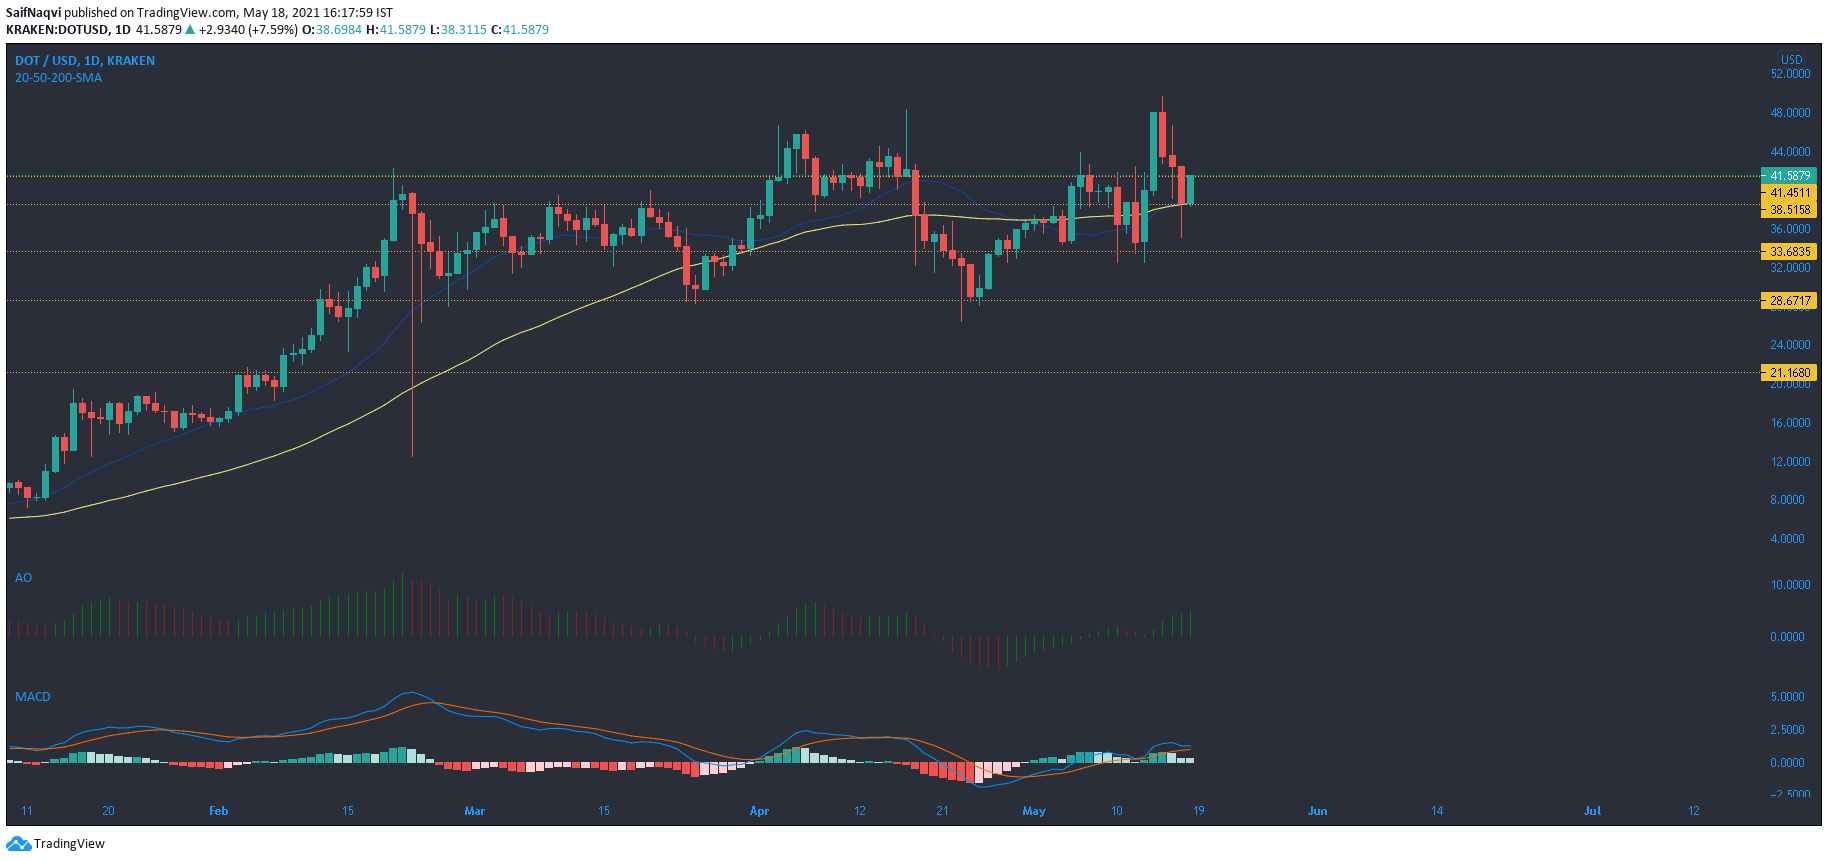
Polkadot traded close to an important support point at $38.5 at the time of writing. This area clashed with the 20-SMA (blue) and 50-SMA (yellow) on the daily-timeframe. On the 4-hour timeframe, the current support mark formed a confluence with 200-SMA and successive green candlesticks showed buying activity. Hence, this defensive line was able to negate the formation of ‘three black crows’ – a bearish pattern. However, losing out on the critical area could lead to a 25% sell-off towards $28.6-support. A heightened bearish outcome could see losses all the way towards $21.16.
Awesome Oscillator showed buying pressure as DOT held on to $38.5-support. On the downside, MACD line inched closer towards the Signal line and a bearish crossover could result in a breakdown.
THETA
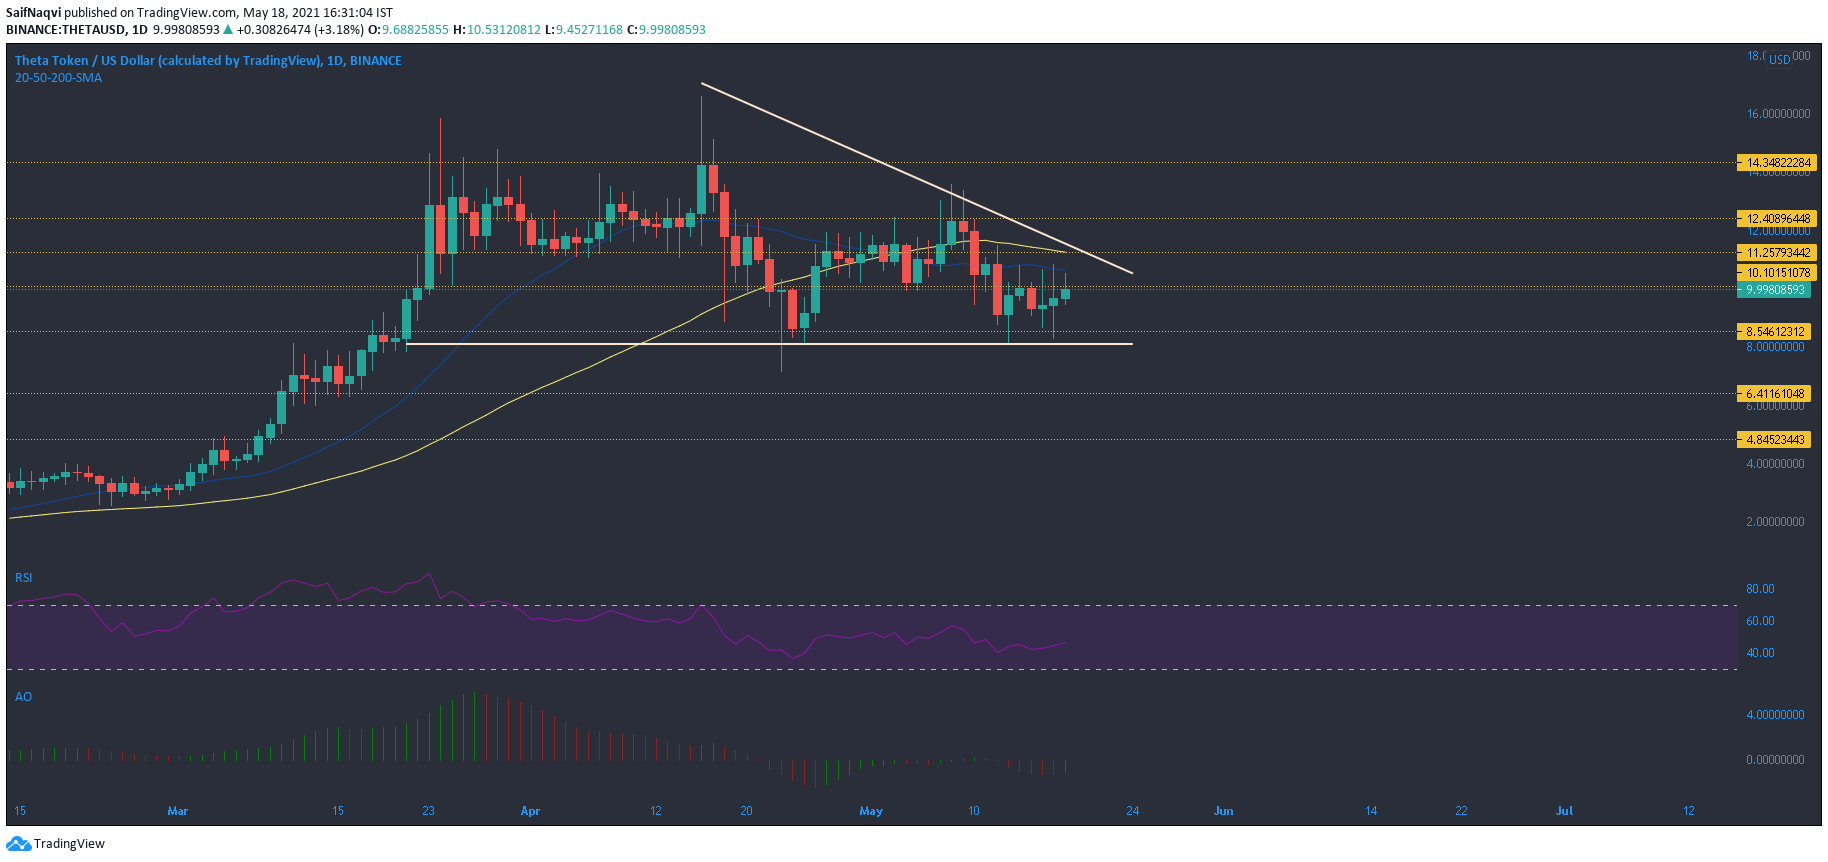
A descending triangle formation on THETA’s daily chart outlined the threat of another sell-off in the coming days. Ceding $8.0-$8.5 region to the bears could result in a 20% retracement towards the next support at $6.14. Conversely, a rise above $11.25 and the 50-SMA would negate this pattern and lead to an upwards breakout.
THETA’s RSI chose a more balanced stance and traded in neutral territory. If the red bars on the Awesome Oscillator continued to follow a southbound trajectory, expect some sharp selling pressure.
Tron [TRX]
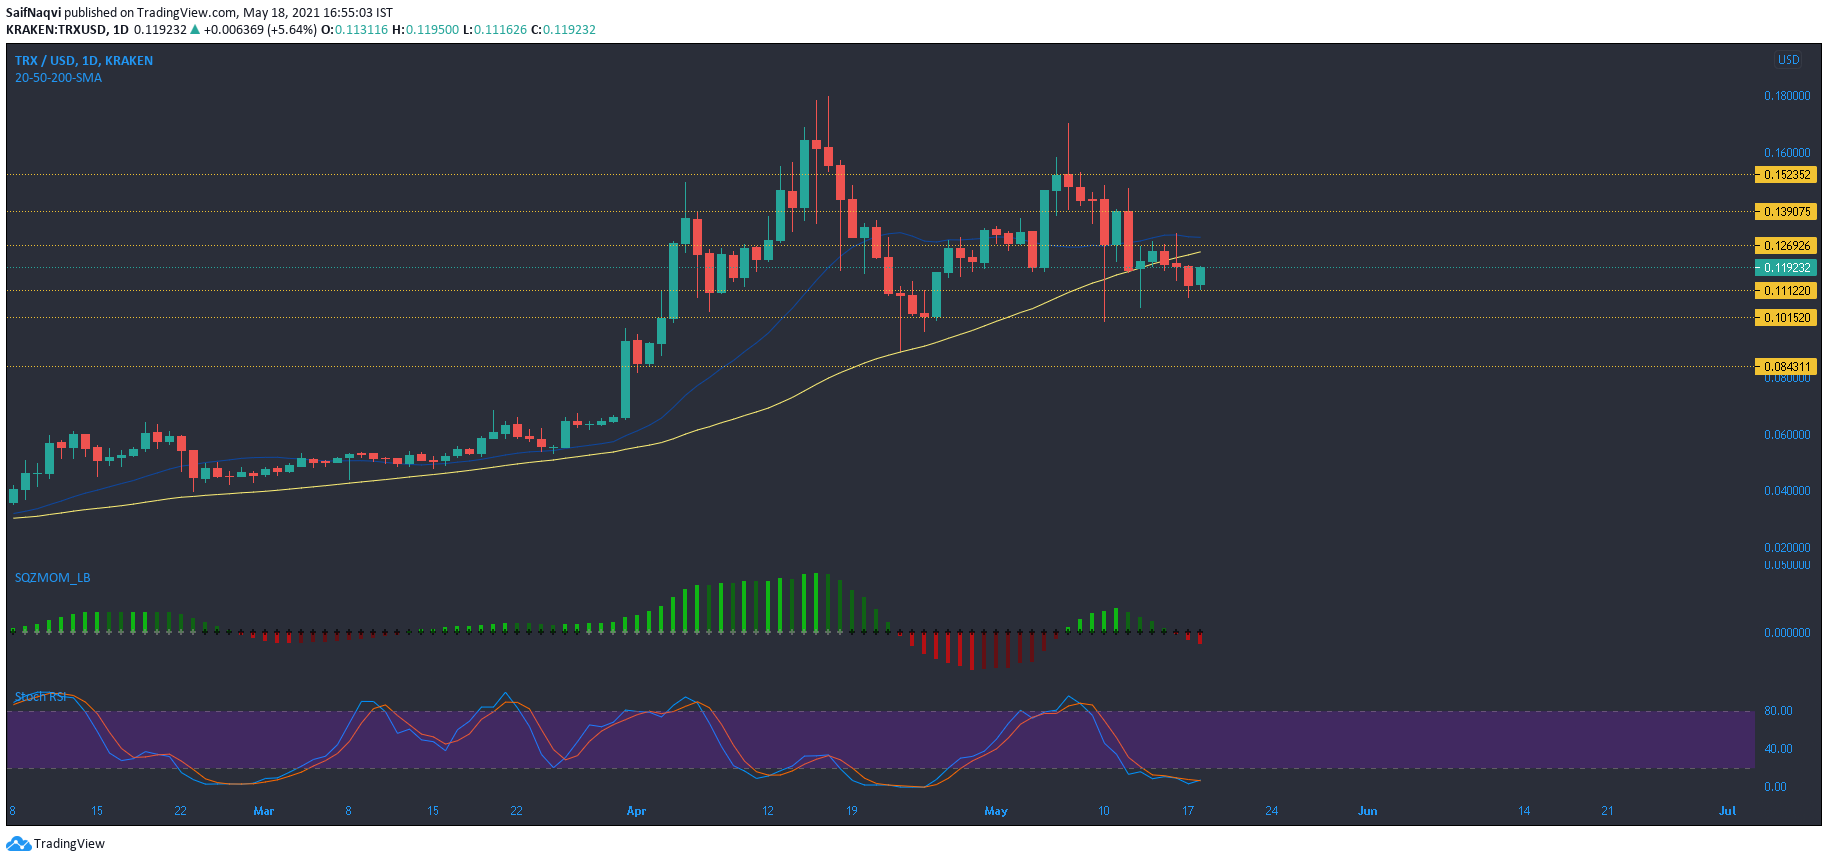
Tron traded in the green at press time and was supported by a barrier at $0.11 . However, Squeeze Momentum Indicator dropped below the half-line and signaled an incoming wave of bearish pressure. If this were the case, TRX would likely see a break below $0.11 and even $0.101, resulting in steeper losses.
On the plus side, a bullish crossover in Stochastic RSI would likely see TRX hold above the aforementioned buy zones. To initiate a comeback, TRX needed to reclaim the region above $0.126- an area that coincided with the 20-SMA (blue).