Chainlink, FTX Token, Synthetix Price Analysis: 01 March

Chainlink was trading within a region of supply as bulls sought to flip it into an area of demand. Synthetix rose above the $18.5 mark as buyers stepped in, and FTX Token attempted to reclaim the $26.2 level as support.
Chainlink [LINK]
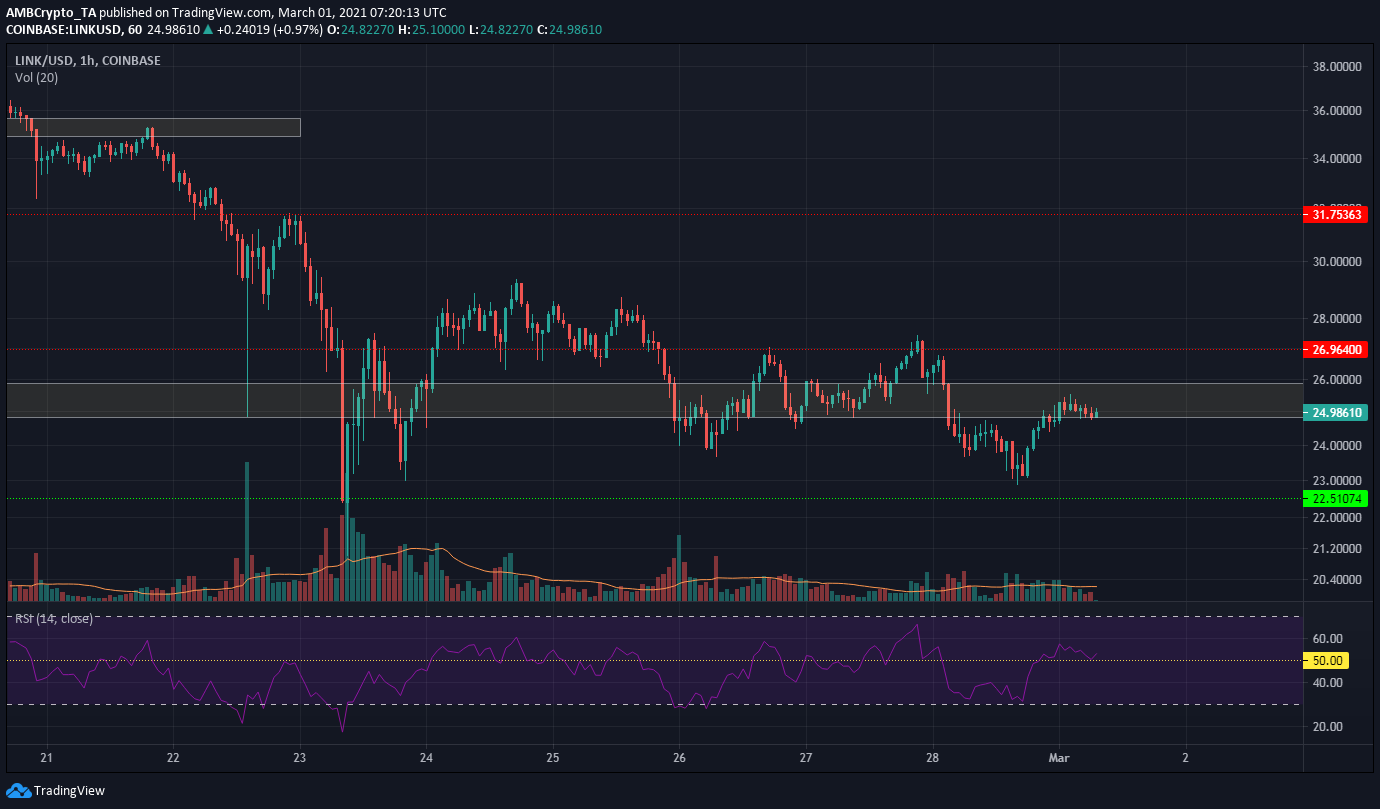
On the hourly chart, the RSI showed that the momentum was beginning to move back in favor of the bulls as it rose above the neutral 50 value. The highlighted region from $24.8 to $25.8 has been a region of supply in the past, with resistance at the $27 mark overhead.
Hence, flipping the $27 area to support will be a strong sign of bullish strength. The formation of a higher low compared to the previous one at $22.33 a few days ago is also an encouraging sign in the short-term.
FTX Token [FTT]
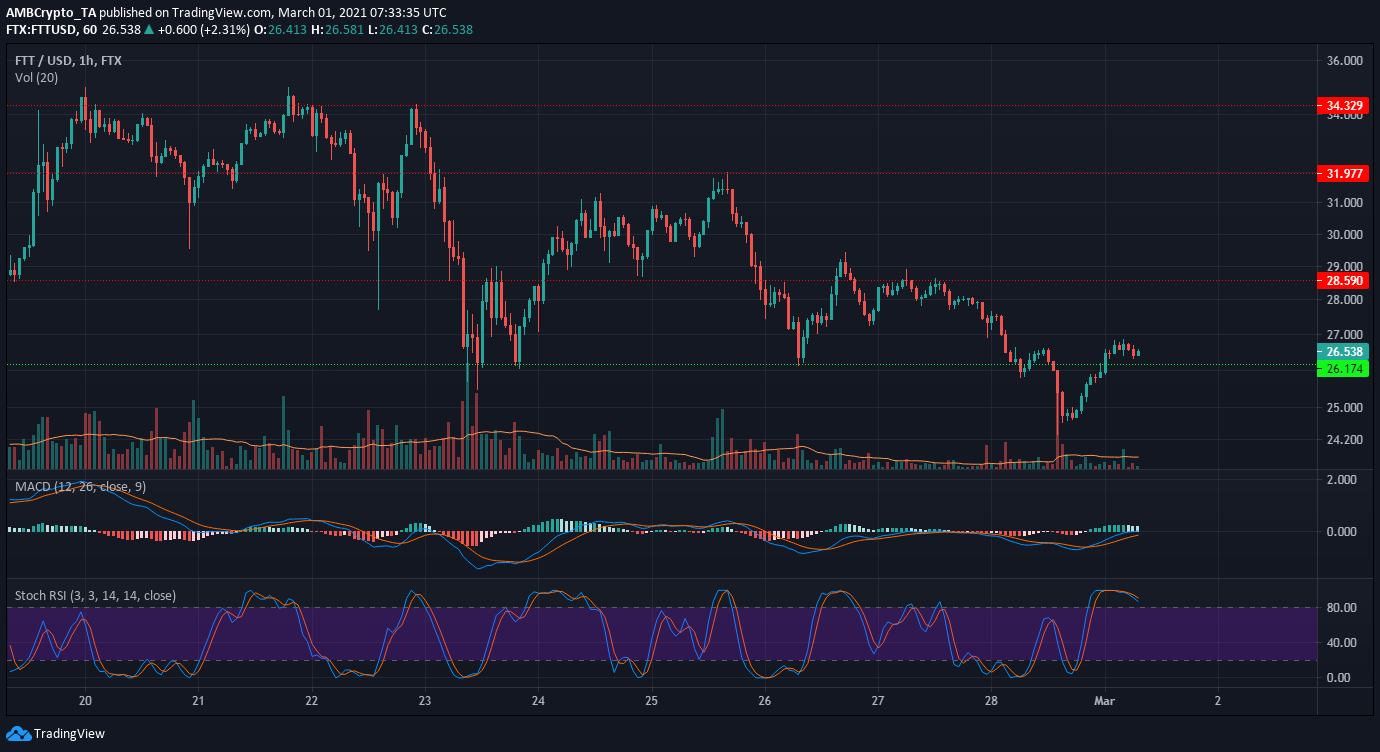
The MACD formed a bullish crossover and was on the verge of rising above the zero line to show short-term bullish momentum. FTT also rose above the $26.17 level of support.
The Stochastic RSI was in overbought territory and a small pullback from $26.57 could be seen. A retest of $26.17 can be used to place buy orders. Over the next few days, FTT bulls must defend the $26 area from any bearish pressure and also rise above the $28.59 level to begin a recovery for FTT.
Synthetix [SNX]
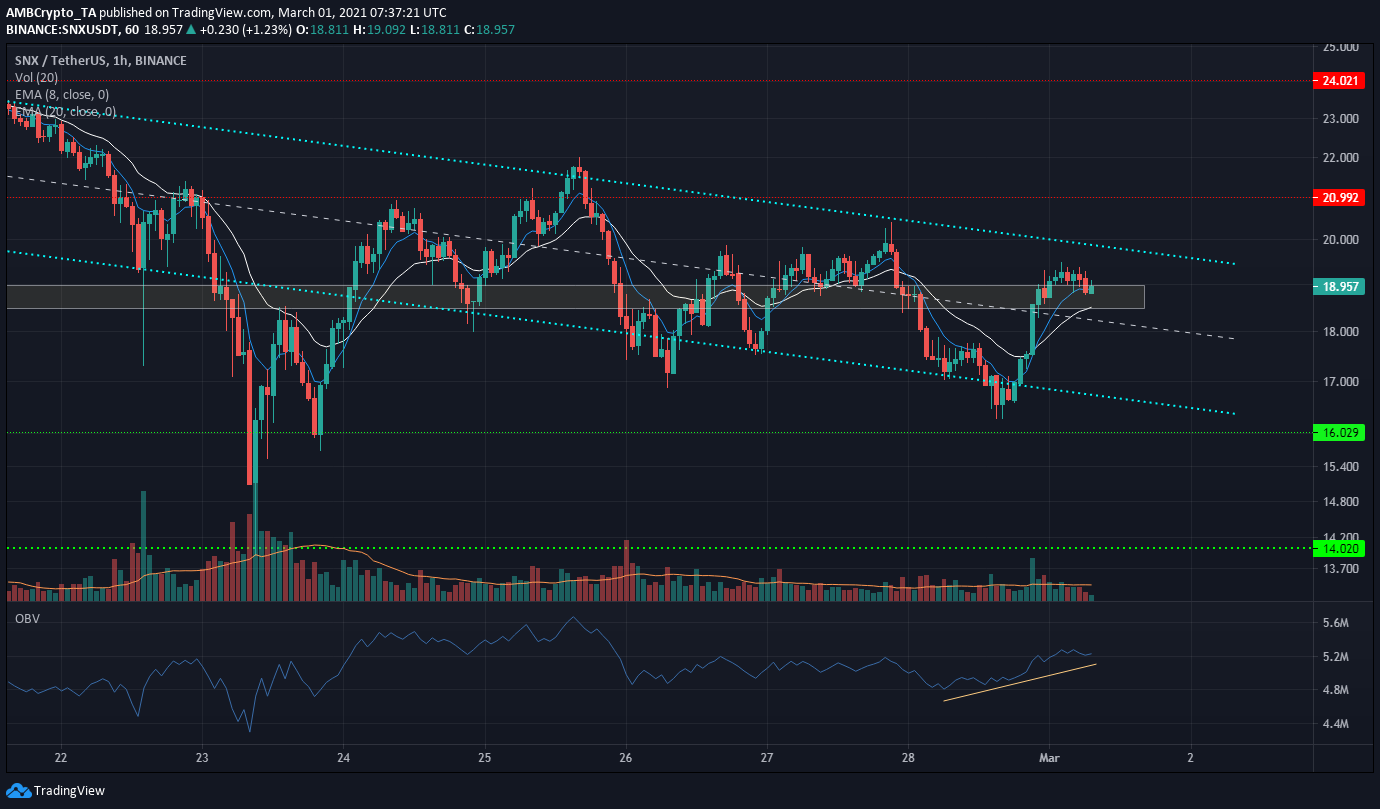
Synthetix was trading within a descending channel, with attempted breakouts in both directions. However, at the time of writing the coin’s price has moved back within this channel.
Over the past few hours, the OBV noted an upward trend as SNX briefly dipped beneath the channel’s lower boundary but forced its way back in. The 8-period EMA (blue) was moving above the 20-period EMA (white) to show short-term bullish momentum.
The $18.2 area could be retested, and would make a good area to buy SNX at.