Chainlink: Here’s what to expect from LINK’s recent patterned breakout

Disclaimer: The findings of the following analysis are the sole opinions of the writer and should not be considered investment advice.
- Chainlink gravitated toward its long-term support zone after chalking out a reversal pattern.
- LINK’s Open Interest painted a slightly bearish picture over the last 24 hours.
After momentously sustaining a spot above the 20/50/200 EMA, Chainlink [LINK] sellers induced a solid pulldown over the last week. Given the market-wide uncertainties, the bulls have been struggling to reclaim their edge.
Read Chainlink’s [LINK] Price Prediction 2023-2024
At the time of writing, the buyers found a convincing close above the reversal pattern, but can they propel a streak of green candles?
At press time, LINK traded at $6.408, up by 5.69% in the last 24 hours.
How the EMAs can pose barriers in this breakout rally
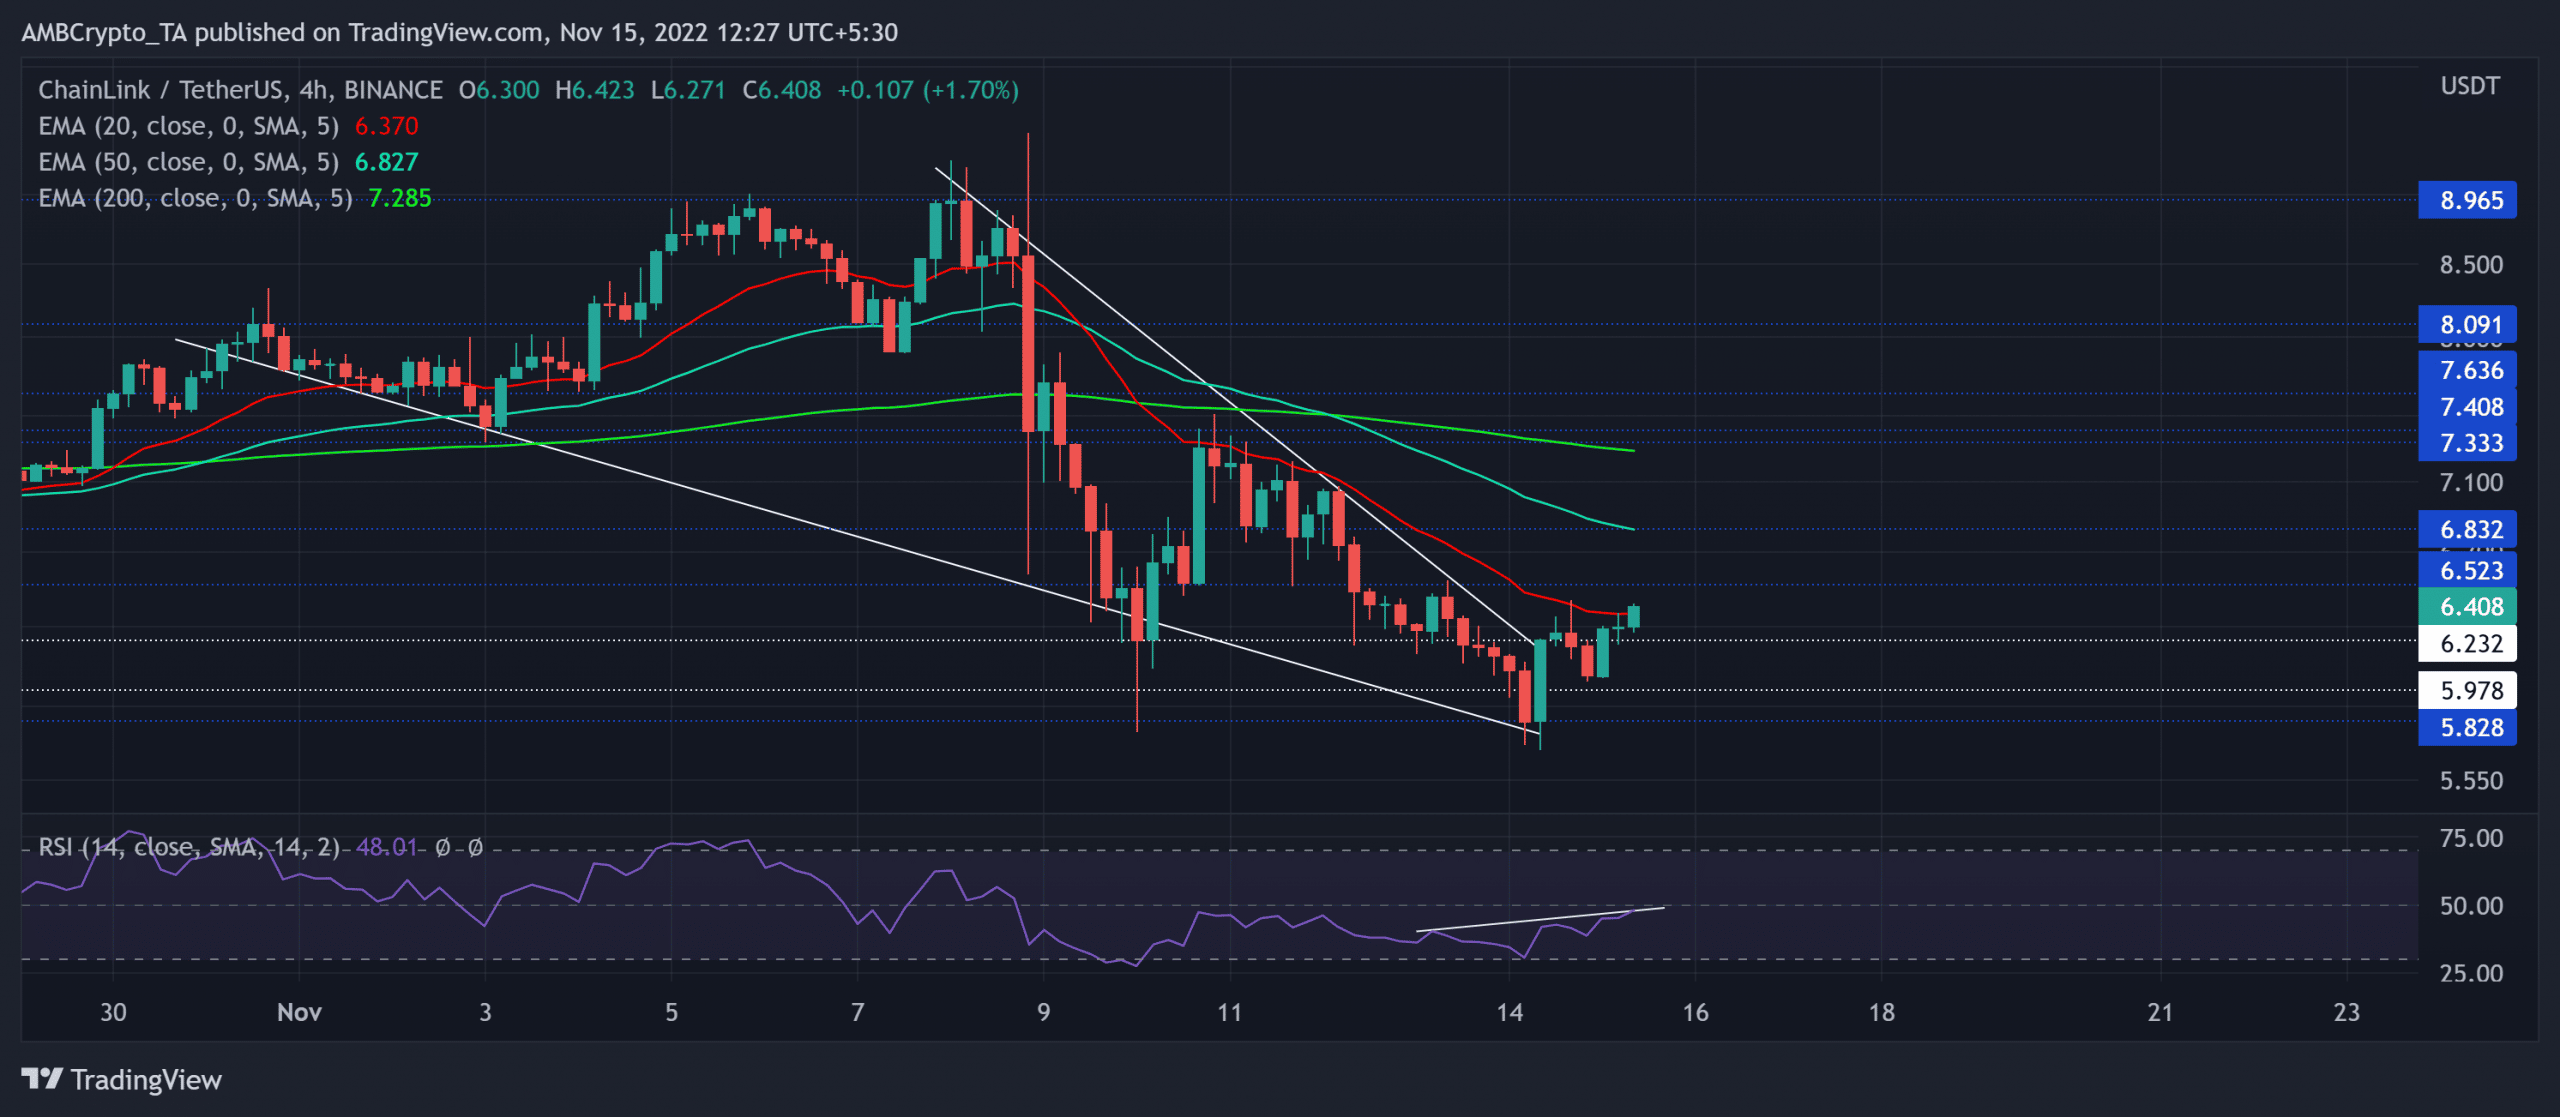
A string of lower highs and troughs in the last week pulled LINK toward its long-term support in the $5.8 region. In the meantime, the altcoin witnessed a descending wedge in the four-hour timeframe.
After an over 35% depreciation from the $9 ceiling, LINK now exhibited rebounding inclinations. With a bullish engulfing candlestick inflicting a patterned breakout, the buyers unveiled their intentions to challenge the limitations of the EMAs. The ongoing bull run propelled the price to crawl above the $6.2 support.
A reversal from its 20 EMA (red) can put the alt in a rather dull, low-volatility phase in the coming sessions. While the $5.9-$6.2 range could offer rebounding tendencies, buyers must strive to close above the 20 EMA to reignite some revival hopes.
In such circumstances, the buyers would look to test the $6.8 resistance followed by the 200 EMA. Any decline below the $5.8 support would hint at a selling signal by invalidating all bullish inclinations.
The Relative Strength Index’s (RSI) rise from its oversold lows entailed a streak of higher peaks that bearishly diverged with the price. Also, the index approached the midline. So, any reversals can reaffirm the underlying selling edge.
Open Interest analysis
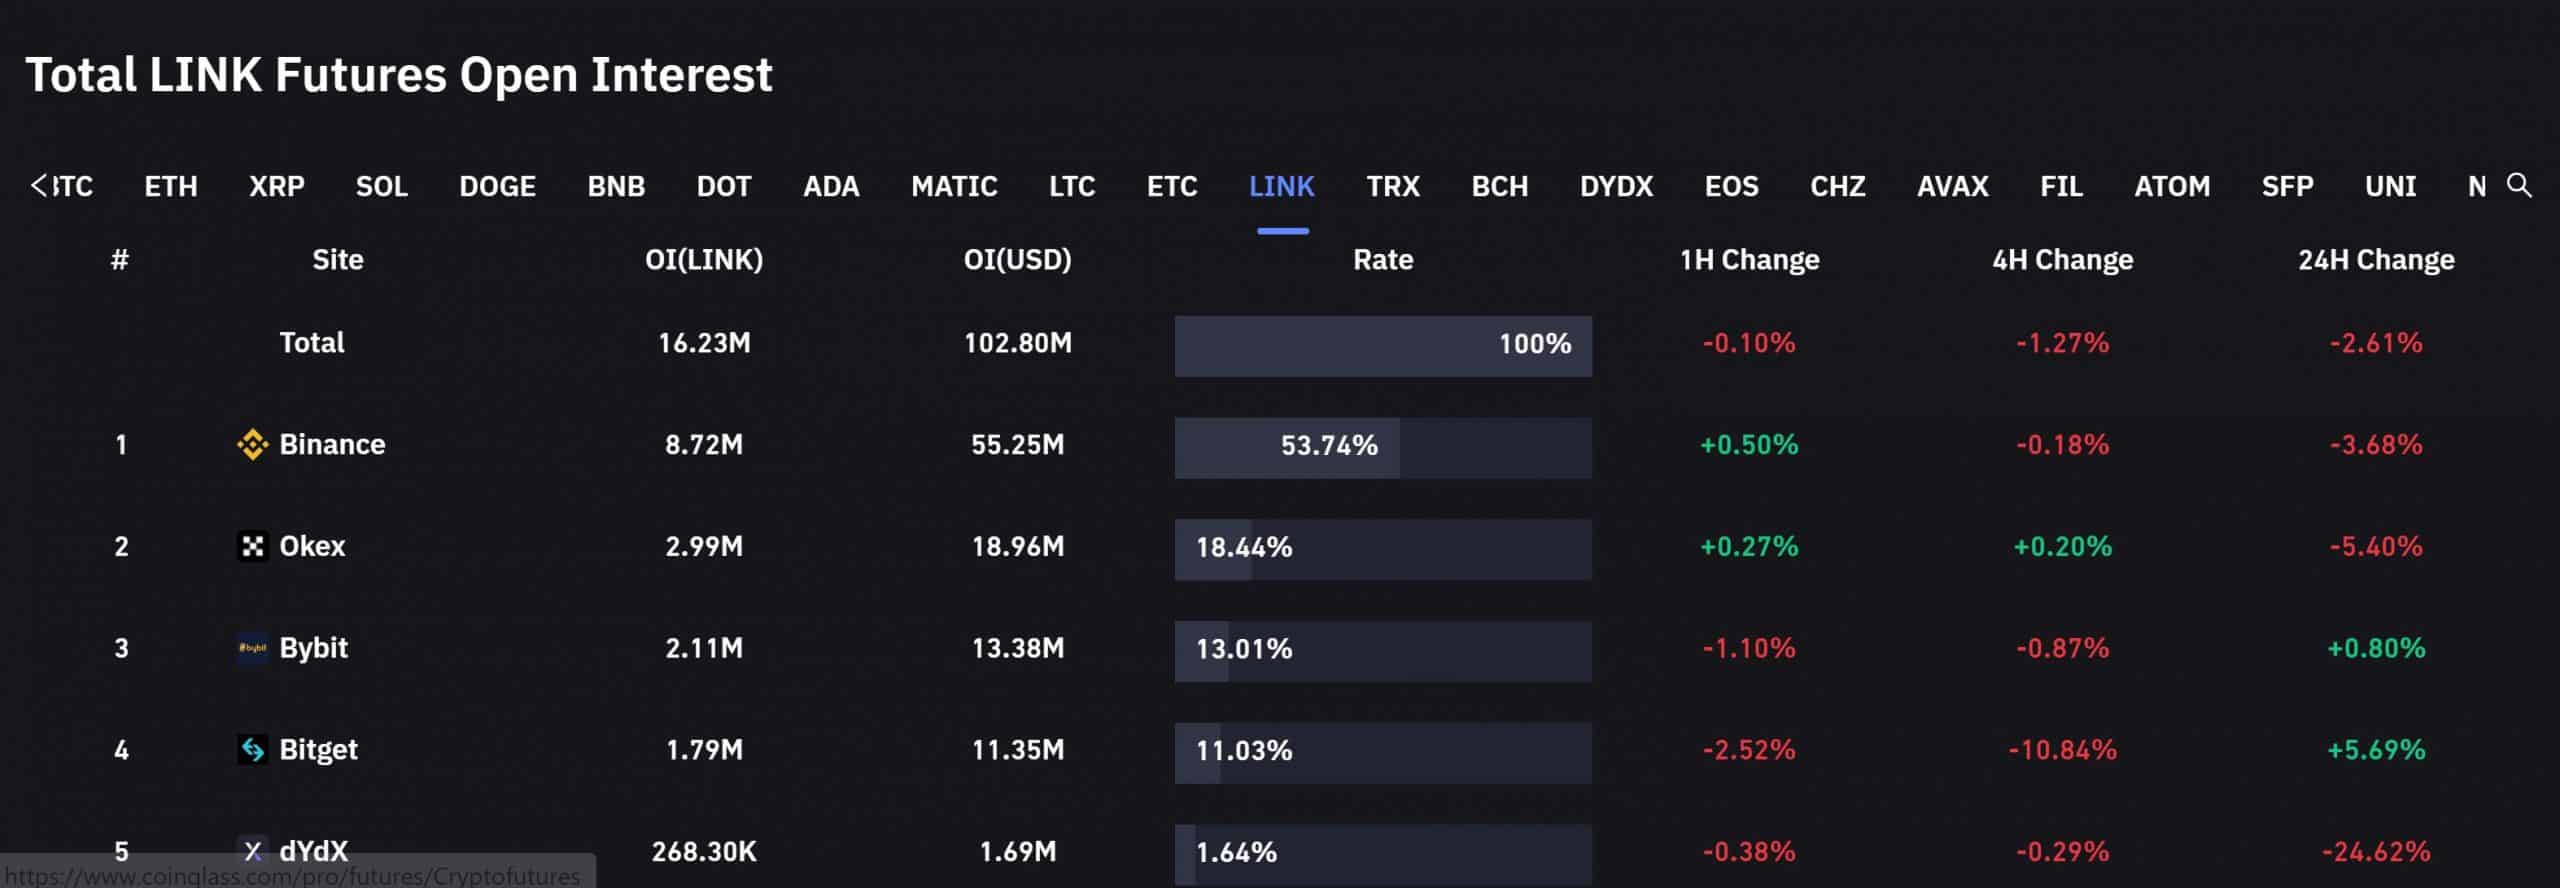
According to data from Coinglass, LINK saw a 2.61% decline in its Open Interest across all exchanges in the past 24 hours. On the other hand, the price marked a spike on its daily charts. Generally, such a combination hints at money flowing out of the market. Thus, buyers should closely watch the Open Interest to gauge futures market sentiment.
Nonetheless, the targets would remain the same as discussed. Finally, LINK shared a 77% 30-day correlation with the king coin. A close eye on Bitcoin’s movement would be imperative to make a profitable move.