Chainlink: How LINK traders can use this to remain profitable

Disclaimer: The findings of the following analysis are the sole opinions of the writer and should not be considered investment advice.
Chainlink’s [LINK] previous descending triangle setup rekindled the selling edge as the alt fell below its 4-hour EMA ribbons. As a result, the altcoin plunged to test the $6.1-zone before marking admirable growth over the past week.
As the bulls encouraged LINK’s position above the EMA ribbons, the outlook for the alt took a bullish flip. While recent movements propelled a bullish structure, LINK might aim to continue its buying spree with the EMA ribbons providing immediate support.
At press time, LINK was trading at $7.711.
LINK 4-hour Chart
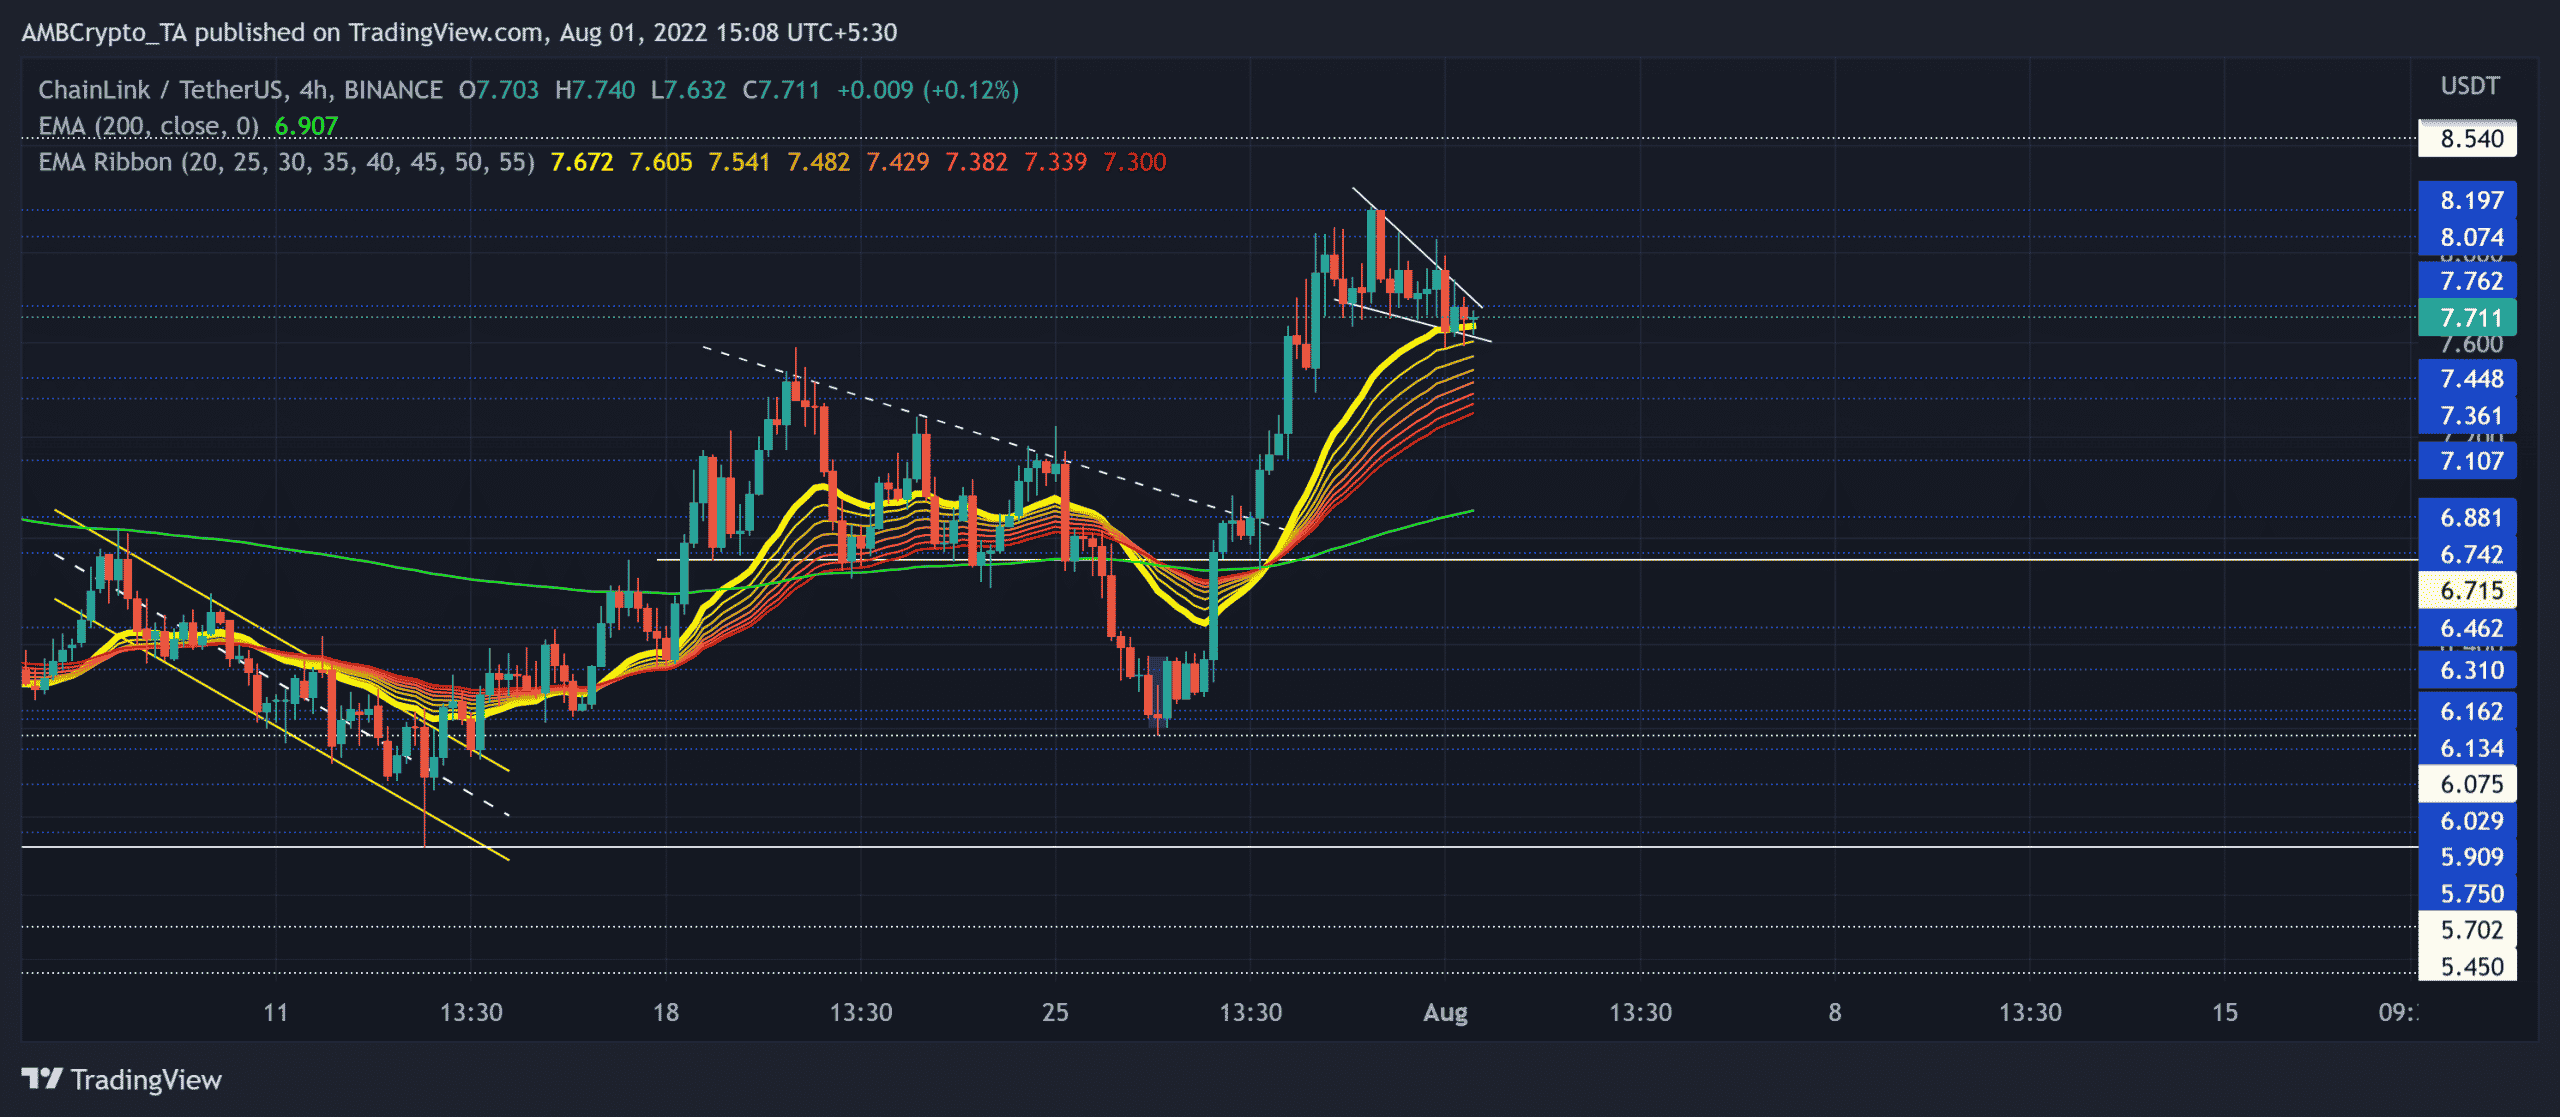
LINK’s reversal from the $7.4-mark resulted in a descending triangle structure over this timeframe. The sellers inflicted a series of lower highs alongside flatter lows in the $61.7 region.
The resultant breakdown pulled LINK by over 10% within a day. Consequently, it took a dive towards its multi-weekly low on 26 July.
The last four days observed a strong buying comeback while the alt jumped above the 200 EMA (green) to depict a rather long-term edge. To top it up, the morning star candlestick pattern aided the bulls in reinforcing their vigor. The compelling rebound from the $6.3-level entailed a 30% ROI that pushed the alt to its month-long high on 30 July.
Meanwhile, the altcoin noted a bullish pennant structure, one that resonated with the buying advantage. A close above this pattern could aid the buyers in testing the $8.1-$8.5 range in the coming sessions. Any bullish invalidations could continue finding support near the EMA ribbons in the $7.3 zone.
Rationale
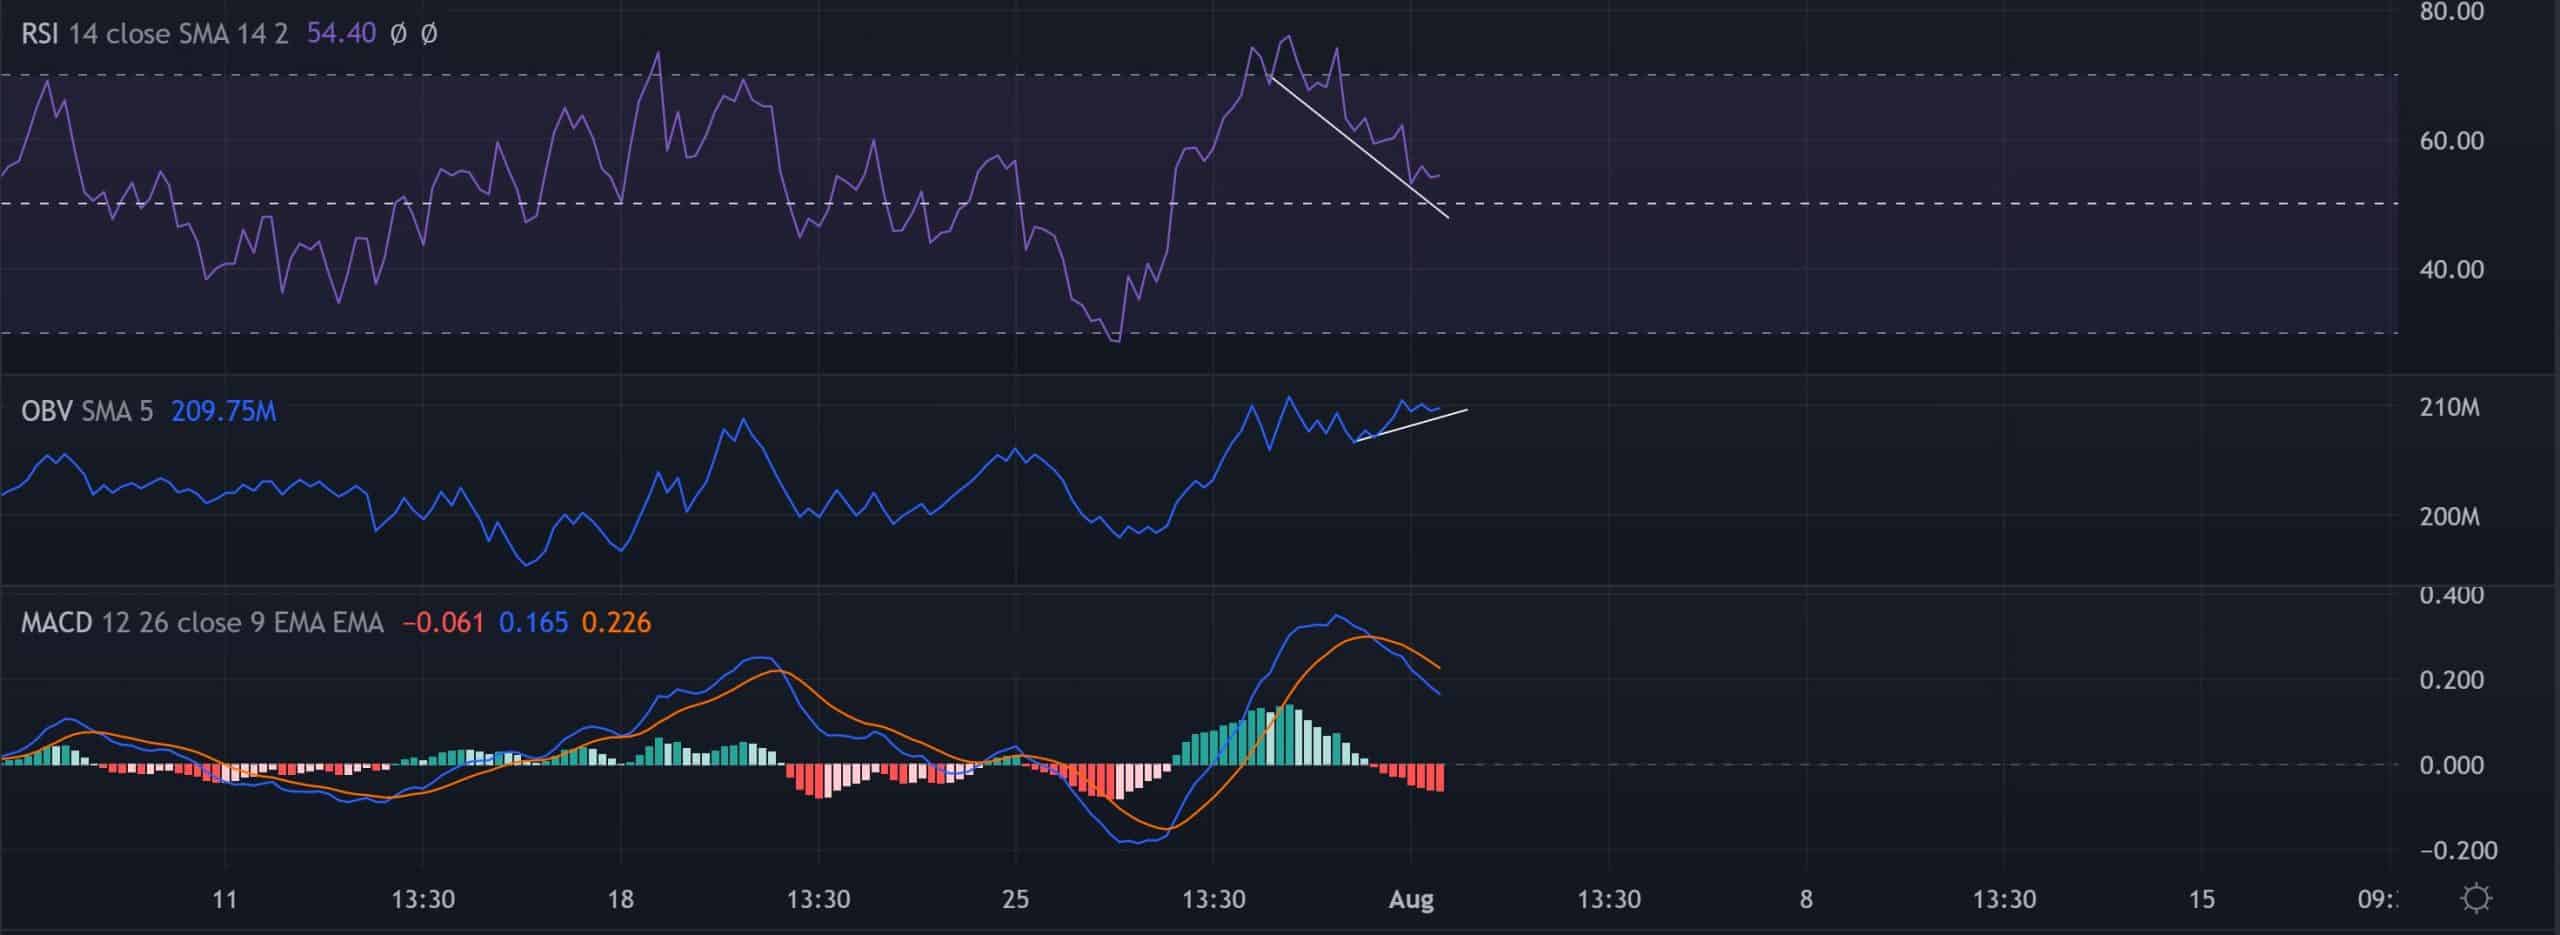
The Relative Strength Index (RSI) maintained a position above the midline to project a slight bullish edge. Also, its recent troughs have bullishly diverged with the price.
Furthermore, the OBV noted a gradual hike in its lows. Like the RSI, any reversals from its trendline support line could confirm a bullish divergence. Interestingly, the MACD lines undertook a bearish crossover. However, they were yet to drop below the zero-mark to confirm the bearish edge.
Conclusion
Owing to the bullish pennant structure above the EMA ribbons and the 200 EMA, LINK could see an upside in the coming sessions. Any bullish invalidations could see a bounce-back from the EMA ribbons. In either case, the potential targets would remain the same as discussed.
Finally, an overall market sentiment analysis becomes vital to complement the technical factors to make a profitable move.