Chainlink: Is another rally in the works for LINK?
AMBCrypto analyzed the data from Santiment and noted that the transaction volume and active users were high earlier this month.

- Chainlink noted a discrepancy between the NVT and price trend in November.
- This pointed toward a robust user base and could pave the way for further price gains.
Chainlink [LINK] has traded within a higher timeframe range since November. However, the price saw a strong rally previously in October.
Despite these gains, the Network Value to Transactions Ratio has been in decline since September.
This suggested that user adoption was likely high. To find out why, AMBCrypto looked at other on-chain metrics. Another question of whether the LINK token was undervalued arose as well.
What is the NVT and why does it matter?
The Network Value to Transactions ratio, or NVT ratio, is a metric available on Glassnode, among other platforms. It is computed by dividing the market capitalization of the token by its transferred on-chain volume, measured in USD.
The 7-day moving average of this ratio trended downward from 17th September to 12th November. Since then, the ratio has slowly climbed higher. During this time Chainlink embarked on a swift rally.
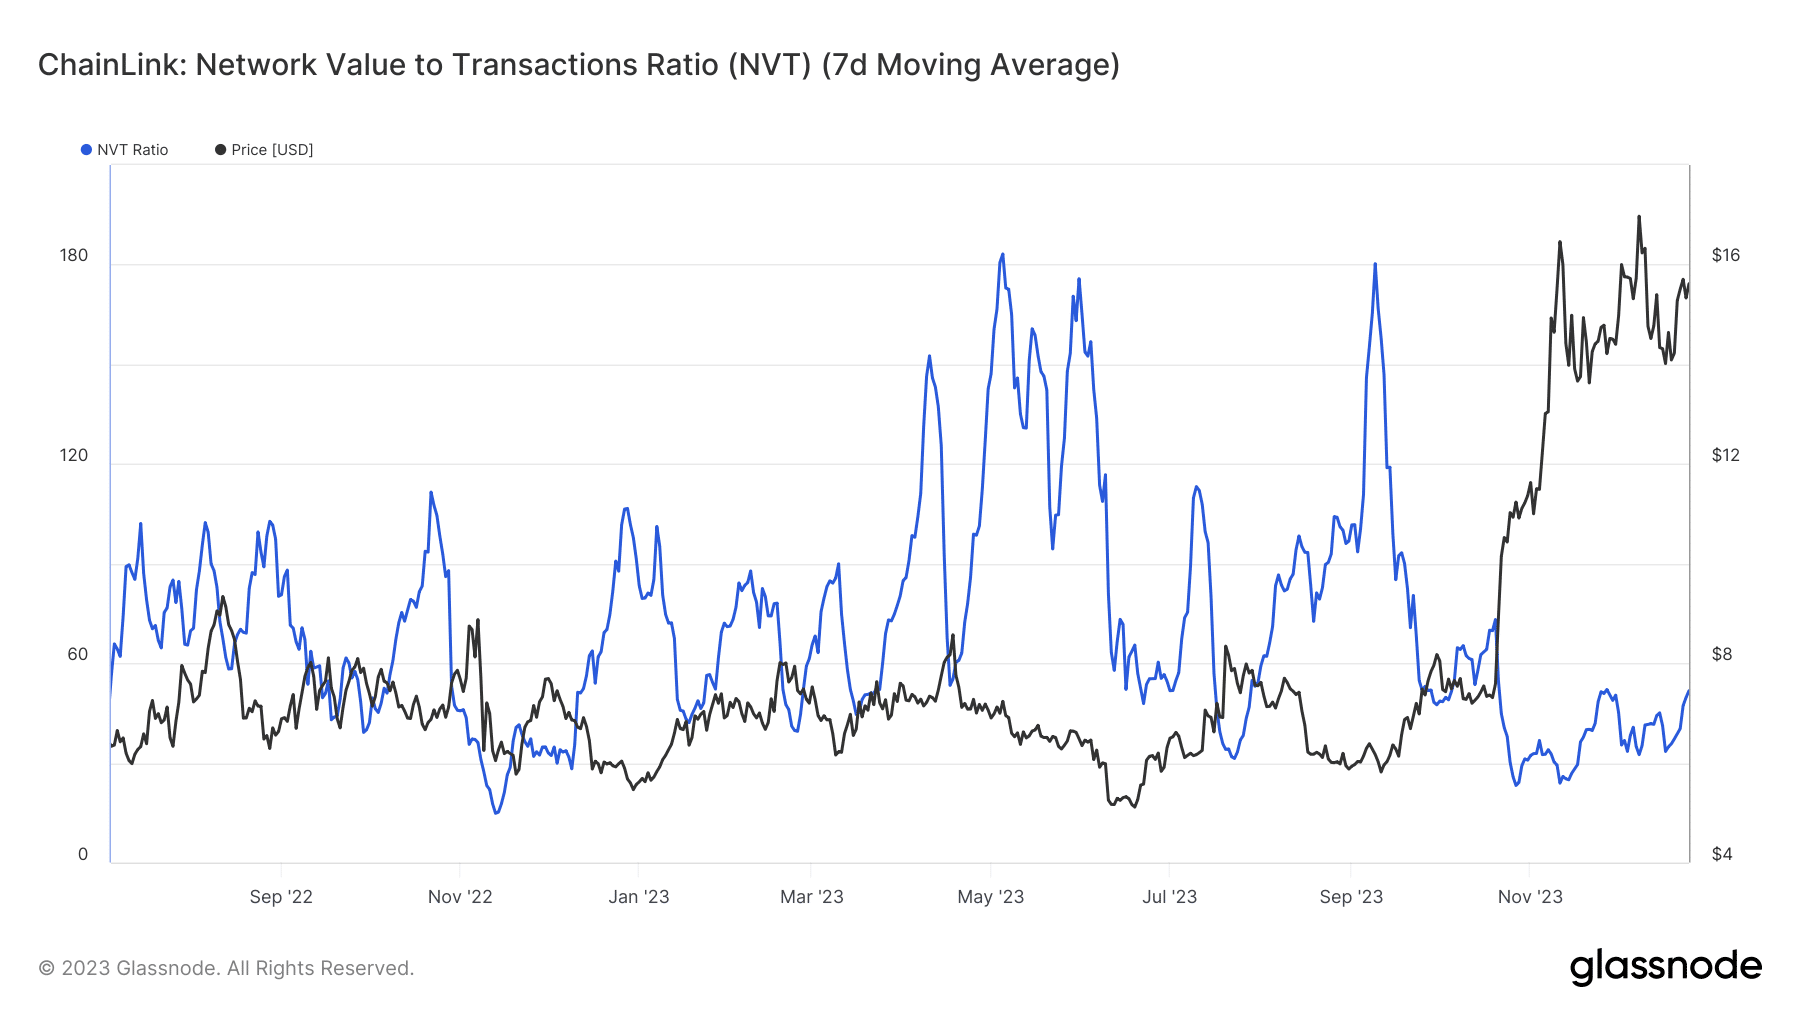
At press time, it was trading within a range that extended from $13.3 to $16.6. The falling NVT ratio and rising prices meant user adoption was strong. It also pointed to the possibility that the token was undervalued.
To investigate this further, AMBCrypto looked at other relevant metrics as well as the price action of LINK.
What do user adoption and increased transactions imply?
The Chainlink investor who is holding LINK for the long term is likely feeling good. The token has performed remarkably well since September, even though it has spent the past six weeks trading within a range.
AMBCrypto analyzed the data from Santiment and noted that the development activity has slowly fallen lower in December. T
his wasn’t a big worry, given the onset of the festive season. The social volume was rapidly rising till mid-December, but began to decline over the past two weeks.

The transaction volume saw sharp upward spikes, but the lows it formed has been much higher compared to late September. The active addresses rose higher from September to mid-November.
It also spiked higher in the first half of December. Taken together, these metrics pointed toward increased network activity and adoption.
Interestingly, during the time the NVT ratio was falling and the price was rising in early November, the MVRV ratio shot higher. This showed that the asset was potentially overvalued.
However, the MVRV has sunk toward zero once more even as LINK continued to consolidate. This could be bullish for the token in the coming months.
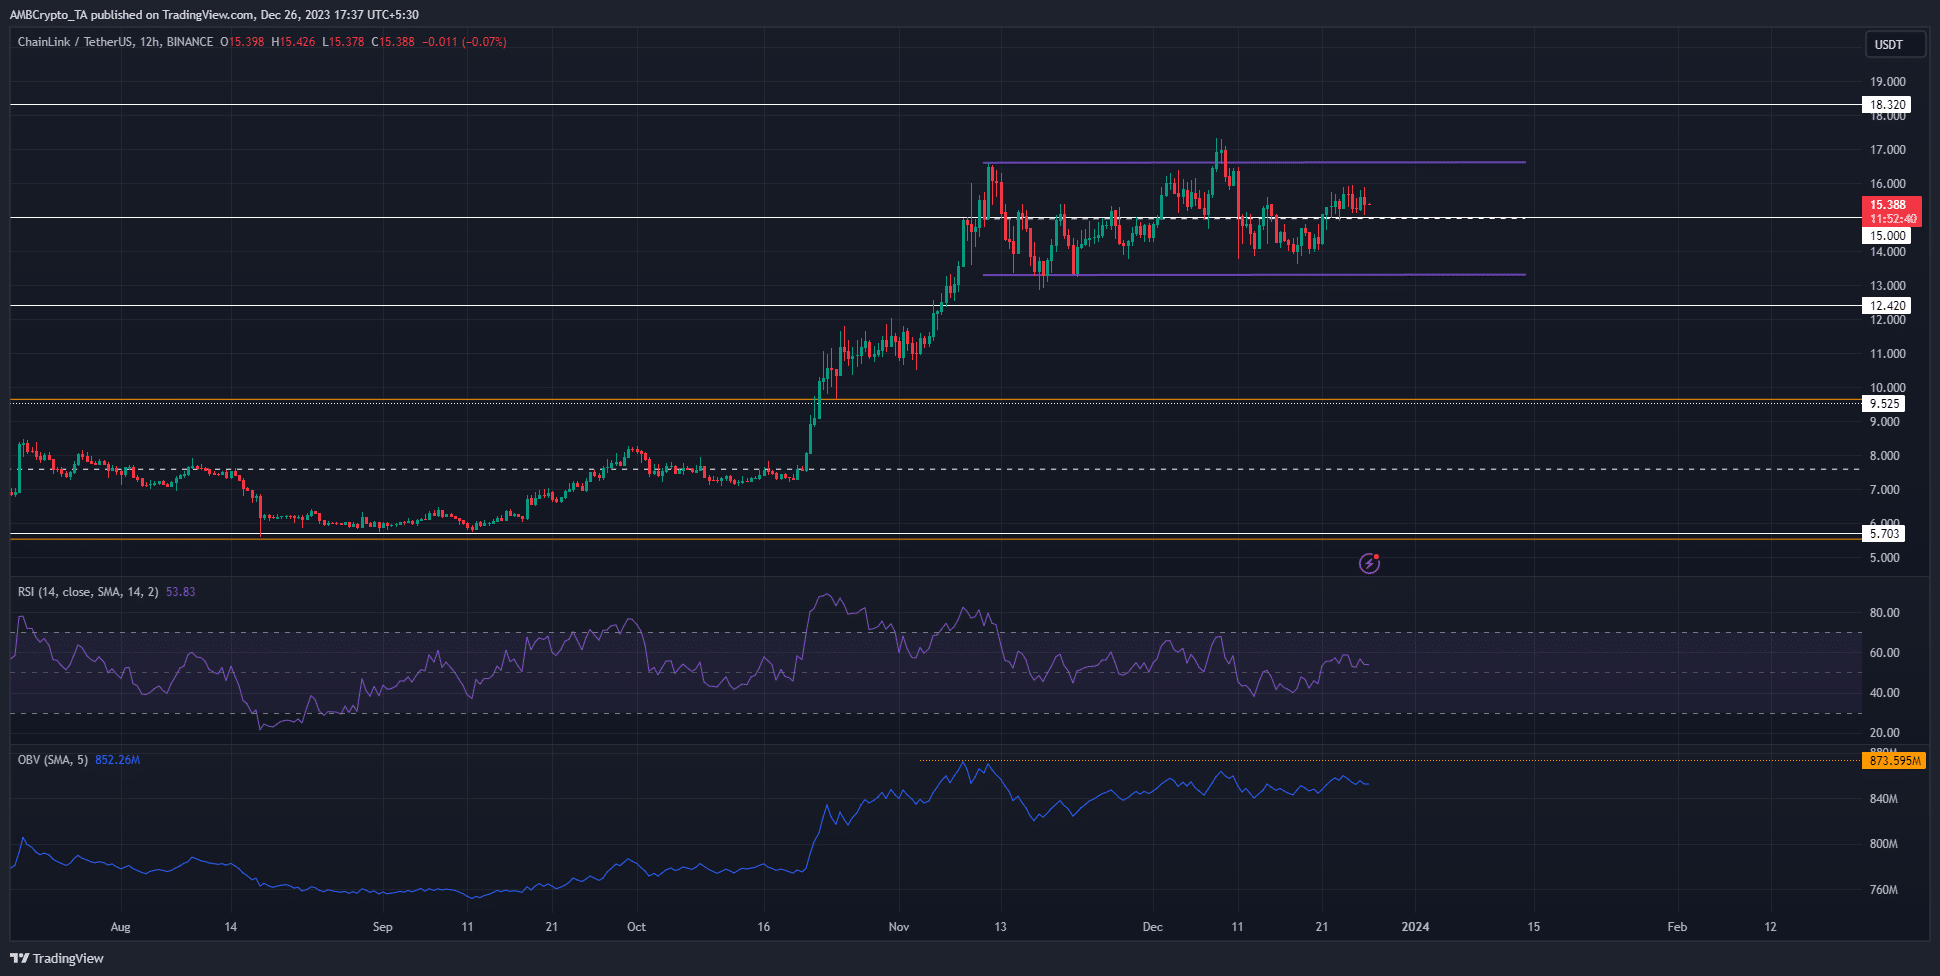
The price chart showed the aforementioned range formation in purple. The $15 level acted as a mid-range support/resistance level.
It was also an important higher timeframe level. The RSI on the 12-hour chart was at 53, after sinking to 38 on 13 December.
Read Chainlink’s [LINK] Price Prediction 2023-24
LINK was above the $15 mark once more and is expected to rise toward the range highs at $16.6. Yet, the OBV was unable to break above a key local high.
Once this occurs, the implication is that buyers were again in control, and would be in a position to enforce a breakout past $16.6.