Chainlink: Mapping out the red flags in LINK’s recent bull run

Disclaimer: The findings of the following analysis are the sole opinions of the writer and should not be considered investment advice.
Chainlink’s (LINK) recent inverse head and shoulder breakout led the alt to snap through the EMA ribbons for the first time in over two months.
While the long-term trend still revealed bearishness, LINK bulls finally pulled off a streak of bullish engulfing candlesticks.
But is this enough for a trend reversal? A closer look into the technicals alongside market sentiment analysis can help us determine that.
At press time, LINK traded at $9.2, Up by 8.33% in the last 24 hours.
LINK Daily Chart
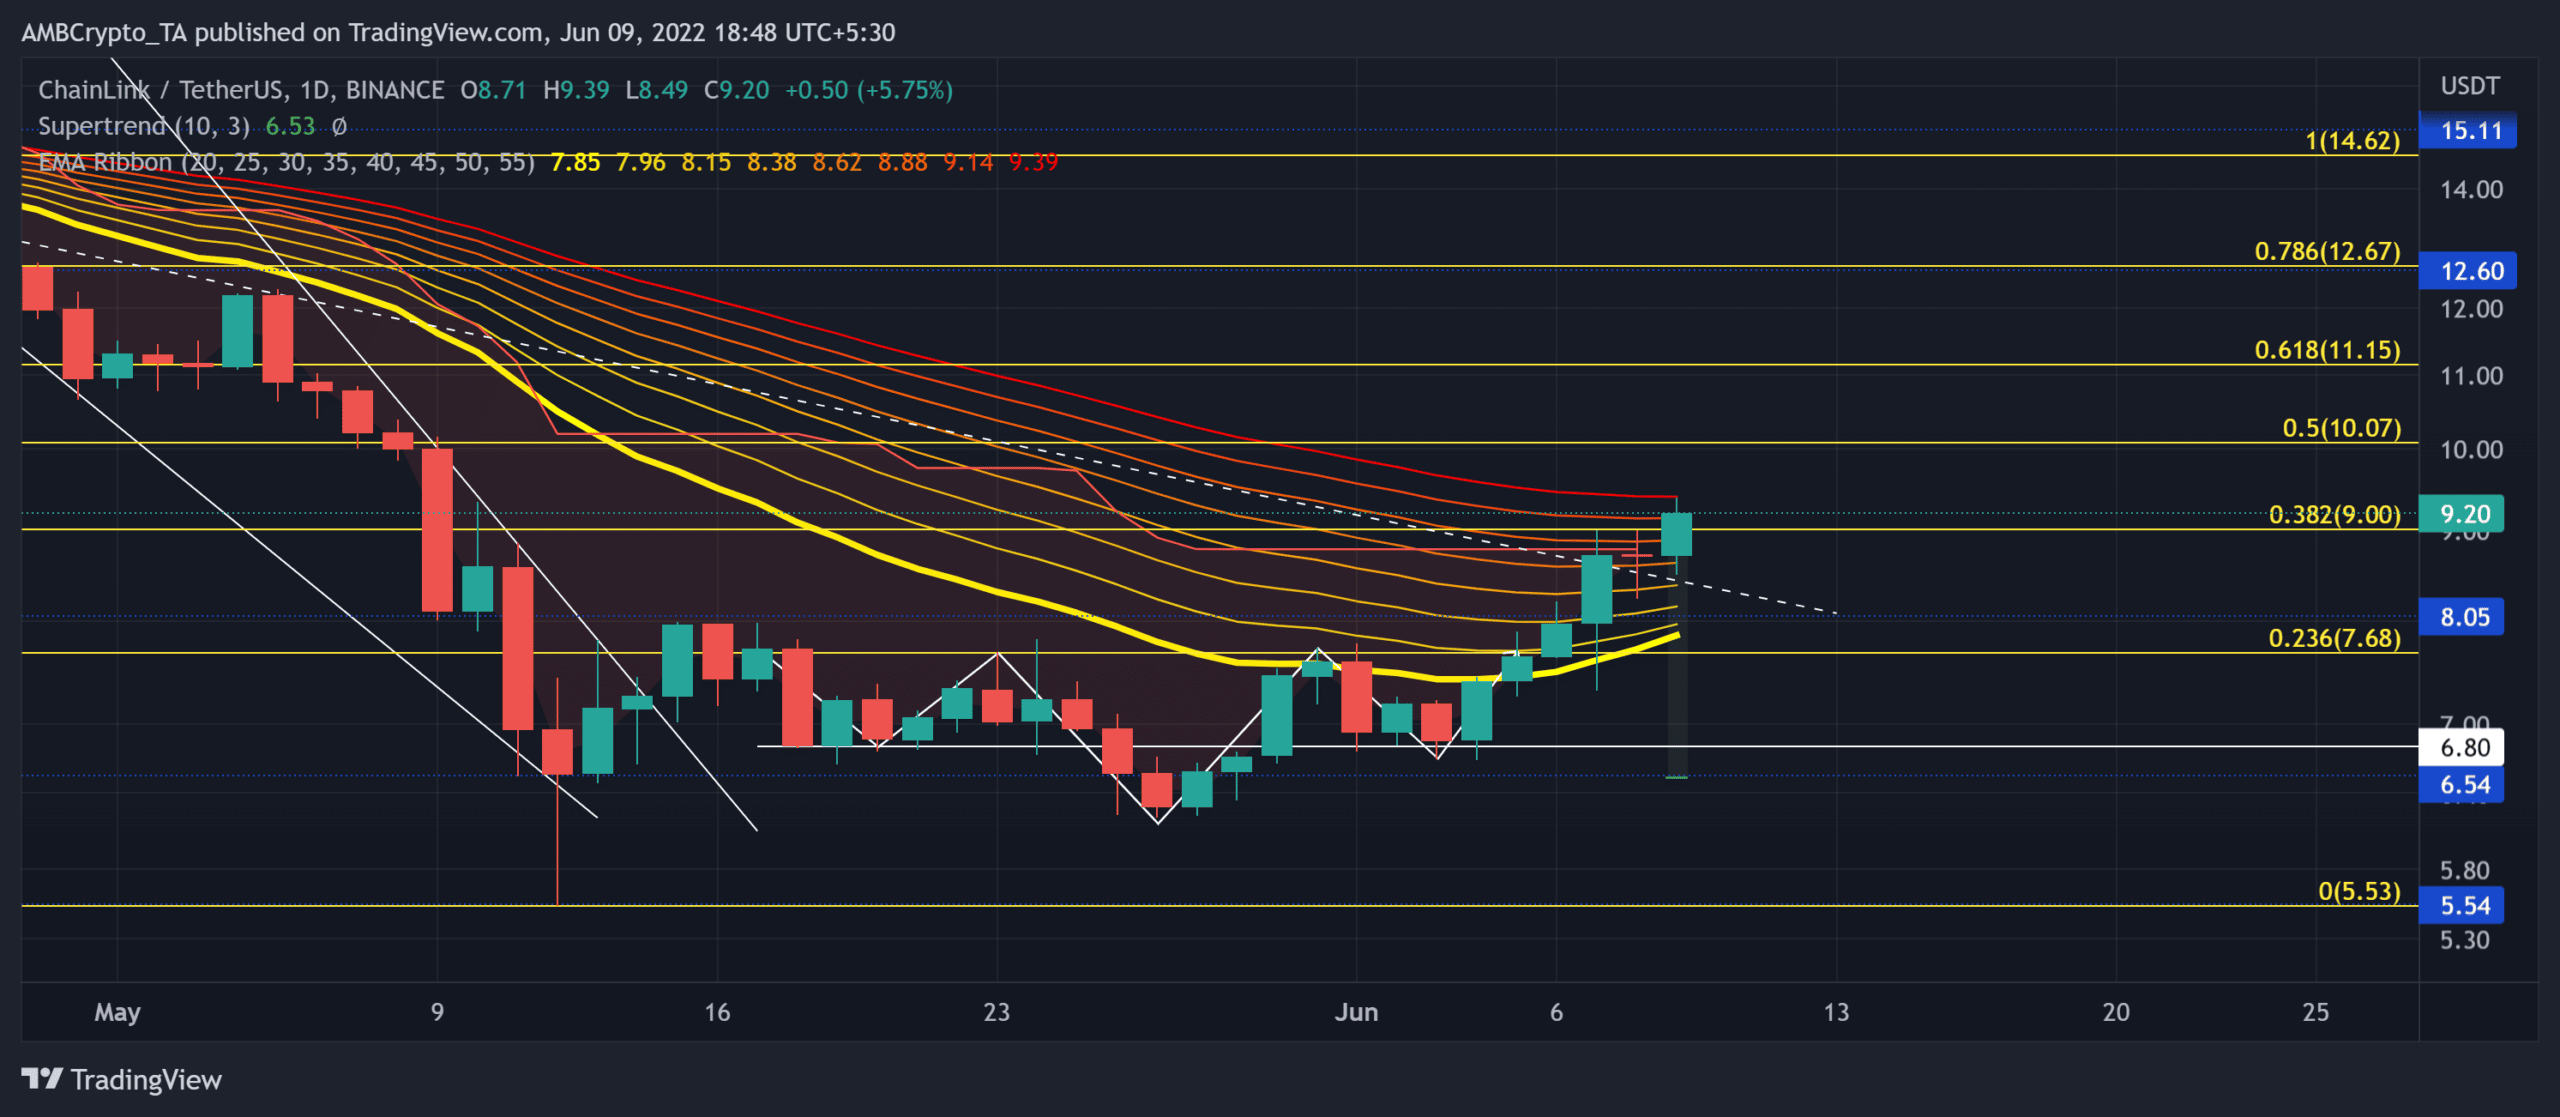
After dropping to its record 22-month low on 12 May, the selling pressure finally eased over the last few days. After a three-week consolidation near the $6.5-area, the inverse head and shoulder pattern finally played out in favor of bulls.
Further, this gave LINK enough firepower to topple the two-month trendline resistance and flip it to immediate support. Consequently, the Supertrend pivoted to the green zone after many weeks.
Taking into consideration the recent bullish hammer candlestick, a continued revival beyond the 55 EMA can pave a path for further recovery in the coming times. The bulls would aim to target the $10-$11 range after closing above the EMA ribbons.
Any reversals from the 55 EMA could see a pullback toward the immediate trendline support whilst the recovery gets delayed.
Rationale
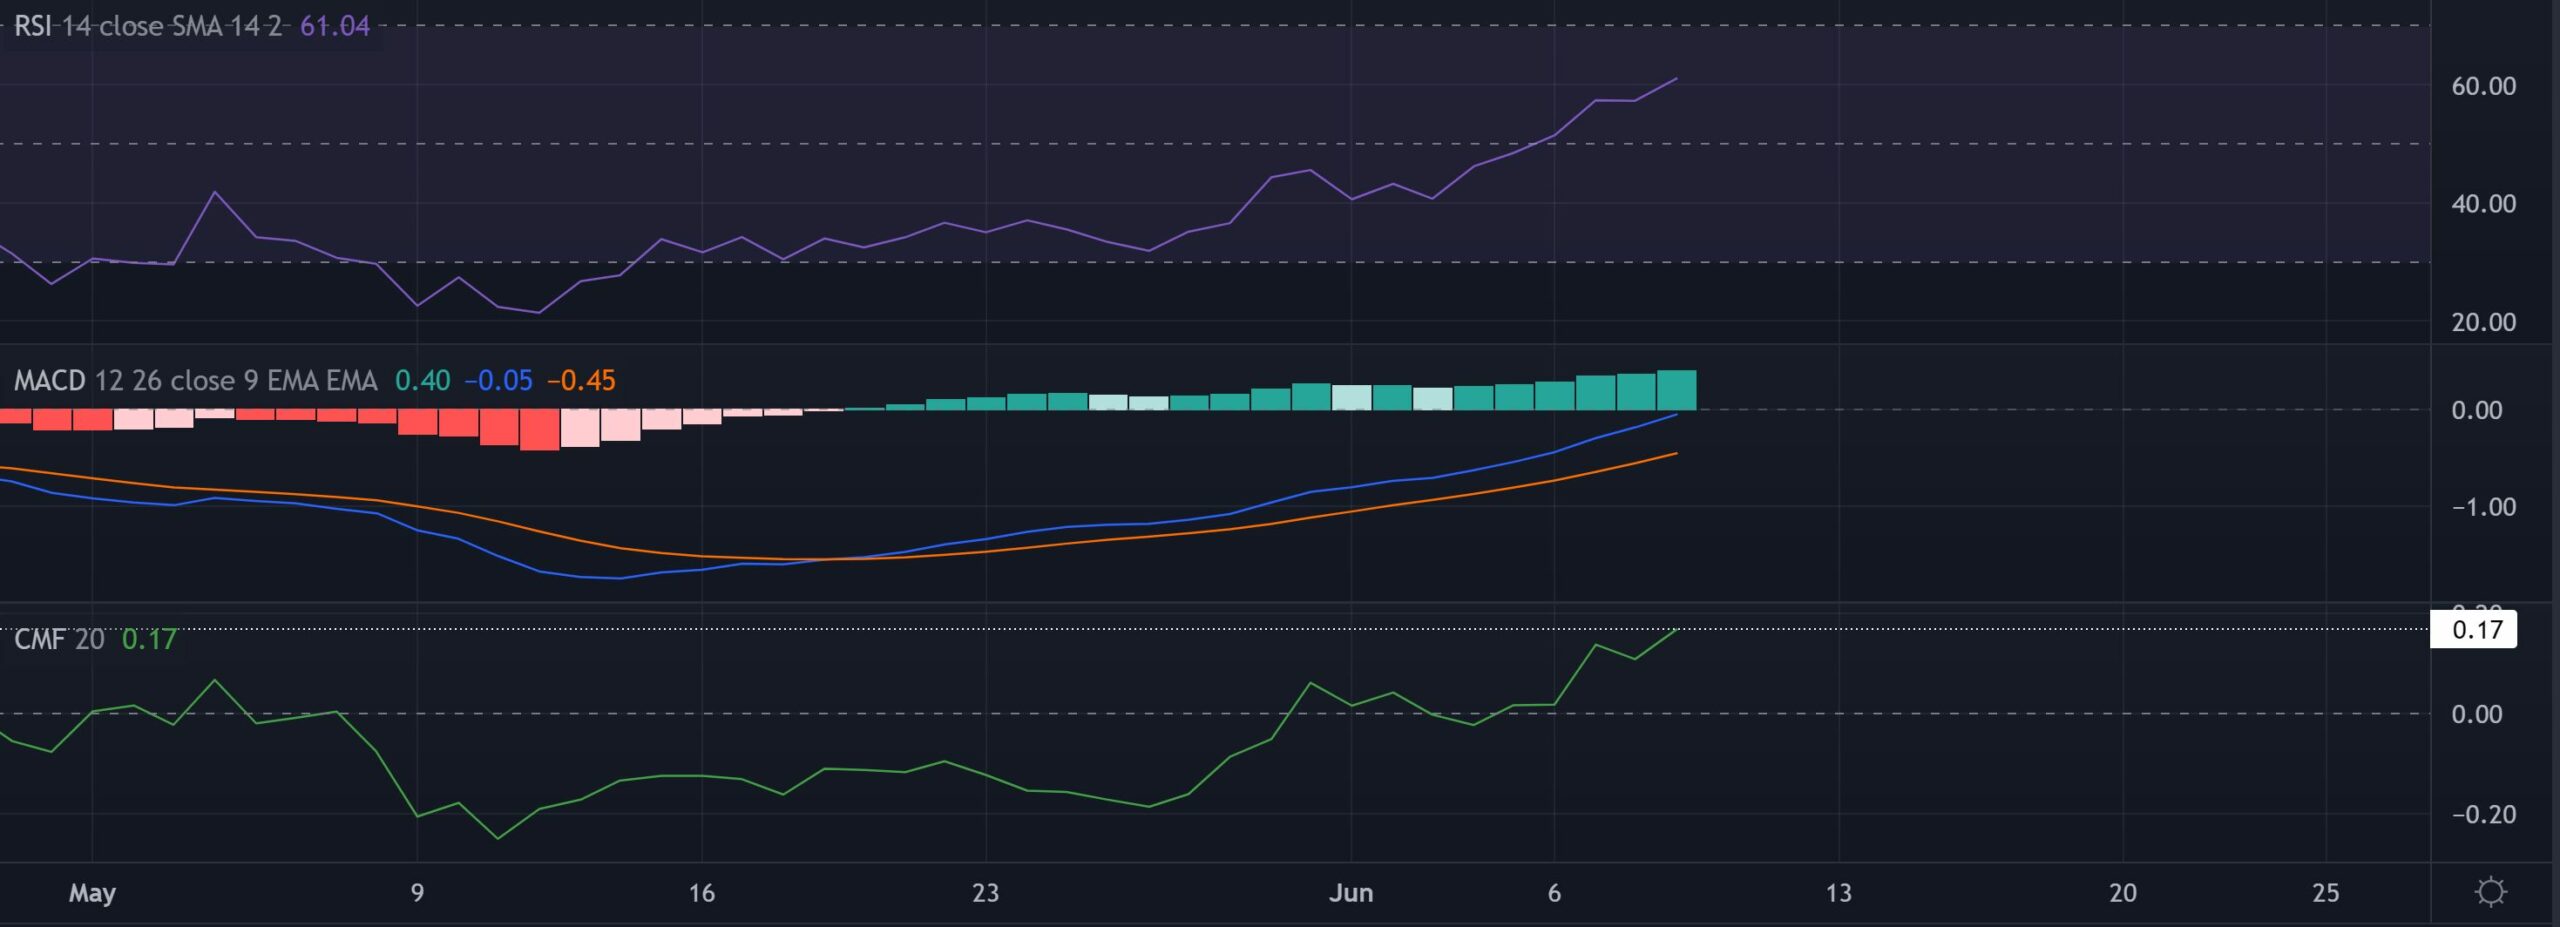
The RSI showed a strong revival after jumping above the equilibrium. Despite the recent gains, it has still not attained its overbought mark. Thus, the bulls still had the potential to clinch in a short-term rally.
The MACD line (blue) saw a solid and consistent growth over the last few weeks. A close above the zero-mark would affirm a strong bull momentum. However, the CMF’s reversal from its long-term resistance can delay the immediate recovery prospects.
Conclusion
Given the multiple indications favoring the buyers, any close above the EMA ribbons would pave a path to an eventual test of the 61.8% Fibonacci level. Any reversals due to the threats along the CMF could delay this revival phase.
Also, an overall market sentiment analysis becomes vital to complement the technical factors to make a profitable move.