FTX Token: Can FTT’s recent 15% rally trigger a breakout over this supply zone
Disclaimer: The information presented does not constitute financial, investment, trading, or other types of advice and is solely the opinion of the writer.
FTX Token has lost 28% since the start of May, and the longer-term trend on the charts was bearish for the token. That said, there was an opportunity for lower timeframe traders to hitchhike a ride upwards to the $31.1 mark. A strong zone of resistance stands at the $29 area, and the bulls haven’t yet broken through.
It was a little too early to enter a trade on FTT, as the market was at reaching a decision about the next direction after a breakout from a channel. If the $27.6 area can be defended, there could be a move upwards over the next couple of days.
FTT- 4 Hour Chart
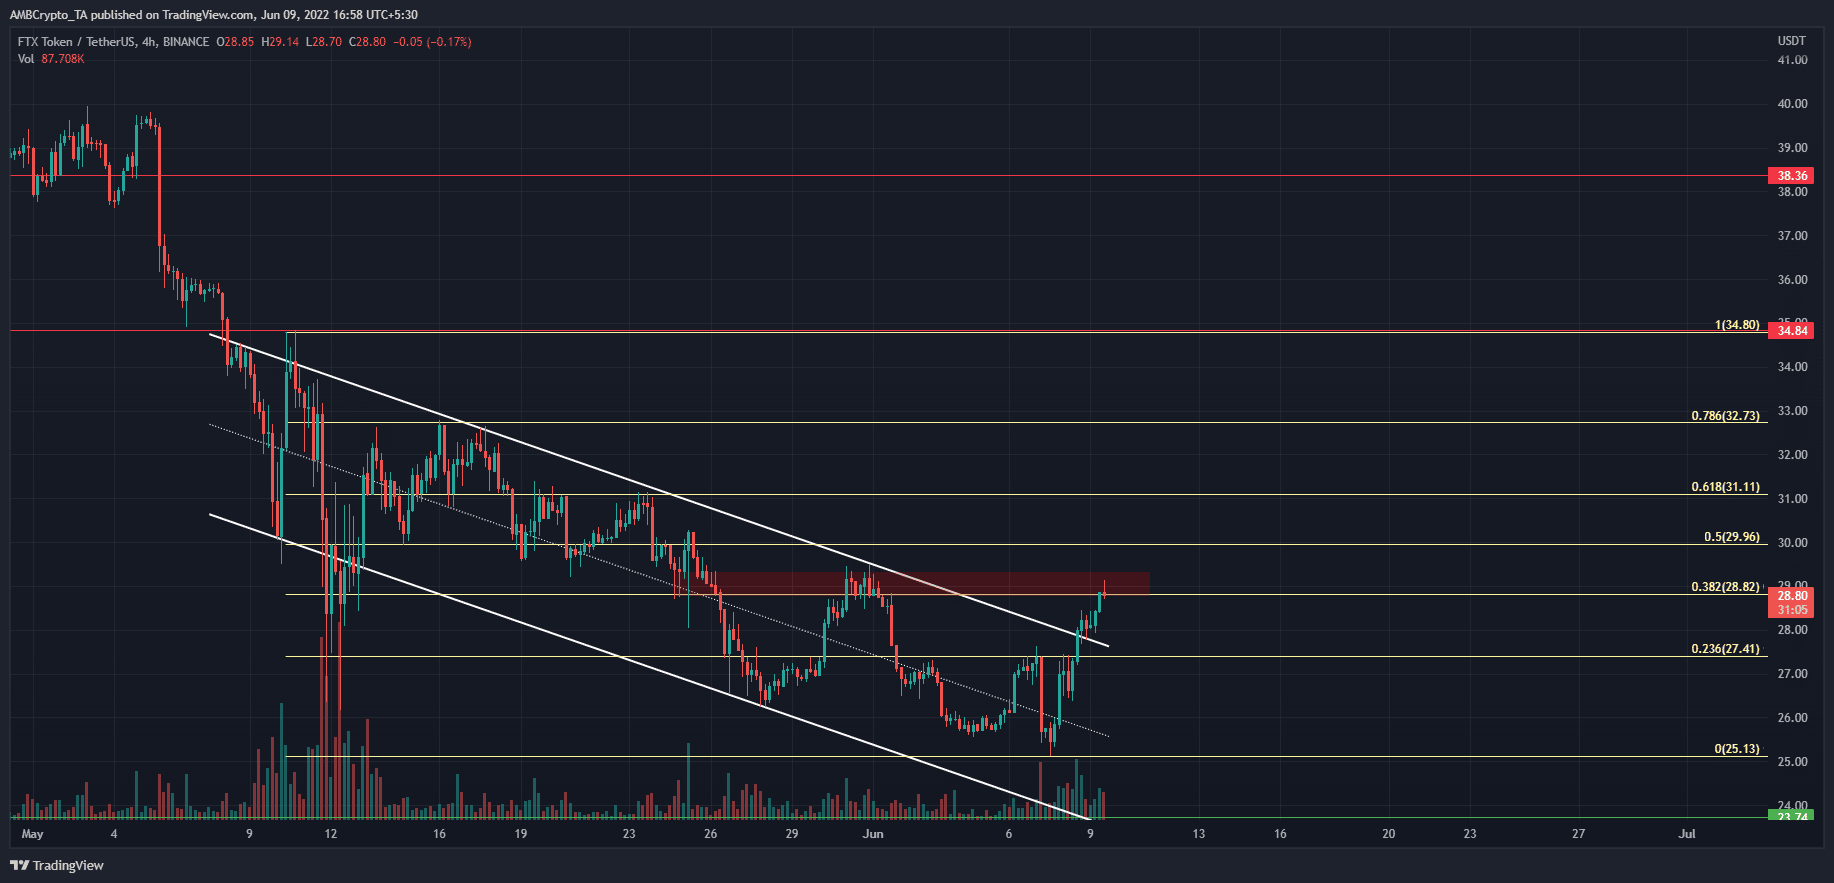
The H4 chart shows a descending channel (white) formation that FTT has traded within for most of the past month. There was a significant deviation as low as $26 during the May 12 drop. Fibonacci retracement levels (pale yellow) were also plotted based on the swing high and swing low at $34.8 and $25.13.
At the time of writing, the price was at the $28.82 level, which was the 38.2% retracement level. The $28.8-$29.5 area could act as strong resistance. The H4 and higher timeframes show a bearish bias for FTT on the charts, based on the price action.
Since early April, the price has set lower highs, and the downtrend was not yet broken.
FTT- 1 Hour Chart
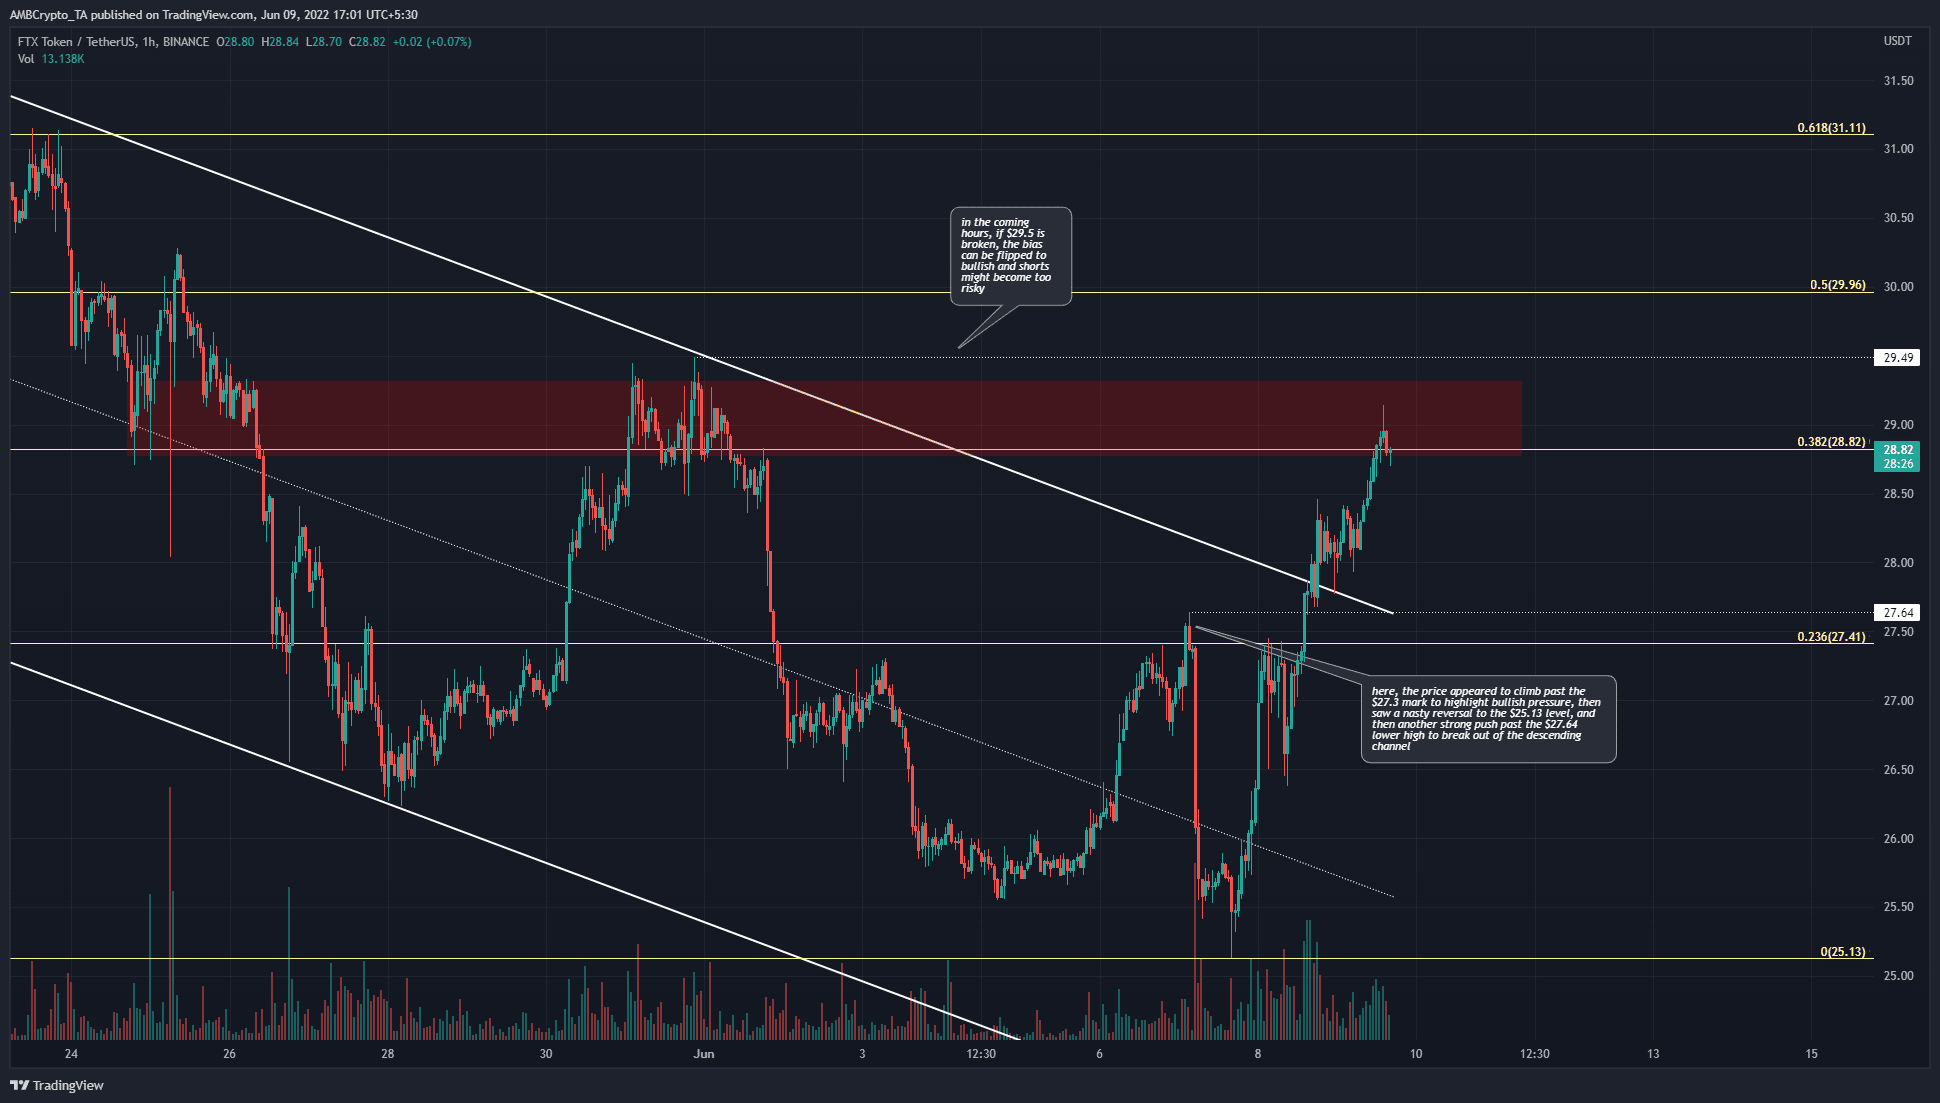
On the H1 chart, the $29.49 level (dotted white) marks a lower high of the downtrend that FTT is on. At the same time, the $27.64 level has been broken in the past couple of days of trading, after a straight red candle took FTT to revisit the $25.6 lows.
On the lower timeframes, the market structure was slightly complicated but had a bullish shorter timeframe outlook. However, this outlook has to be tempered with caution. The higher timeframe bias remains bearish.
Yet, the breakout from the descending channel meant that a move toward the 61.8% retracement level at $31.11 could be on the cards. A temporary rejection at the $29 area could be followed by a retest of the $27.5-$28 area, to form a higher low before a move upward.
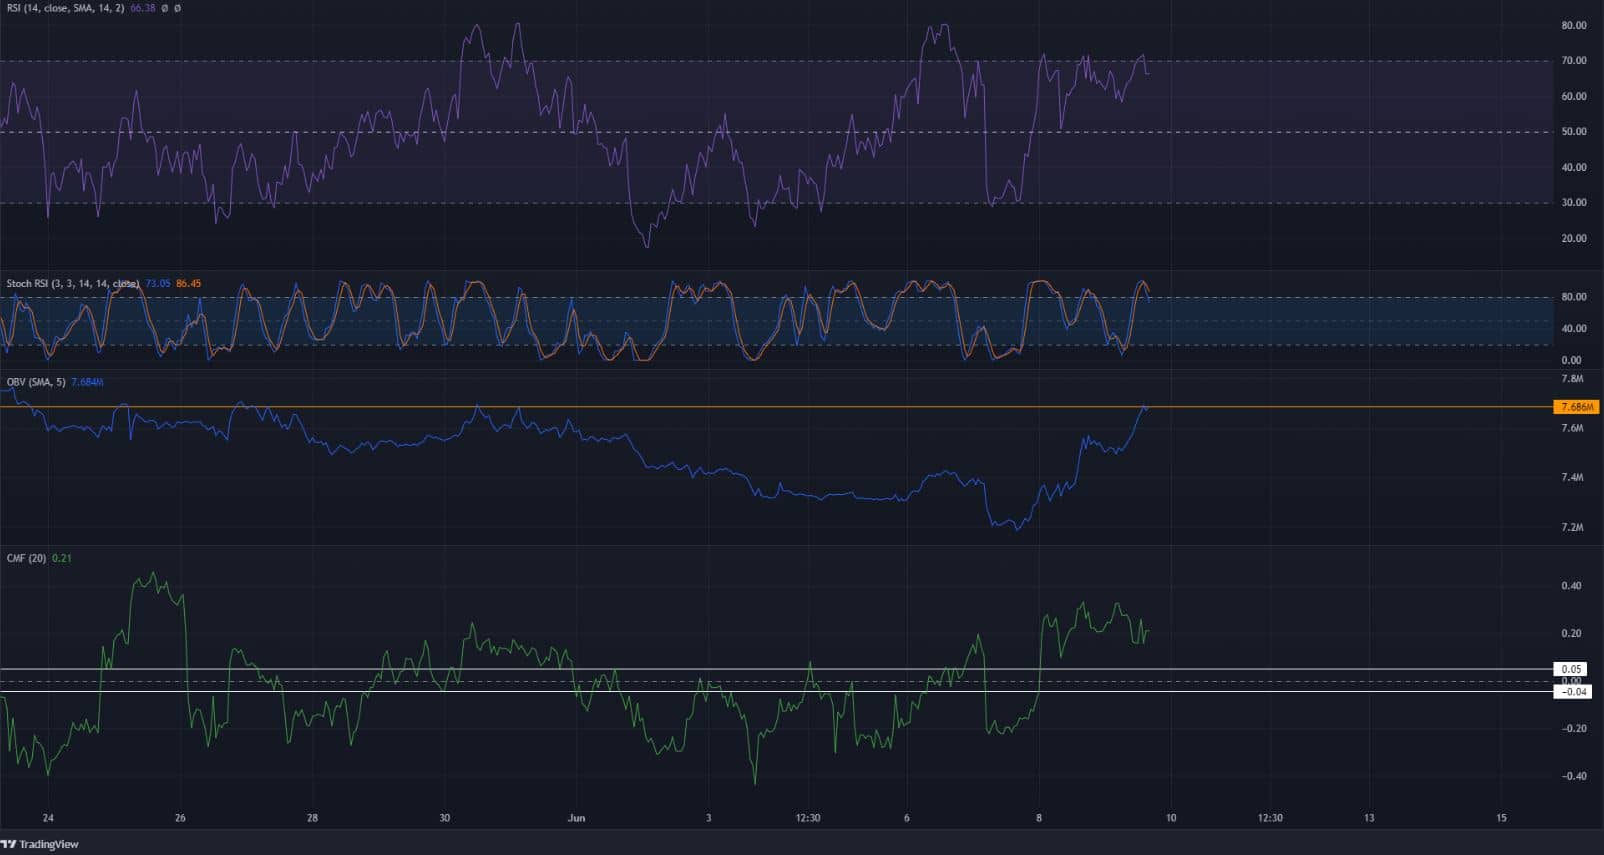
The H1 indicators showed bullishness, as the RSI stood above neutral 50 at 66 while the CMF was at +0.21 to show strong buying pressure. The OBV was at a level of resistance that it hasn’t broken for the whole of May and June thus far.
The Stochastic RSI formed a bearish crossover. However, the short-term market structure was bullish, and the indicators were in agreement.
Conclusion
The bullishness on the H1 chart showed that entering a long position at $27.7-$27.9 could be a more viable trade than attempting to short a retest of the $29 area. It is true that higher timeframe trends are stronger, but having said that, FTT has broken out from a descending channel.
More aggressive traders can view the move to $29 as a sign of bullish intent, and wait for the formation of a higher low in order to ride a move upwards to $30 and $31. An entry at $27.7, with a stop-loss at $27 and a target of $29.5 and $31.1 could be profitable in the days to come.


