Chainlink, MATIC and TRX Price Analysis: 03 March

As the market tried to recover amidst Russia’s escalating tensions, the likes of Chainlink and MATIC projected growth patterns. However, TRX seemed more inclined towards the bears.
Chainlink (LINK)
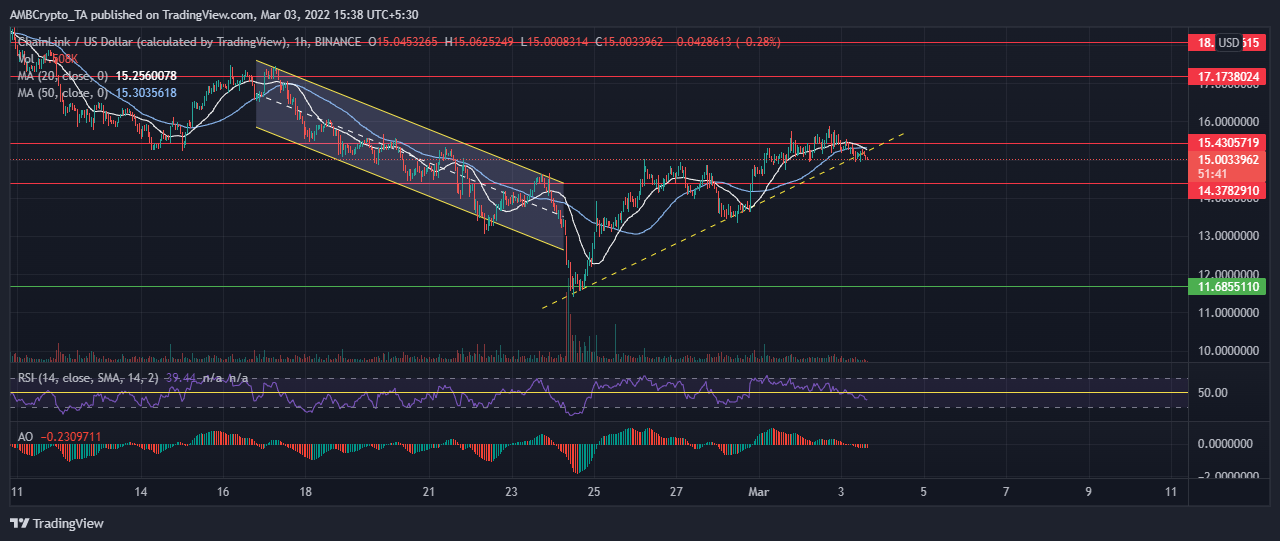
Even though bulls made a desperate attempt to recover from the December crash, LINK dropped to a year low support level of $11.68 on 24 February. Furthermore, continued sell-off amidst the Ukrainian crisis pushed the coin down the charts. However, over the past week, the bulls took over and moved the alt higher. Thus, marking higher peaks and troughs (yellow dashed line).
However, over the past week, LINK gained a solid 28.93%, recovery. Thereby, hitting resistance at the $15.00 level. At press time, the alt traded at $15.04. Notably, there has been a decline in volume over the past two days. Consequently, at the time of writing, LINK did seem to be breaching the trendline support. The RSI dropped sharply from the overbought area to a bearish 39.45. Even the AO confirmed a bearish momentum as it dipped slightly under the zero line.
Polygon (MATIC)
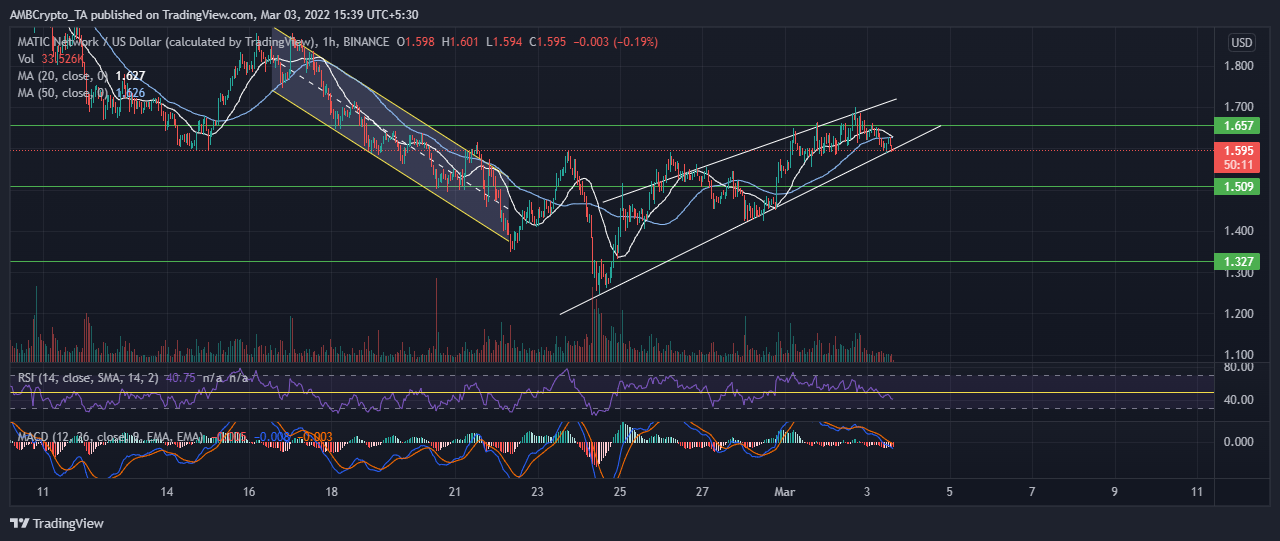
MATIC gained around 27% over the last week after retesting the support level at $1.32. Much like many other coins in the market, MATIC took a plunge as the global tensions escalated due to the Ukrainian conflict. But it quickly recovered. Over the last week, MATIC formed a wedge (white line) as it marked higher lows and reached resistance at the $1.65 level.
Much like Chainlink, MATIC depreciated following a bearish momentum over the last couple of days. During press time, MATIC traded at $1.61, shedding 1.28% over the previous day. The RSI went from an overbought region to 47.63 over the last couple of days. Furtherance of this momentum could lead the alt to breach the trendline support and head for the next support level at $1.50.
TRON (TRX)
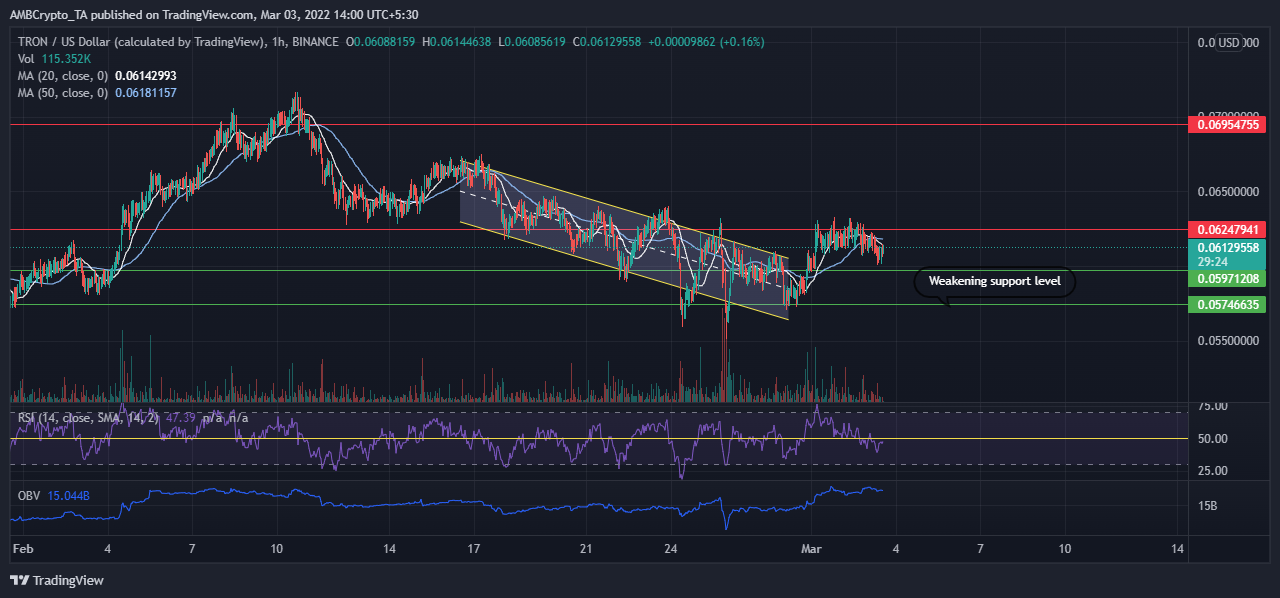
TRX followed a downtrend since mid February before gaining critical support at $0.0574 level on 24 February. However, the same level was retested on 26 and 28 February respectively, thereby weakening it further. A sudden buying pressure helped the alt move up a little. Consequently, the token faced a new resistance at $0.0624 level on 1 March.
However, over the last day, the coin seemed to have run out of steam once again since the volume was declining. The next level of support is at $0.0597. Furthermore, at press time, TRX traded at $0.0612. The RSI stood at 42.74 after the sell-off on 2 March. However, the OBV line indicated that there was a possibility for the coin to move up if the buying pressure kicks in.