Chainlink: Measuring the potential of this ‘bullish pattern’

Disclaimer: The findings of the following analysis are the sole opinions of the writer and should not be considered investment advice
Since hitting its January highs, Chainlink (LINK) bears have made a point to mark lower peaks while testing its 14-month $11.7-support. The most recent fall marked a falling wedge on LINK’s 4-hour chart.
After forming a morning star bullish candlestick pattern, the chances of a close above its long-term Point of control (POC, red) have heightened. In such a case, a recovery towards its trendline resistance (white, dashed) would be probable.
At press time, LINK was trading at $13.28.
LINK 4-hour chart
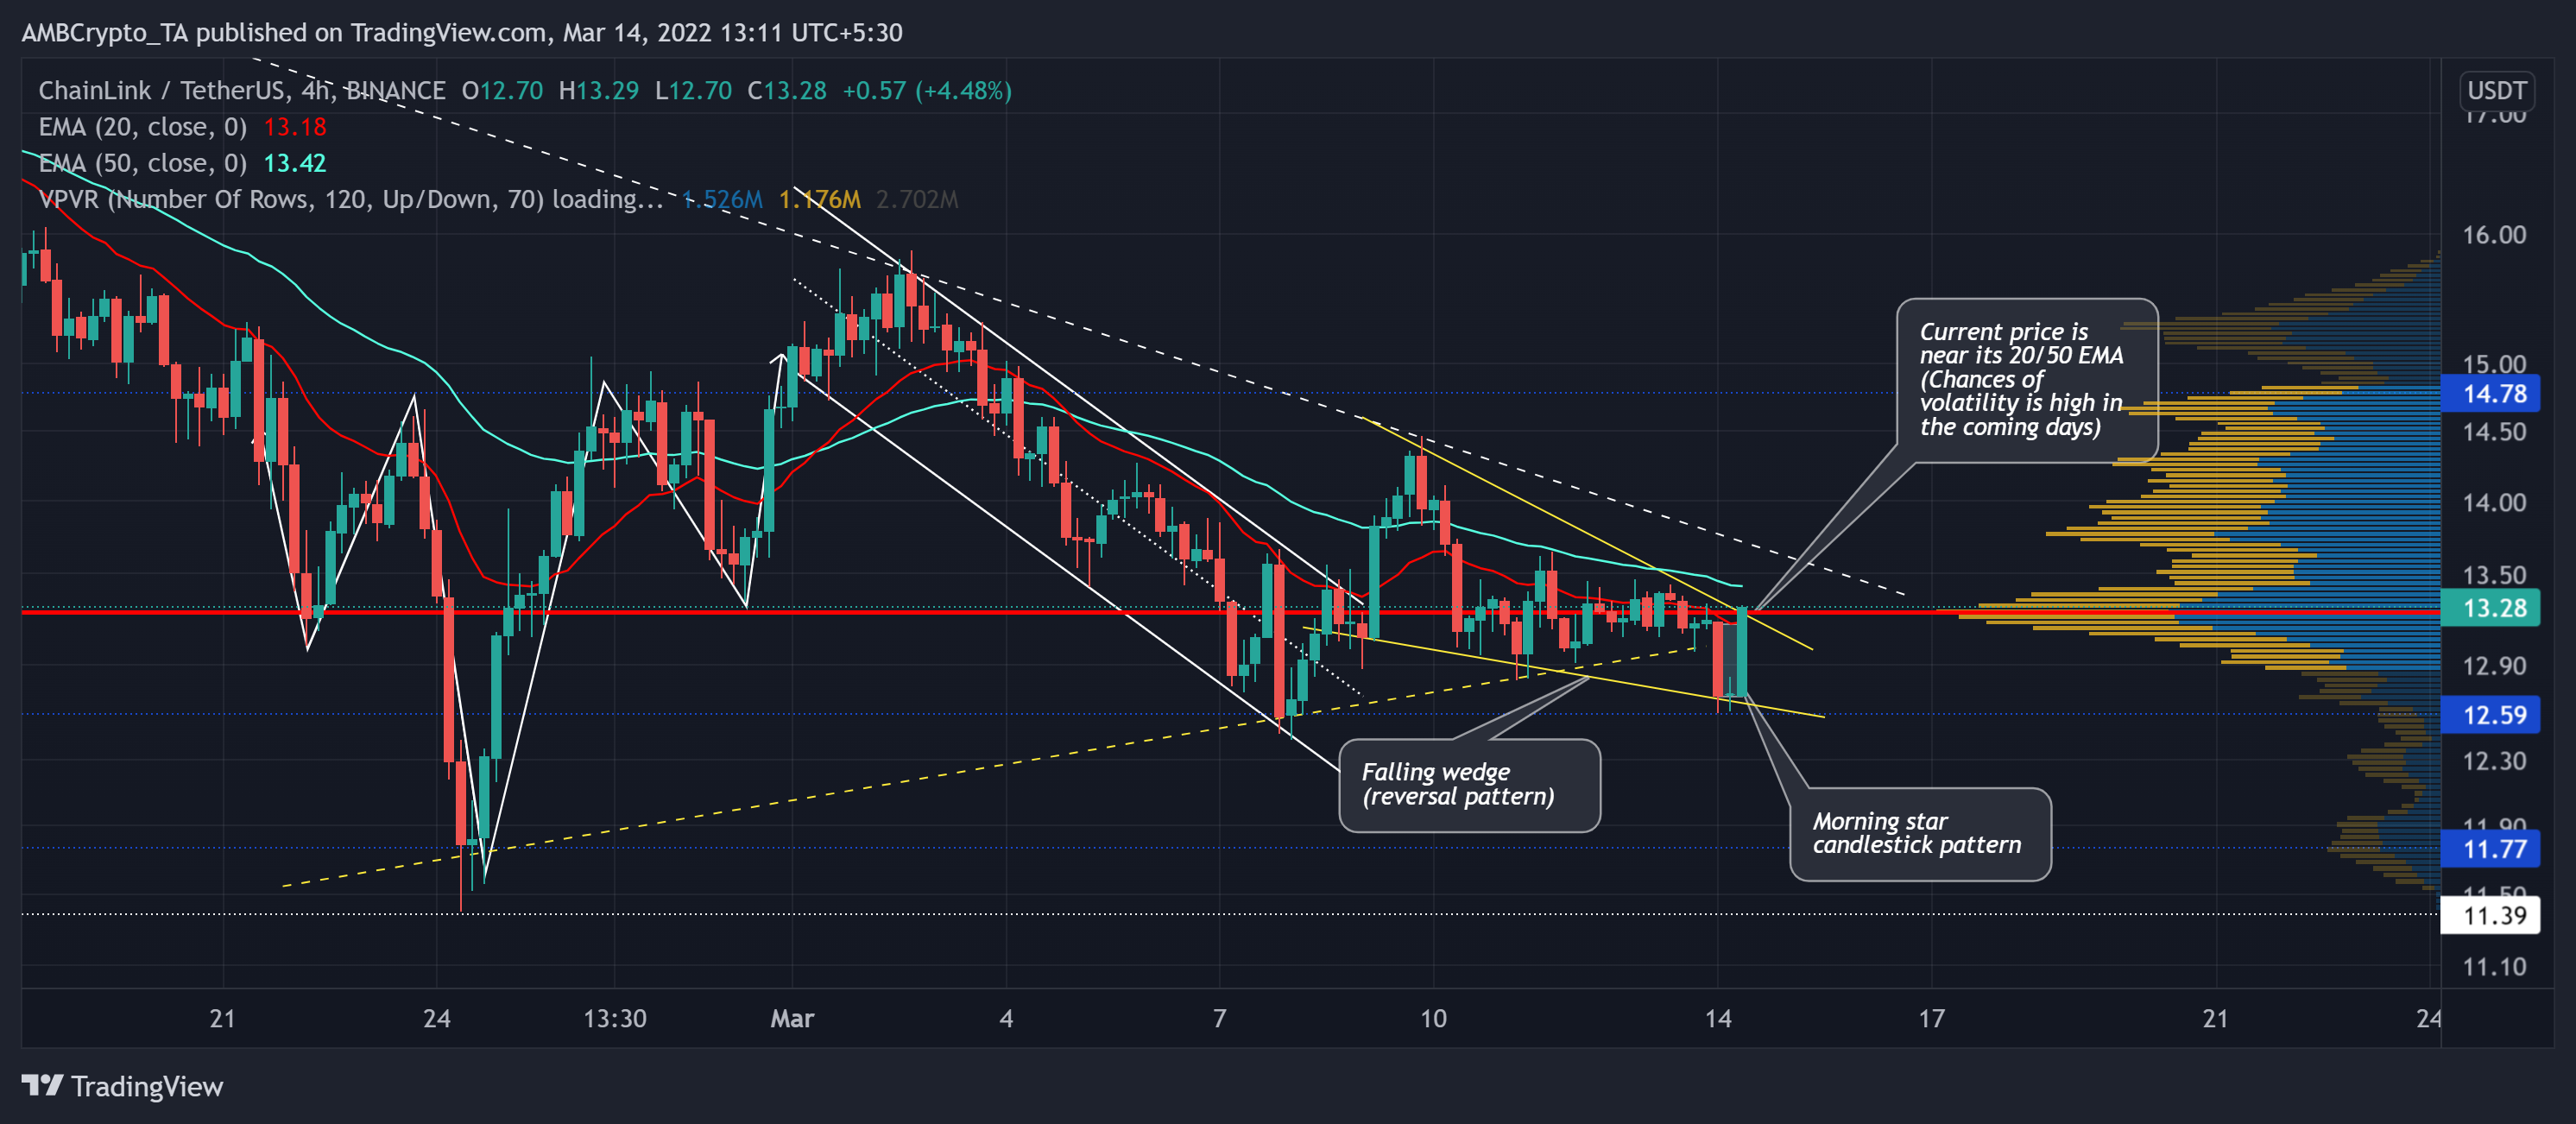
The most recent sell-off (from 11 January) led the alt to lose more than 60% of its value, plunging it towards its 13-month low on 24 February. As the $11.7-level support has historically (for over a year) served as a strong buying zone, LINK reversed to form an inverse head and shoulder.
But this recovery was shunned by its trendline resistance while LINK kept entering a tight phase. Over the last few days, the down-channel (white) reversed into a falling wedge (yellow). Furthermore, the alt saw a morning star (bullish) candlestick pattern.
From here on, any close above the wedge or the POC would position LINK for a test of its trendline resistance. If the buyers can gather enough thrust (on high volumes), the chances of a further recovery before a pullback would exist. But if the bears are adamant about protecting this liquidity range, then the alt would continue its tight phase between the wedge before a probable breakout.
Rationale

The RSI and the price action were in harmony for the most part. Thanks to recent bullish pressure, the RSI managed to poke above the midline and affirmed a decreasing selling vigor.
Also, the OBV depicted a bullish preference while observing an ascending triangle breakout. This trajectory could open up the recovery gates towards the upper trendline resistance. To top it up, the DMI lines were on the verge of a bullish crossover, but the ADX flashed a very fragile directional trend.
Conclusion
With the buying pressure building up on its OBV and RSI along with the bullish candlestick pattern, the chances of breaking above its POC were high.
Nevertheless, an overall market sentiment analysis becomes vital to complement the technical factors to make a profitable move.