Chainlink, Neo, Enjin Price Analysis: 29 January

Chainlink recovered from the bearish divergence it exhibited a few days ago and rose back above a zone that was one of supply a week ago. Neo struggled to replicate this feat even though it had strong buyer interest behind it. Finally, Enjin retraced some gains from the past month.
Chainlink [LINK]
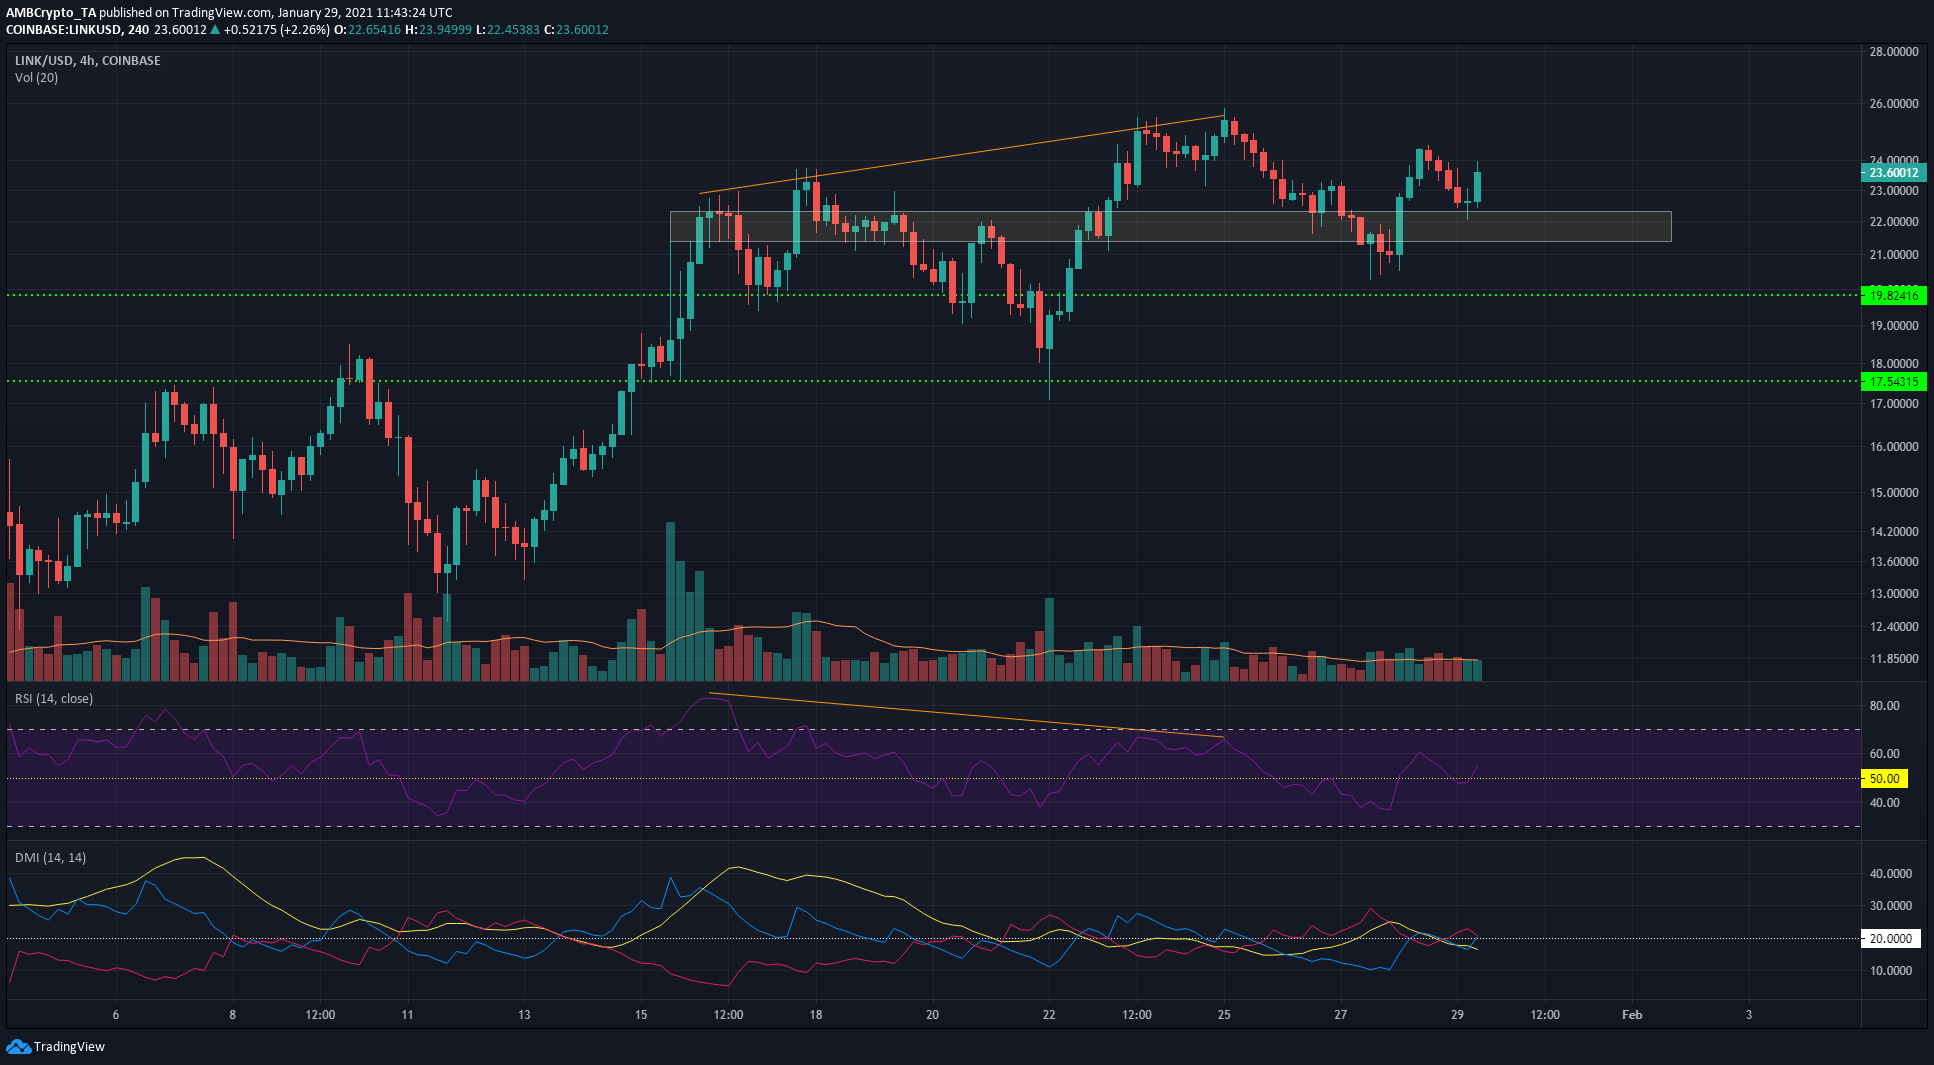
LINK registered a bearish divergence (orange) and dropped to $20.3 a few days ago, before recovering. At the time of writing, it was trading at $23.69. The region from $21.4 to $22.3 could offer some support should sellers step in with force.
The RSI picked up and registered a value of 55, a figure not indicative of another move north for LINK. The Directional Movement Index noted the absence of a strong trend for LINK.
The past few days do not illuminate a definite direction for LINK. Since the trading volume has been low over the past four days, LINK is likely in a phase of consolidation. A move above $25.4 would signal bullish strength.
Neo [NEO]
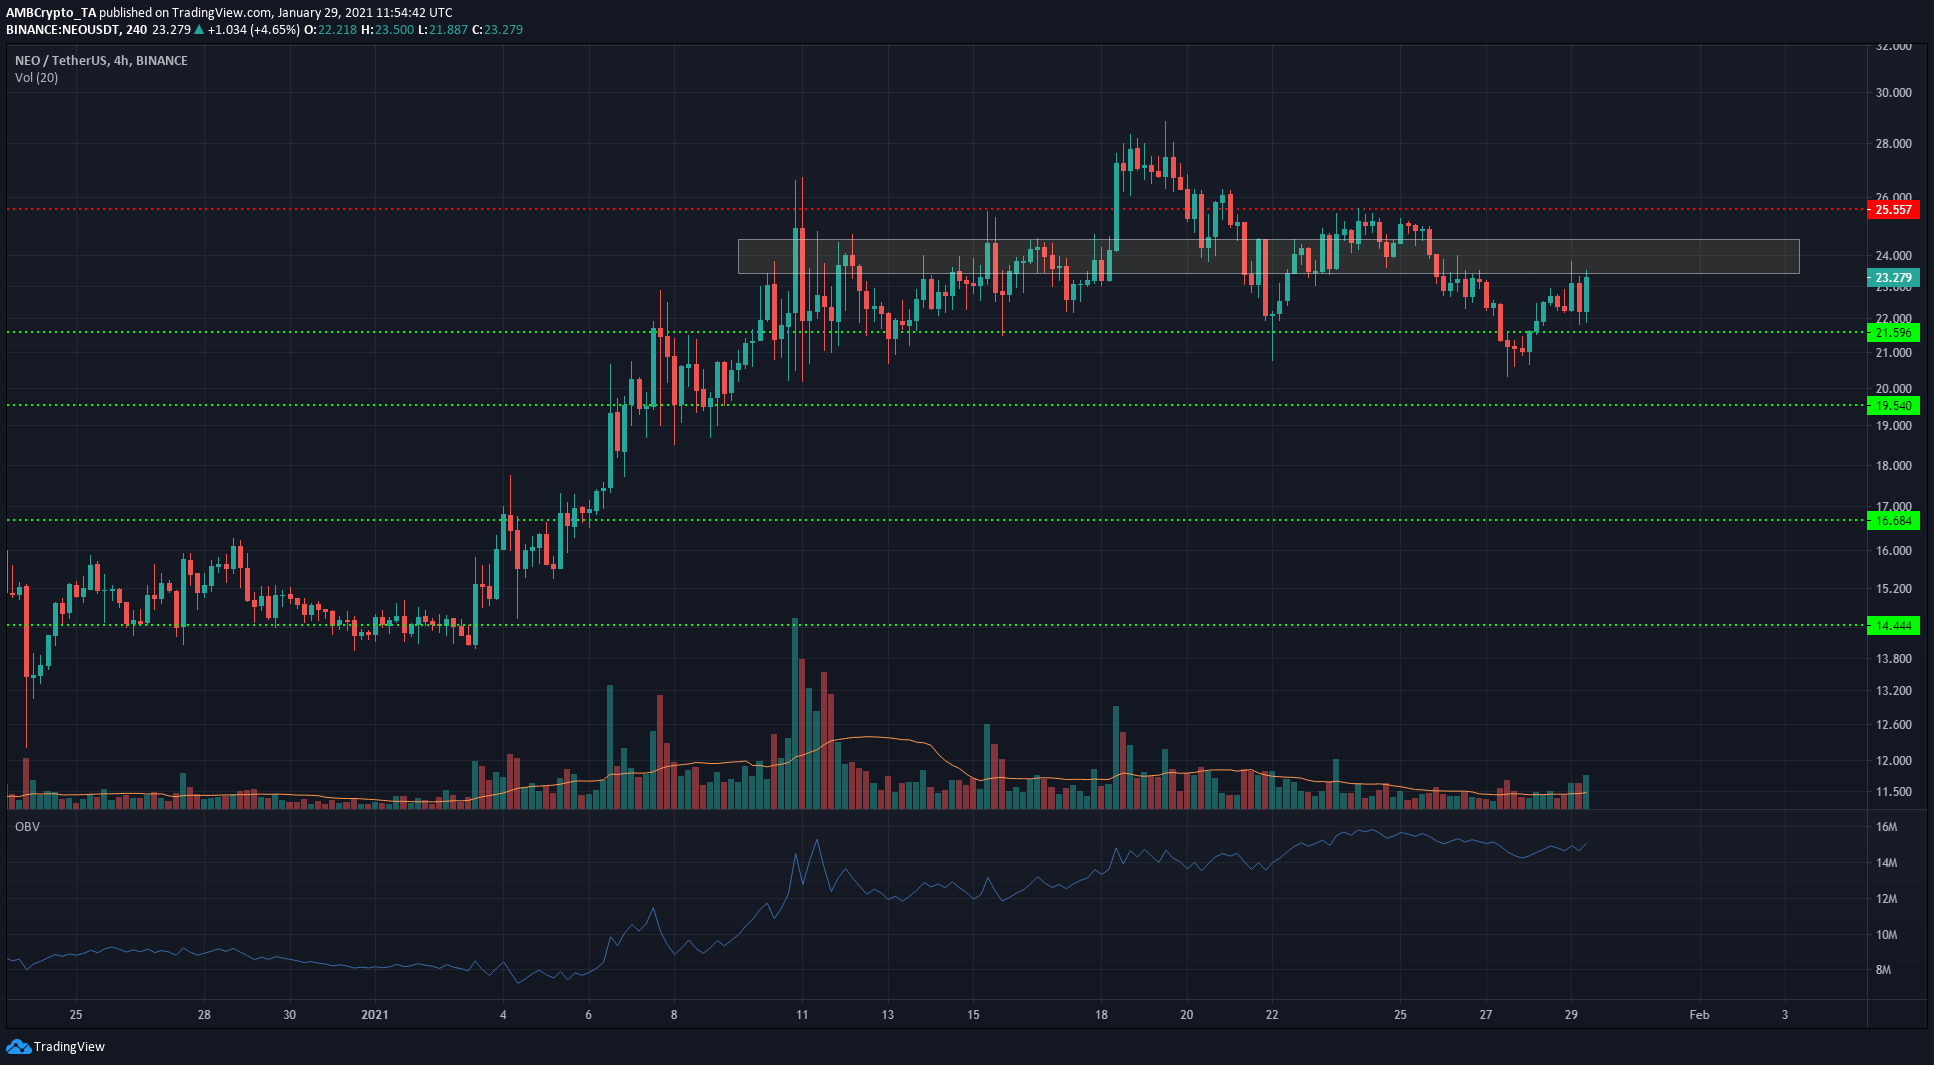
NEO’s market showed rising interest from buyers as the volume of the digital asset bought steadily climbed, according to the OBV. This sign of demand for NEO highlighted that the short-term selling pressure over the past week would likely reverse.
The $23.4-$24.55 zone has been a region of supply over the past three weeks. It was briefly flipped, but the selling intensity over the past ten days pushed the price from $28 back towards $21.5.
Climbing back above this area would see the $25.5-level pose some resistance to further gains. In the short-term, a defense of the $21.5-level will be crucial for recovery.
Enjin [ENJ]
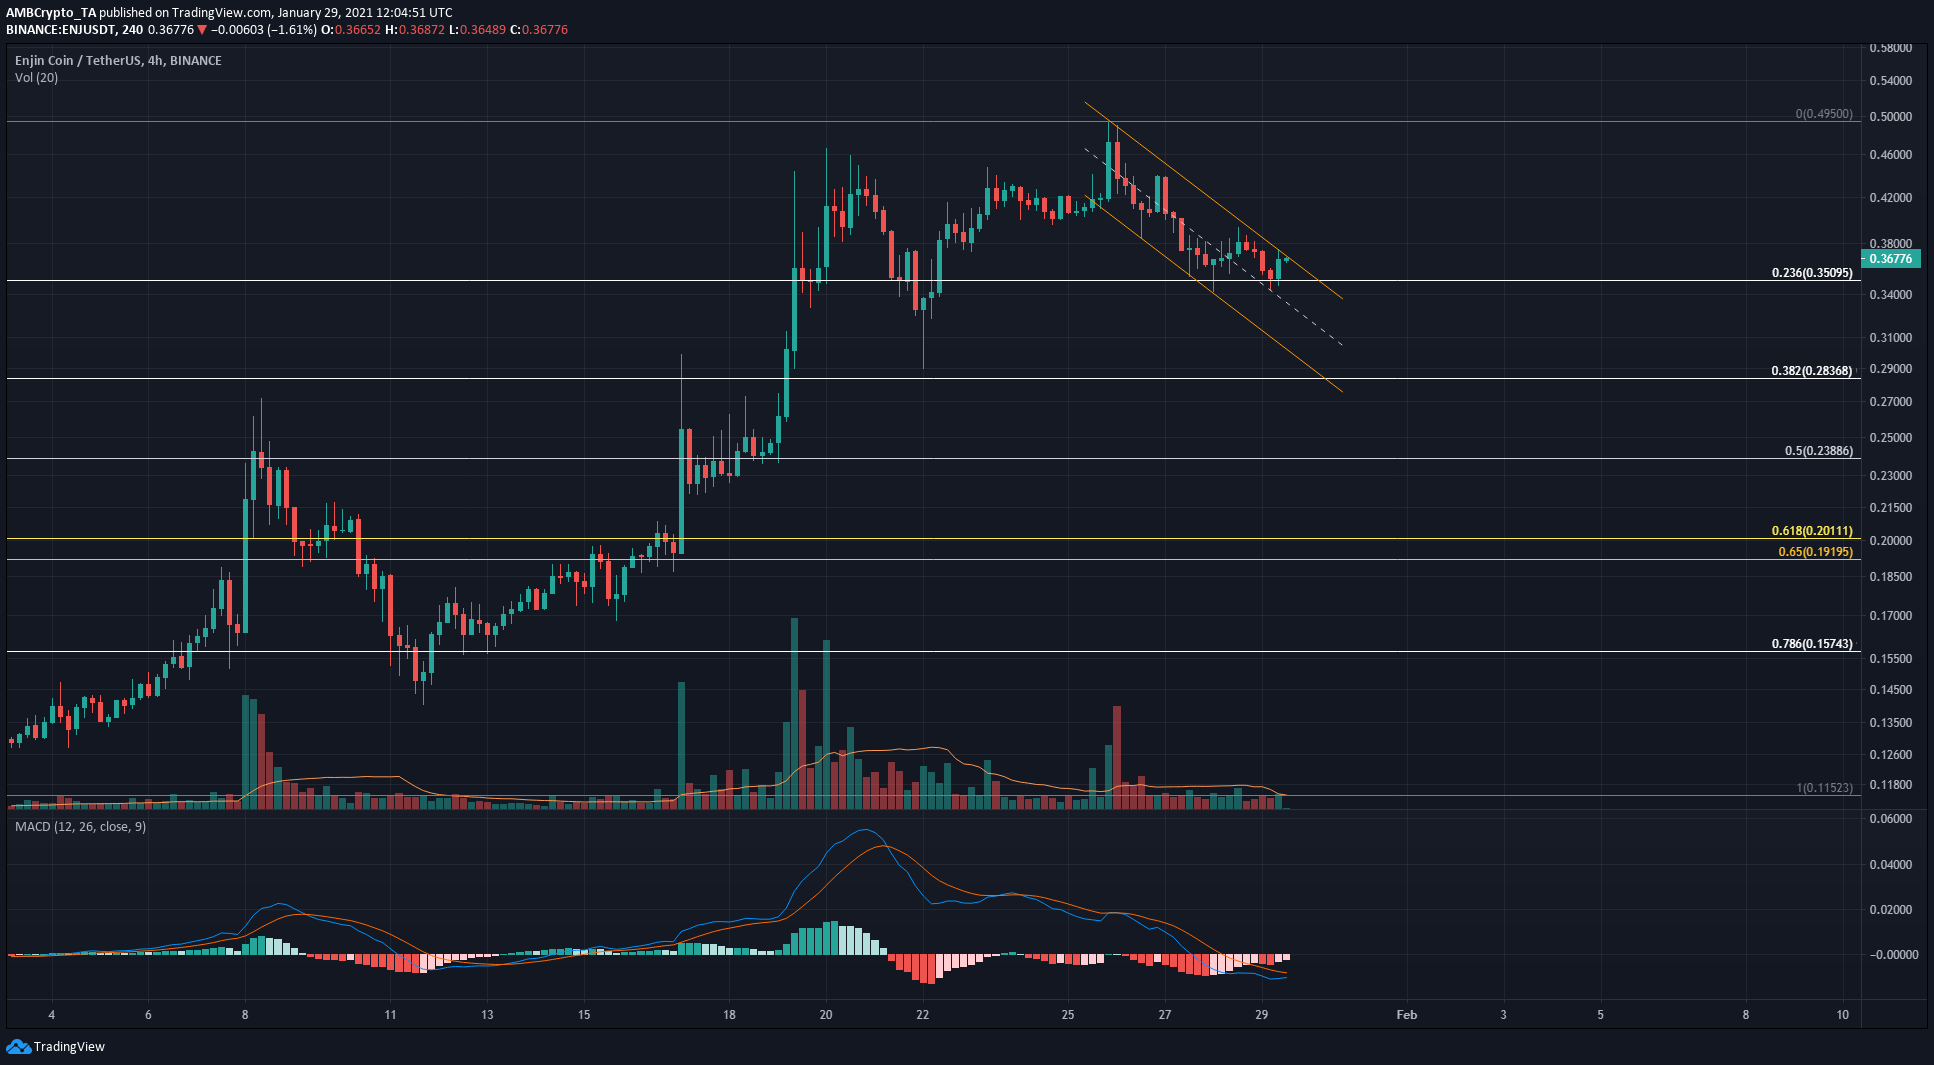
ENJ was trading within a descending channel. Using the Fibonacci Retracement tool for ENJ’s surge from $0.115 to $0.495, some levels of retracement were highlighted as support.
ENJ breaking under the 23.6% level would see ENJ continue to fall. The MACD pointed to this scenario as it was under zero and registered a strong sell signal on the 4-hour charts.
A breakout of the channel could see a bullish reversal that would take ENJ to $0.46, but a shift in momentum could not be seen, at press time.


