Chainlink Price Analysis: 01 February

Disclaimer: The findings of the following analysis are the sole opinions of the writer and should not be taken as investment advice
Chainlink is one of the top-10 coins by market capitalization and has shown a low correlation with Bitcoin. Hence, at times LINK stays stagnant when BTC sees a surge upwards. Conversely, LINK can also show strength when BTC sees selling pressure. This has been exemplified in the past month when Chainlink rose from $17 to touch $25 even as Bitcoin fell from $41,000 to test $30,000.
Chainlink 12-hour chart
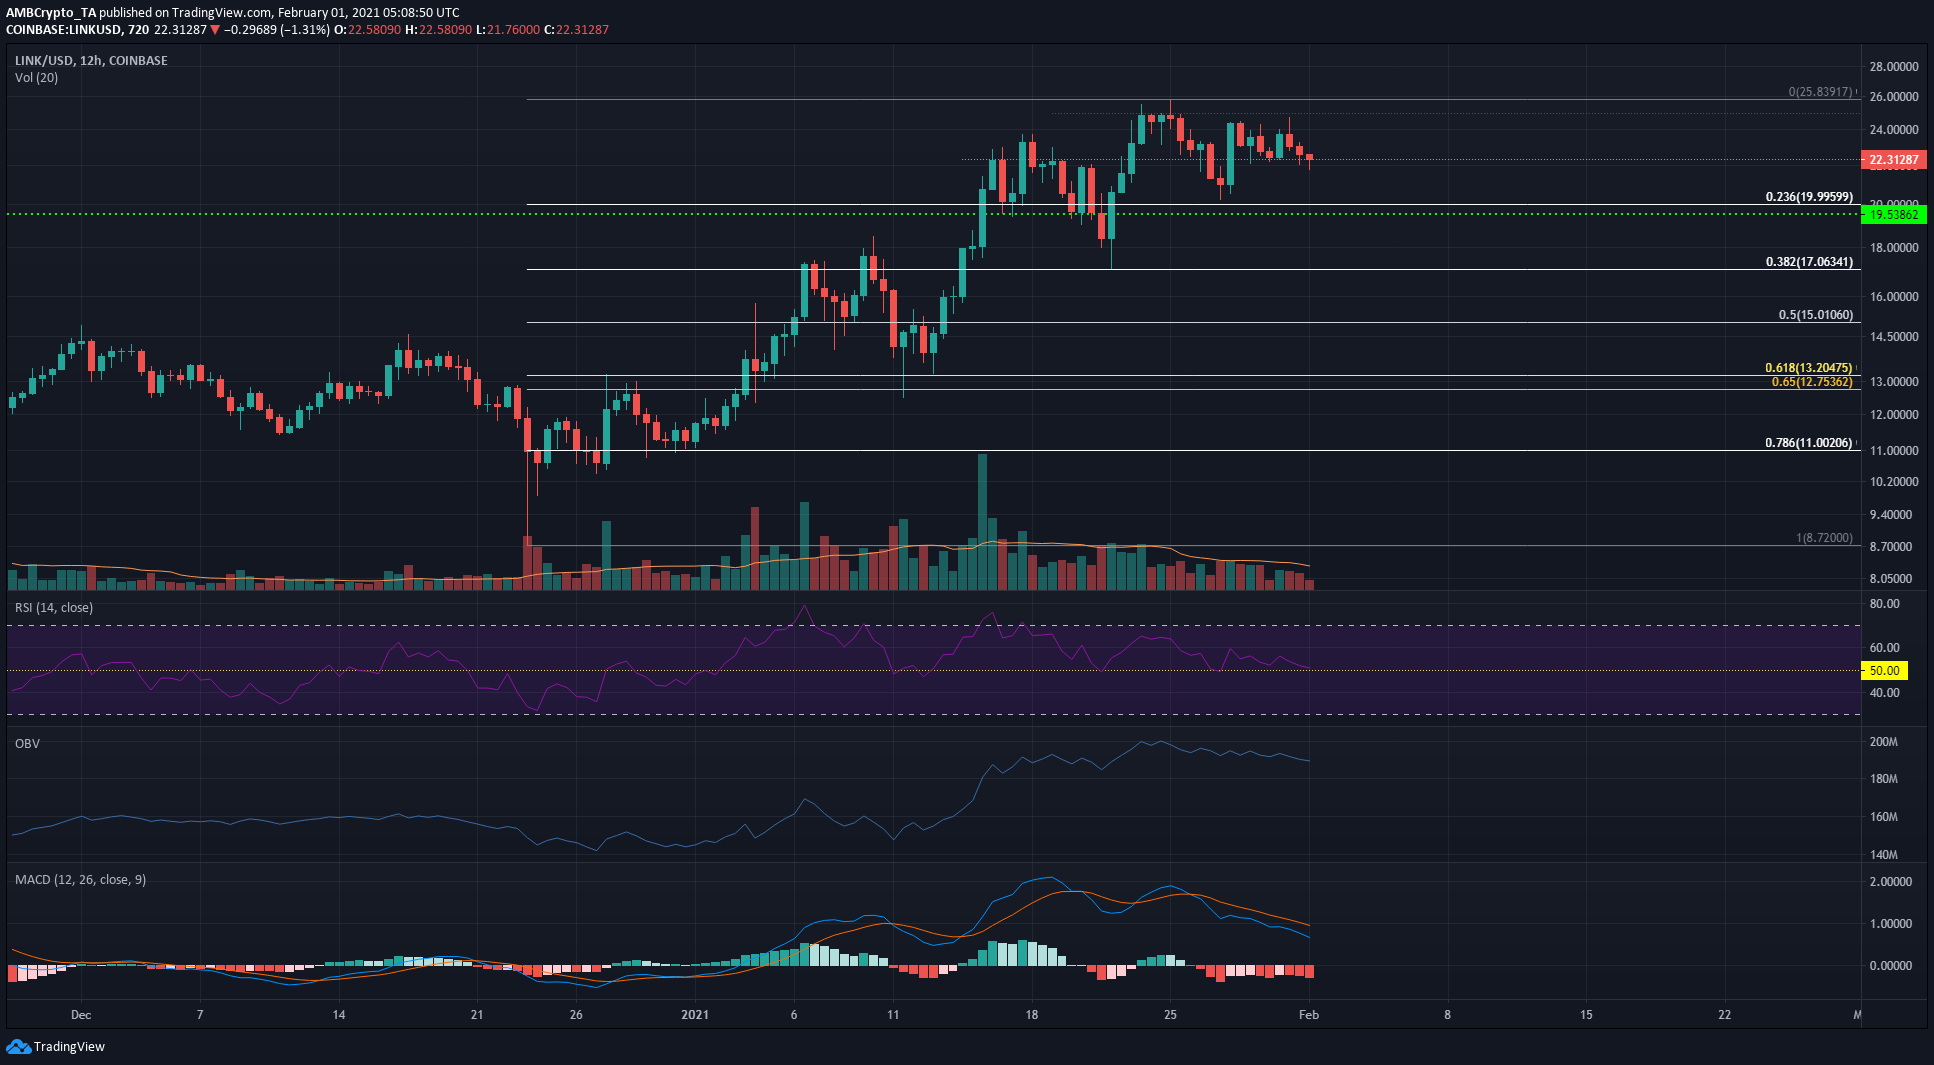
Over the past 45 days, Chainlink arrested a downtrend, after having nearly a week of sideways trading, and then began to mount an impressive comeback as it broke past the previous all-time high at $20 and set a new one at $25.63.
The technical indicators showed some bearish momentum for LINK. The RSI was forming a series of lower highs as it approached the neutral 50 line, and threatened to dip beneath and test it as resistance to indicate a downtrend in the coming days.
The MACD formed a bearish crossover. Even though it was above the zero line, the MACD was moving lower as well.
The OBV showed that some selling volume was seen in the market. While small in comparison to the buying volume that drove the rally, the dominance of the sellers over the past two weeks indicates that LINK might be headed for a retracement.
This would be a healthy outcome in the longer-term, as the market would likely move upwards once more and possibly break the ATH at $25.63 on the next move upwards. However, the next few weeks could see increased bearish pressure.
The $22.3 and the $19.5-$20 regions are the imminent areas of support for LINK. Beyond these, the Fibonacci retracement tool highlighted some important levels of support such as $17. Notable resistance lies at $25.
Conclusion
A pullback in the coming weeks appeared likely. Moving beneath $20 would confirm this outcome. This would be a long-term bullish development for LINK and can result in it breaking past the previous ATH in the coming months.


