Chainlink Price Analysis: 05 April

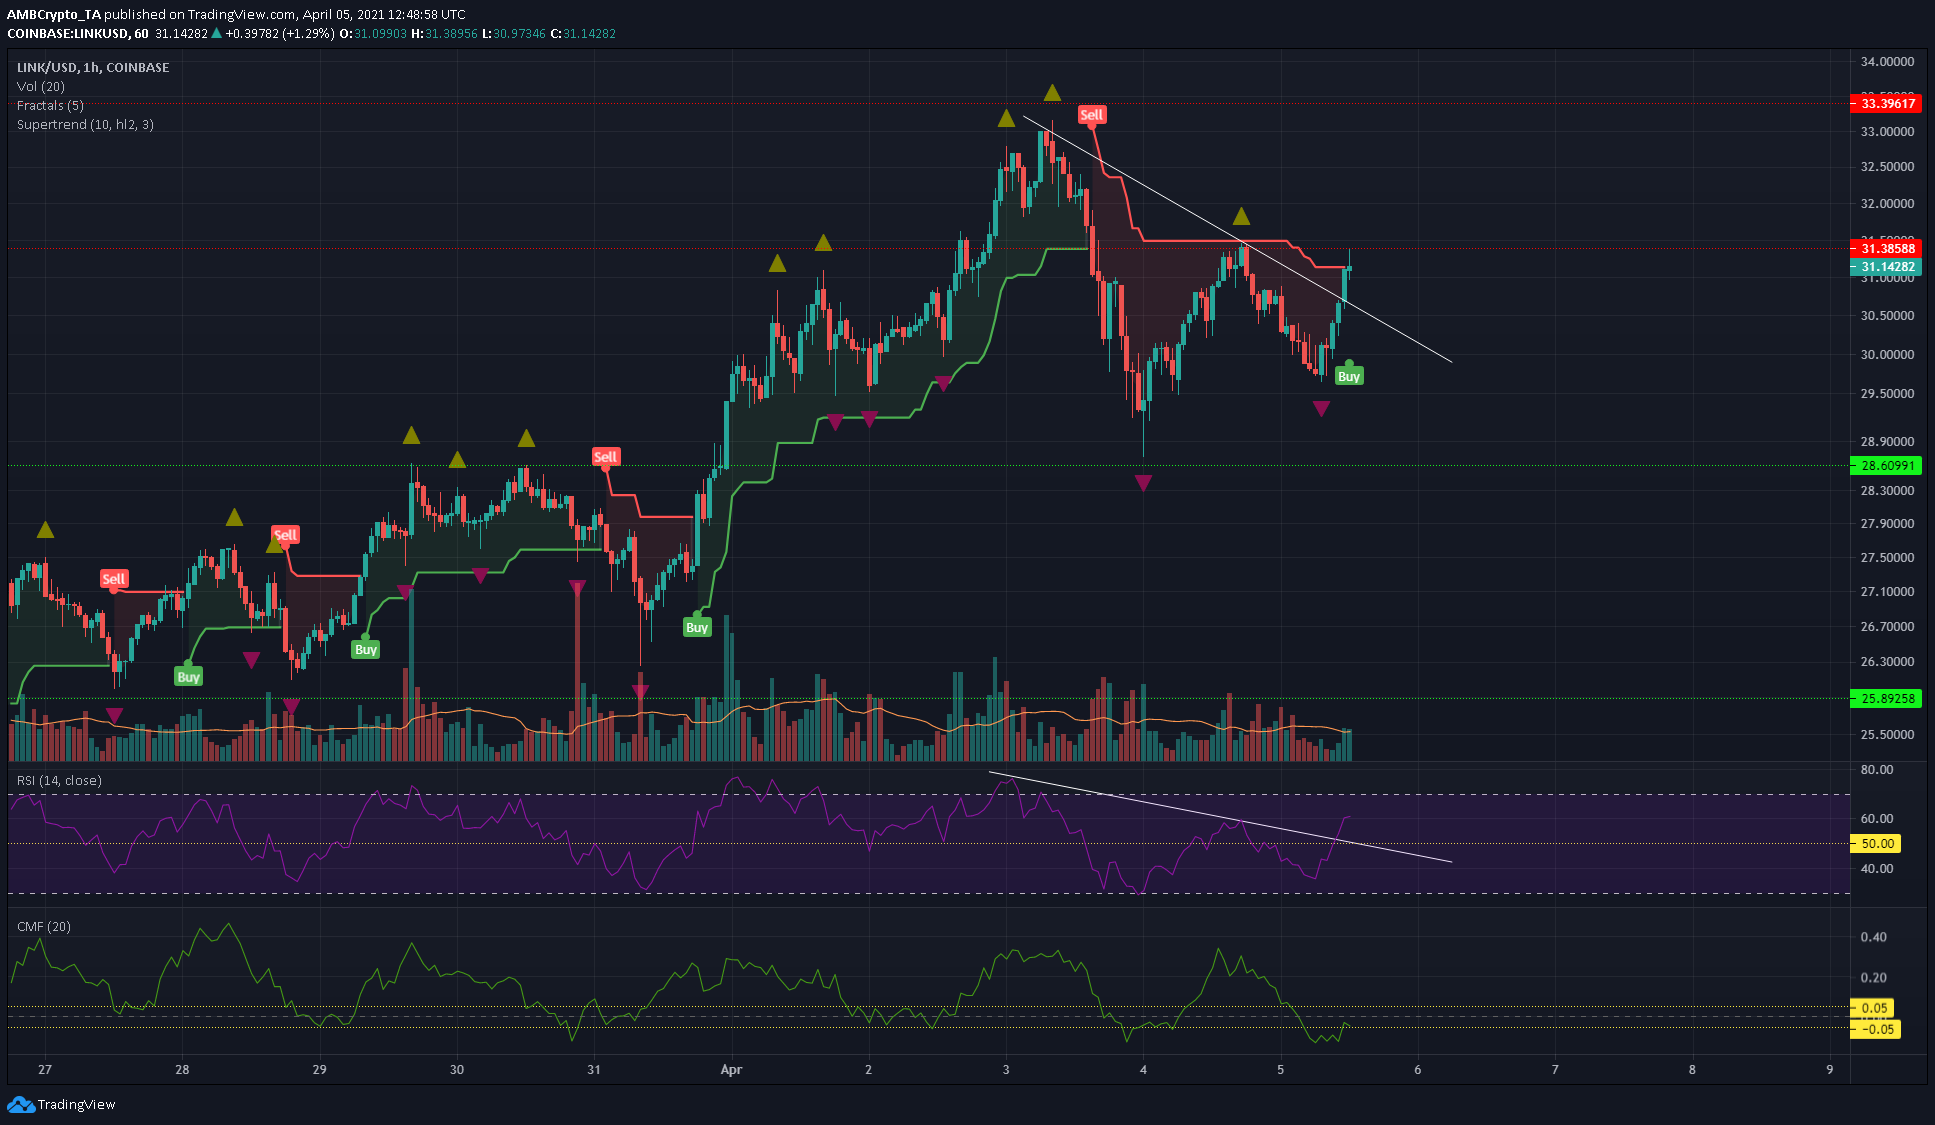
Chainlink had a bullish outlook on the charts as it approached a level of resistance at $31.38 once more. While a dip back to $30.5 could be seen, the short-term momentum has swung strongly in favor of the buyers. Bitcoin and Ethereum have also held their ground above crucial areas of support, making a marketwide drop less likely. Funding rates for perpetual futures trades showed that longs were an overcrowded trade.
Chainlink 1-hour chart

Source: LINK/USD on TradingView
On the 1-hour chart, the descending trendline (white) of the past few days has been broken. It could be retested in the coming hours, hence scaling into long positions at $31 and $30.5 on a retest can be profitable.
The past week has seen LINK break past the $28.6 resistance level. There was a strong drop from $33 to $28.7, however, LINK continued to register a series of higher lows over the past two weeks. It had rounded a corner at $24.6, and the uptrend since has been unbroken yet.
The next move for LINK would be an attempt to climb back to the $33 local highs, and a breakout past it to test the $35 region of supply in the coming days.
Reasoning
The white trendline on the price chart replicated on the RSI indicator showed the RSI breaking out past the trendline as well. This confirms the bullish momentum behind LINK, and no divergences were yet seen.
The RSI could head back to neutral 50 if LINK dips to retest the $30.5 area, but only a trading session close beneath $29.5 would indicate bears were ascendant once more.
The Chaikin Money Flow climbed back into the neutral territory between -0.05 and +0.05, showing capital flow into and out of the market was balanced, meaning that neither sellers nor buyers held sway in the market.
The price closed a session above $31.15, and this caused the Supertrend indicator to flip from a sell to a buy signal. The Supertrend indicator recommended a stop-loss of $29.9 as well, and a drop beneath this level would flip the indicator once more.
Conclusion
The move past $28.6 is hugely significant for LINK in the weeks to come, and the uptrend of the past two weeks has been unbroken. Laddered buys at $31 and $30.5, with a stop-loss in the $29.9-$29.5 are viable, according to analysis.


