Cardano, Tezos, Hedera Hashgraph Price Analysis: 05 April

Cardano was in danger of slipping below $1.16-support, but this was well in line with short-term expectations. Tezos approached the upper barrier of $5.4 once again but was not projected to sustain a breakout. Lastly, Hedera Hashgraph could see rangebound movement if the current support mark is maintained.
Cardano [ADA]
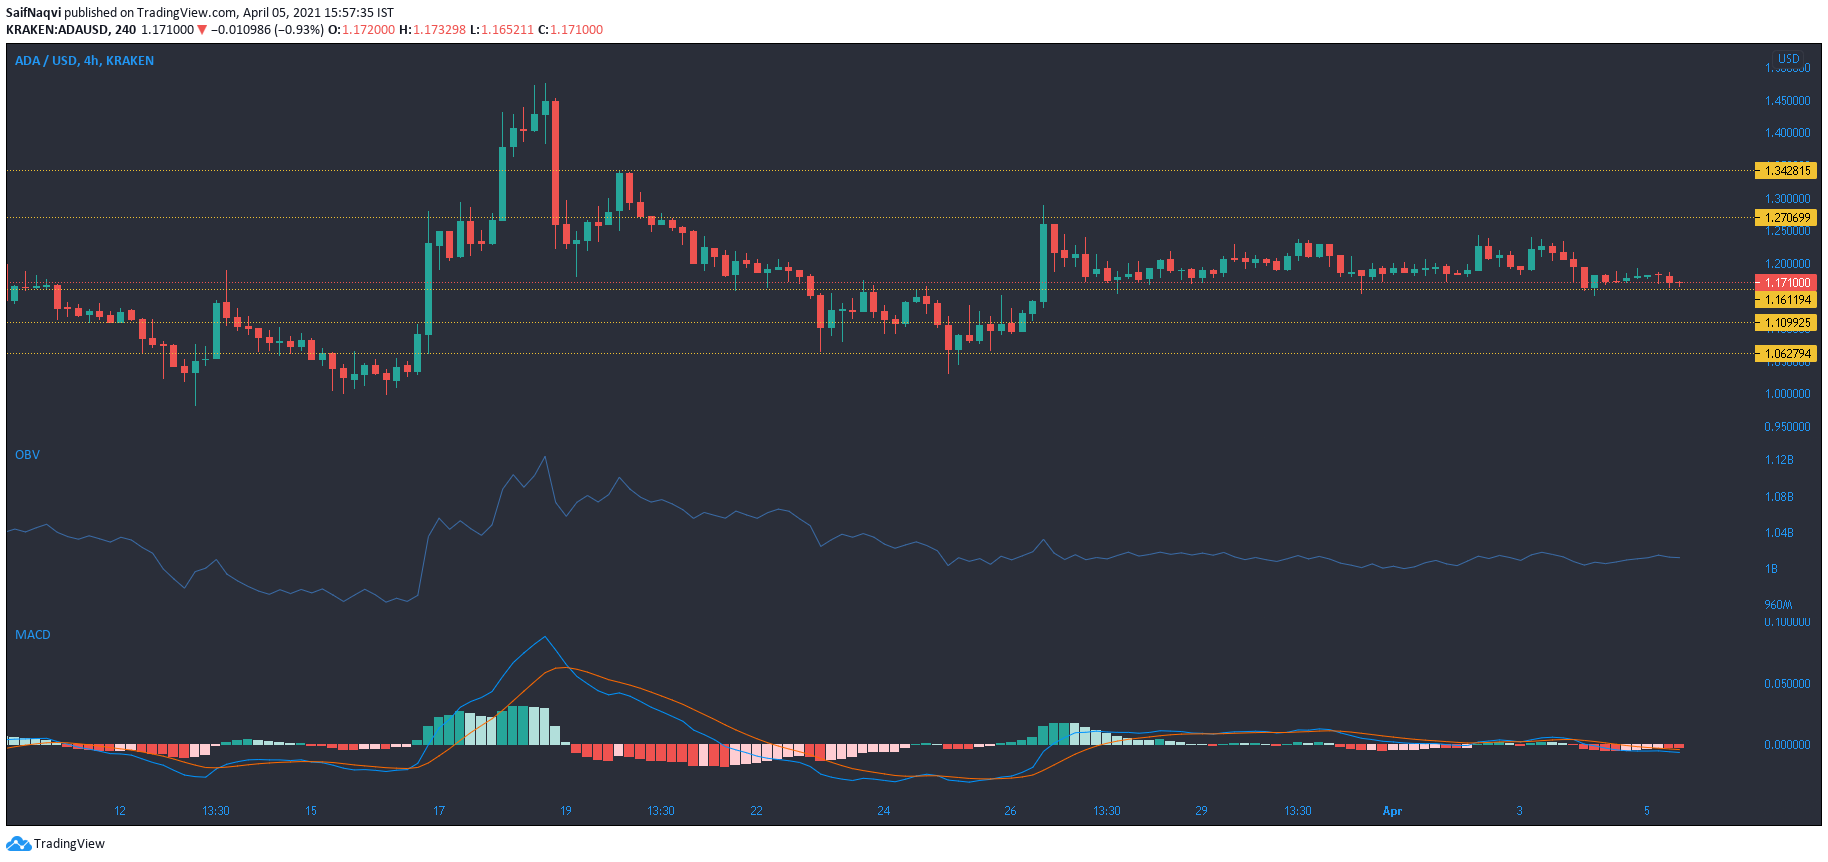
There were few developments in the Cardano market over the last 24 hours, although the price did test the bottom support line of $1.16. A dip below this level was in line with expectations, and the areas at $1.1 and $1.06 can be used to open long trades. The OBV was well below levels seen during March 18 as buying pressure remained subdued at the current price point.
The MACD was in bearish territory below the half-line and indicated additional short-term losses. Considering the above factors, the market was not yet ready to climb above the $1.34 price ceiling.
Tezos [XTZ]
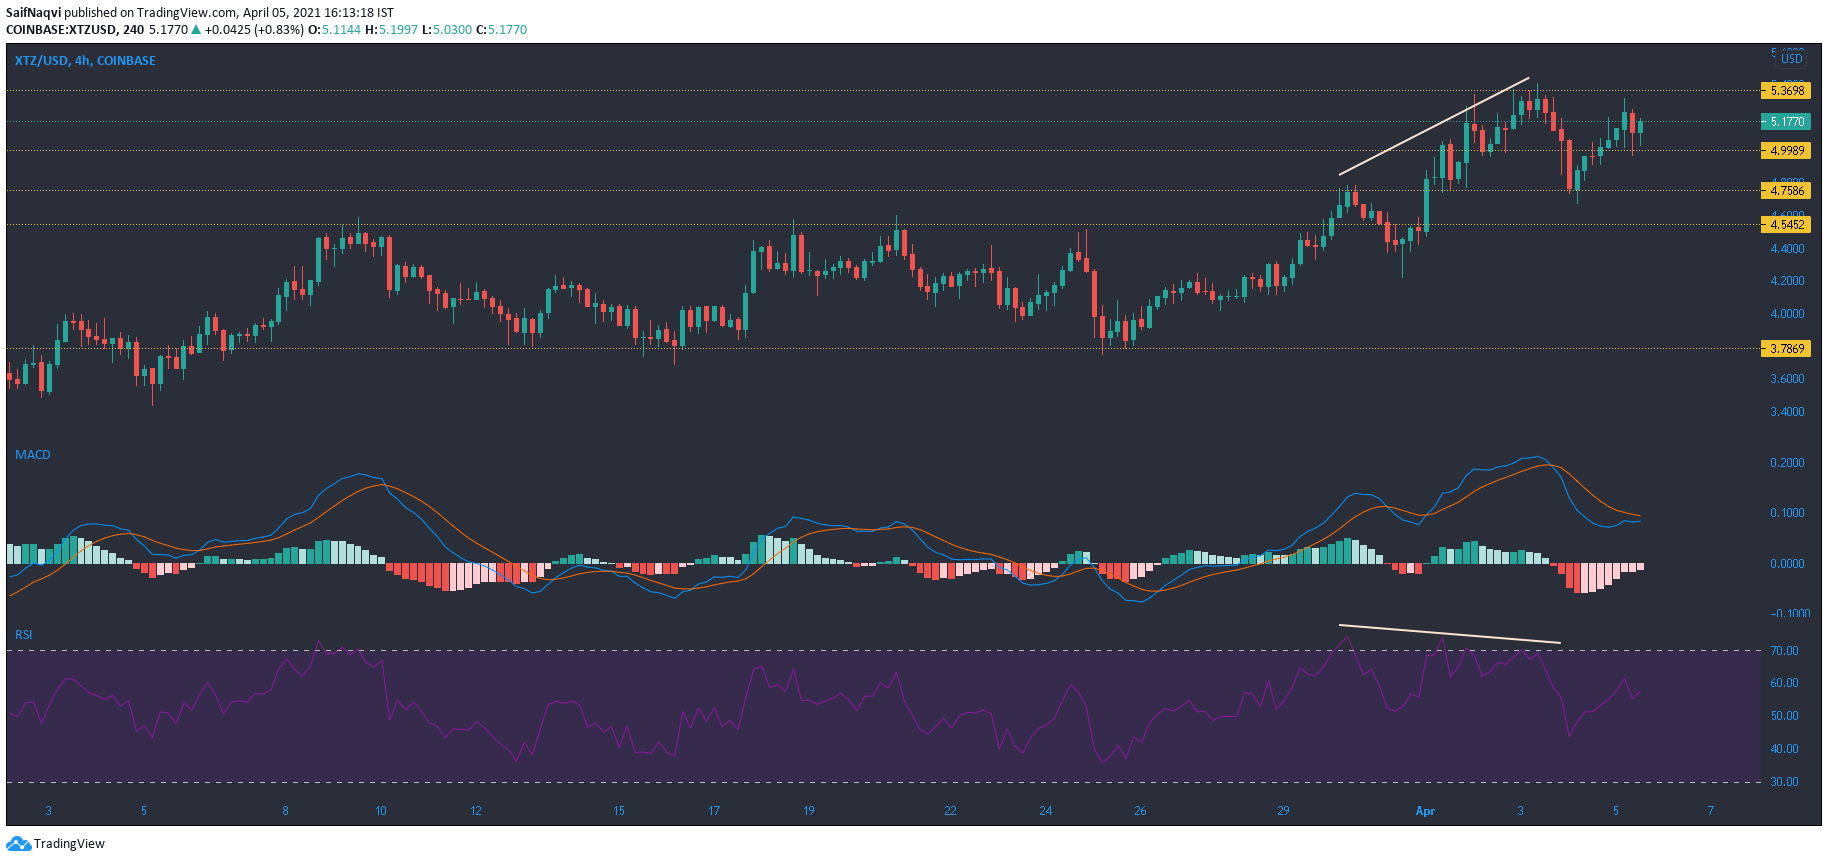
A recovery in the Tezos market was successfully complete after it touched the ceiling at $5.4 – a level seen prior to the late-February pullback. The next advancement for the bulls was above this upper ceiling and at the $6-mark.
Even though XTZ moved south after a bearish divergence on the RSI, the bulls held on to $4.7-support. The MACD even closed in on a bullish crossover as the price approached the upper limit once again at the time of writing. However, the trading volumes were on the lower side and a breakout might not be sustained even if it does occur over the coming sessions. In case of a downturn, the price could move towards a strong region of support at $4.5, which can be used to initiate some long trades as well.
Hedera Hashgraph [HBAR]
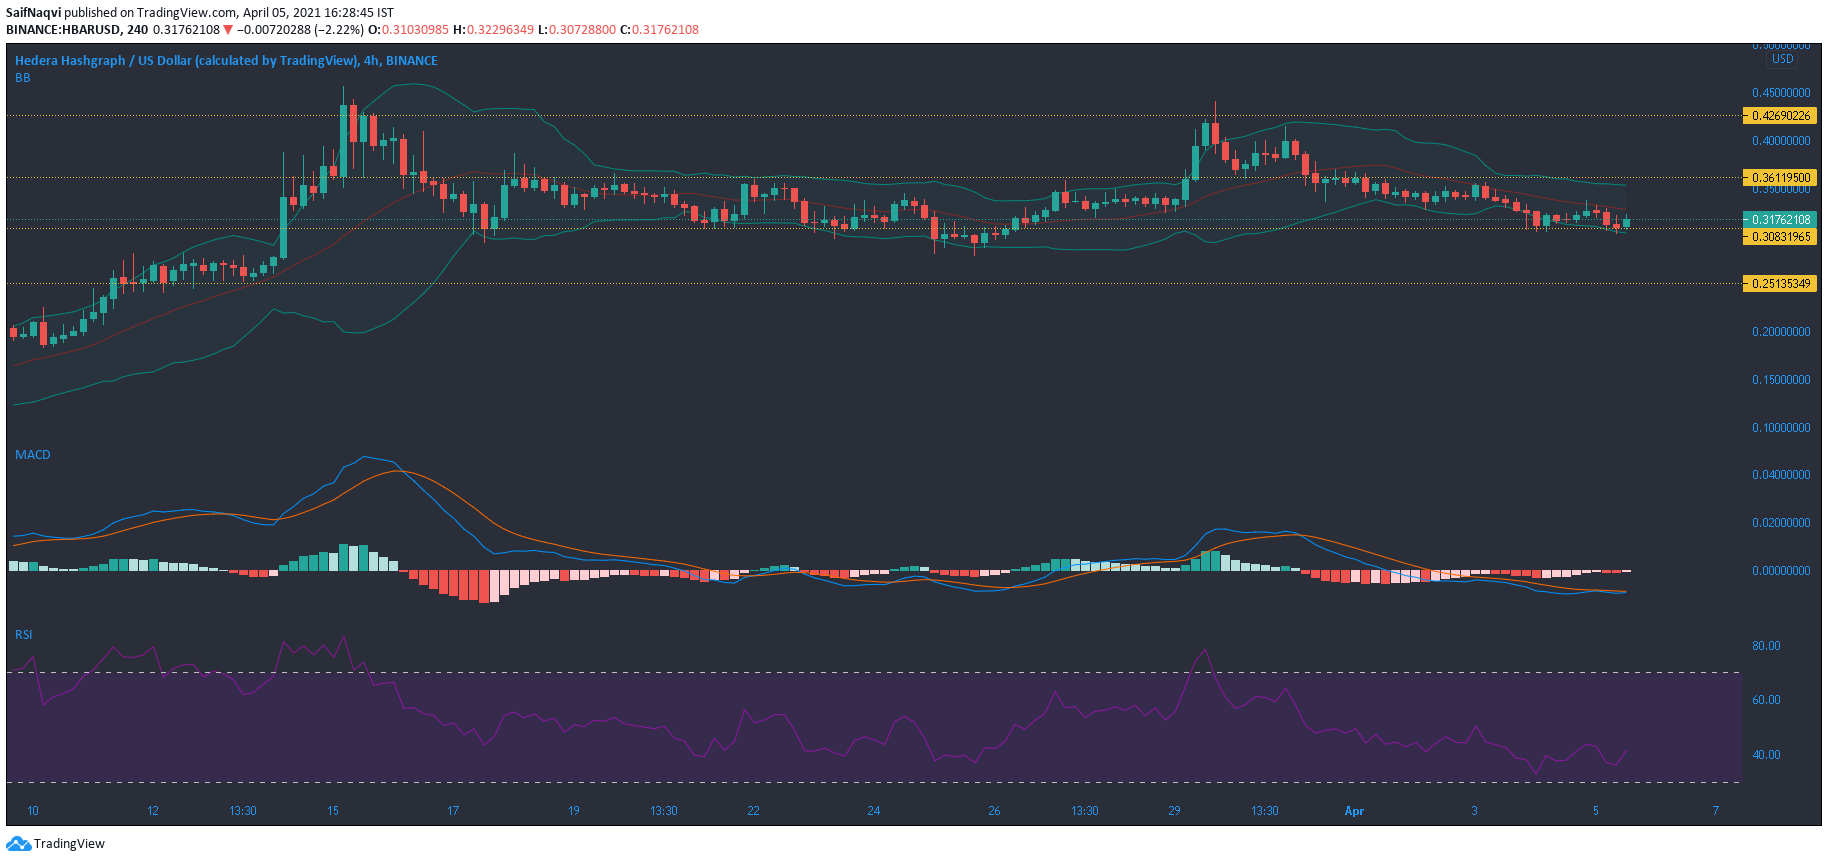
Hedera Hashgraph continued its southbound movement after getting rejected at $0.42-resistance. At press time, the price floated just above a support line at $0.308 and the bulls prevented a breakdown on the 4-hour charts. Successfully defending this level might lead to more rangebound behavior as the compressed nature of the Bollinger Bands disallowed for large price swings.
The RSI avoided the oversold region and pointed north from 40. Since the trading volumes were not very noticeable, an upwards breakout did not seem likely at least in the short term. In case of a downturn, support levels reside at $0.27 and $0.25.