Chainlink Price Analysis: 18 February

Disclaimer: The findings of the following analysis are the sole opinions of the writer and should not be taken as investment advice
With YTD returns of 176%, there can be no doubt that Chainlink is one of the large-cap coins that has performed extraordinarily over the last few weeks, with forecasts of further highs to come. In fact, while LINK climbed to a local high near $36, it later shed some of its value on the price charts.
Further, while the $32-level of support loomed large once more for LINK, it is likely to hold against the selling of the past few hours.
Chainlink 30-minute chart
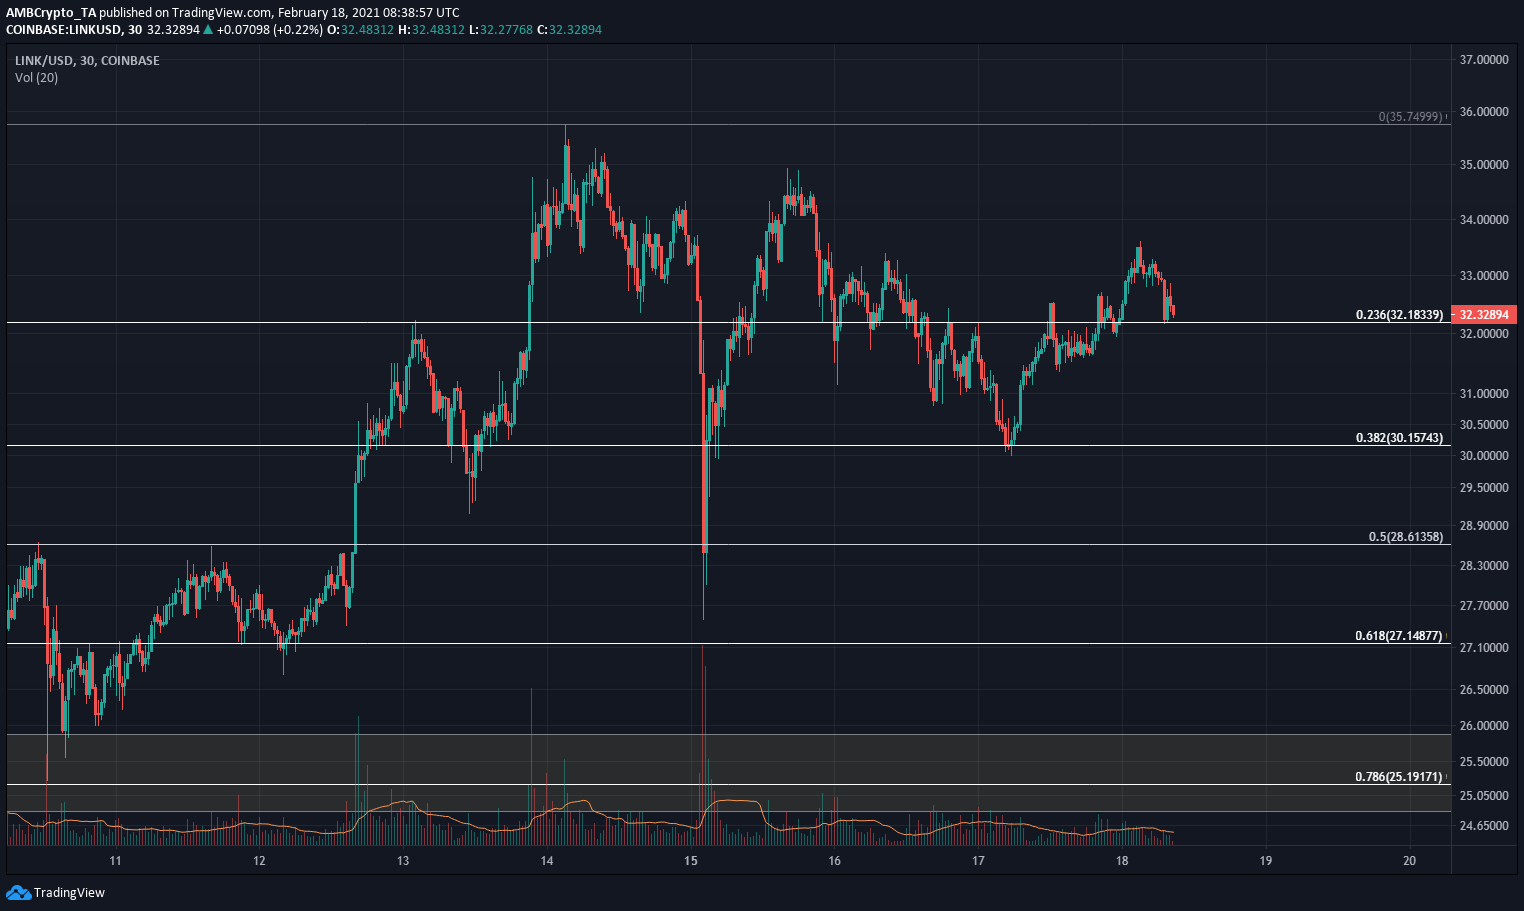
Using the Fibonacci Retracement tool for LINK’s move up from $22.9 to $35.74, some levels of retracement can be highlighted as potential levels of support. Over the past few days, the $32.18-level, which represents the 23.6% retracement level, has acted as both support and resistance on the charts.
At the time of writing, LINK was approaching this level once more to retest it as support.
In the past week, losing this level and retesting it as resistance saw the next retracement level at $30.15 tested as support. LINK has recovered from such a situation, but it is a pattern that could yet repeat itself.
Market Rationale
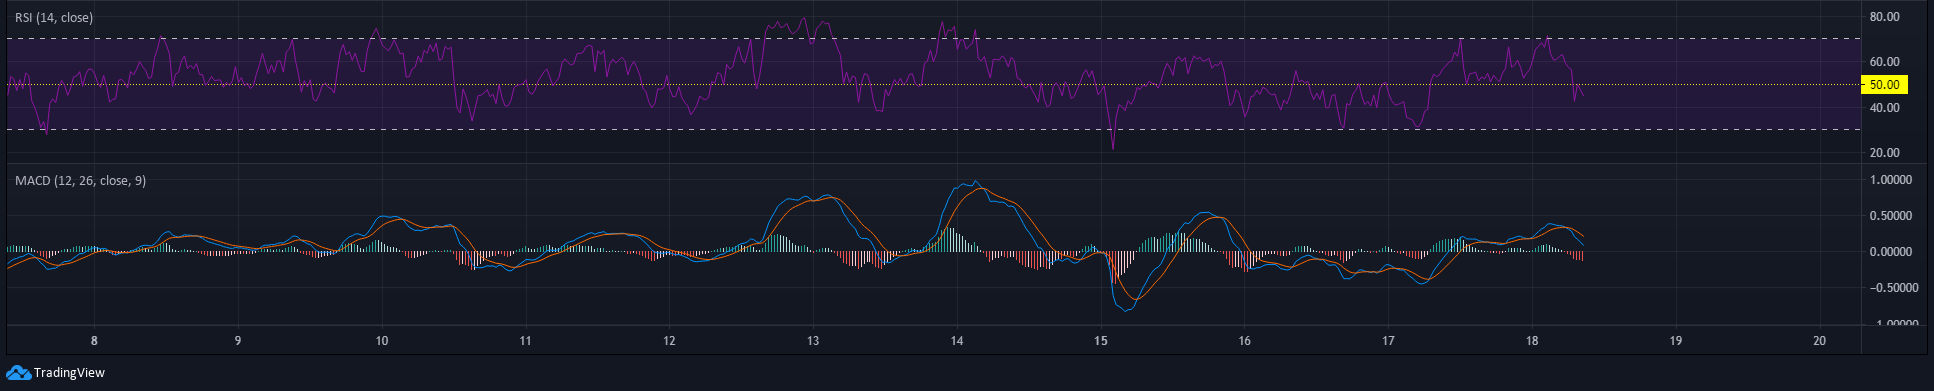
The RSI dipped under 50 and retested it as resistance. The MACD formed a bearish crossover above zero and dove southbound, alongside the RSI.
This suggested that short-term momentum was shifting in favor of the market’s bears. Hence, while the long-term market outlook is bullish, there is potential yet for a small drop back towards $30 for LINK.
On longer timeframes, LINK still seemed to retain some bullish momentum. Hence, the reaction of the price at $32.18 will be crucial in the short-term. A bounce off this level in the coming hours would indicate that a move upward is imminent while losing this level to the bears would see LINK drop to $30.
Conclusion
In the event of a drop, the $30-$30.4 range can be considered as a region of demand. However, a defense of the $32.18-level, which is more likely based on the momentum behind LINK since its recovery from $30, would indicate bullish strength.
LINK’s market bulls would need to drive the price higher than the previous high at $33.6 to break the short-term pullback that Chainlink has been on since the 14th. Such a move backed by significant trading volume would likely see LINK head back towards the highs of $36.


