Chainlink surges 15% in a week as BTC, ETH lag behind
While Bitcoin and Ethereum remain in a tight range, Chainlink bucks the trend to climb by 15% in the last week.
- LINK ranks as the crypto asset with the most gains in the last week.
- This was due to an uptick in network activity within that period.
Chainlink [LINK] has outperformed the rest of the cryptocurrency market in the past week, with its price surging by 15%. In contrast, Bitcoin [BTC] and Ethereum [ETH], the two largest cryptocurrencies by market capitalization, have remained relatively flat over the same period.
📊 As #Bitcoin remains in its $26K to $27K range, more #altcoins are spiking following whale accumulation and network growth. $LINK has notably climbed to $7.08, and $EXRD surged up to $0.067. Less social volume in #crypto means more and more projects are moving under the radar. pic.twitter.com/CPipEc0fsX
— Santiment (@santimentfeed) September 23, 2023
Read Chainlink’s [LINK] Price Prediction 2023-24
The price uptick has been due to the surge in new demand for the altcoin and an uptick in the daily count of addresses completing trades involving LINK.
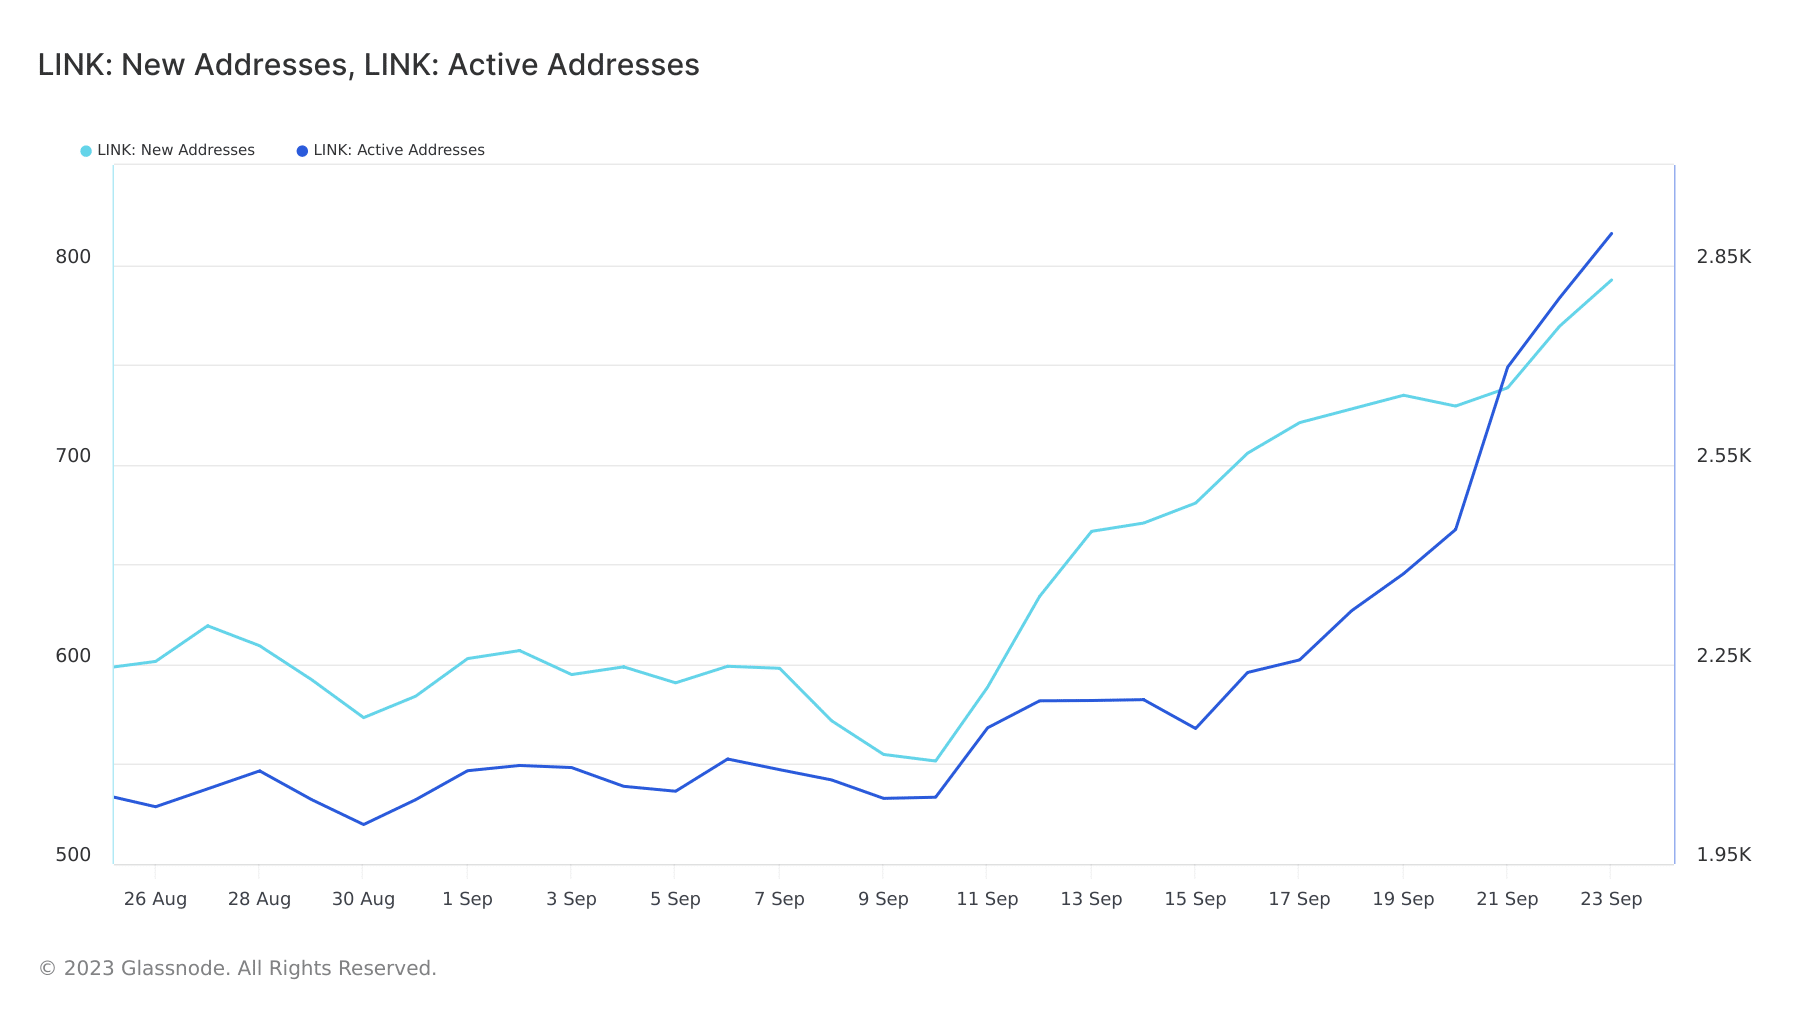
Information retrieved from on-chain data provider Glassnode revealed that the daily counts of new addresses and active addresses trading LINK began to increase on 10 September and remained in an uptrend as of this writing.
As of 23 September, 792 new addresses were created to trade LINK. This represented a 44% jump from the 551 new addresses created on 10 September.
Regarding the daily count of unique addresses that have been active on the Chainlink network either as a sender or receiver, it has also rallied by 41% in the past two weeks.
No holds barred for LINK
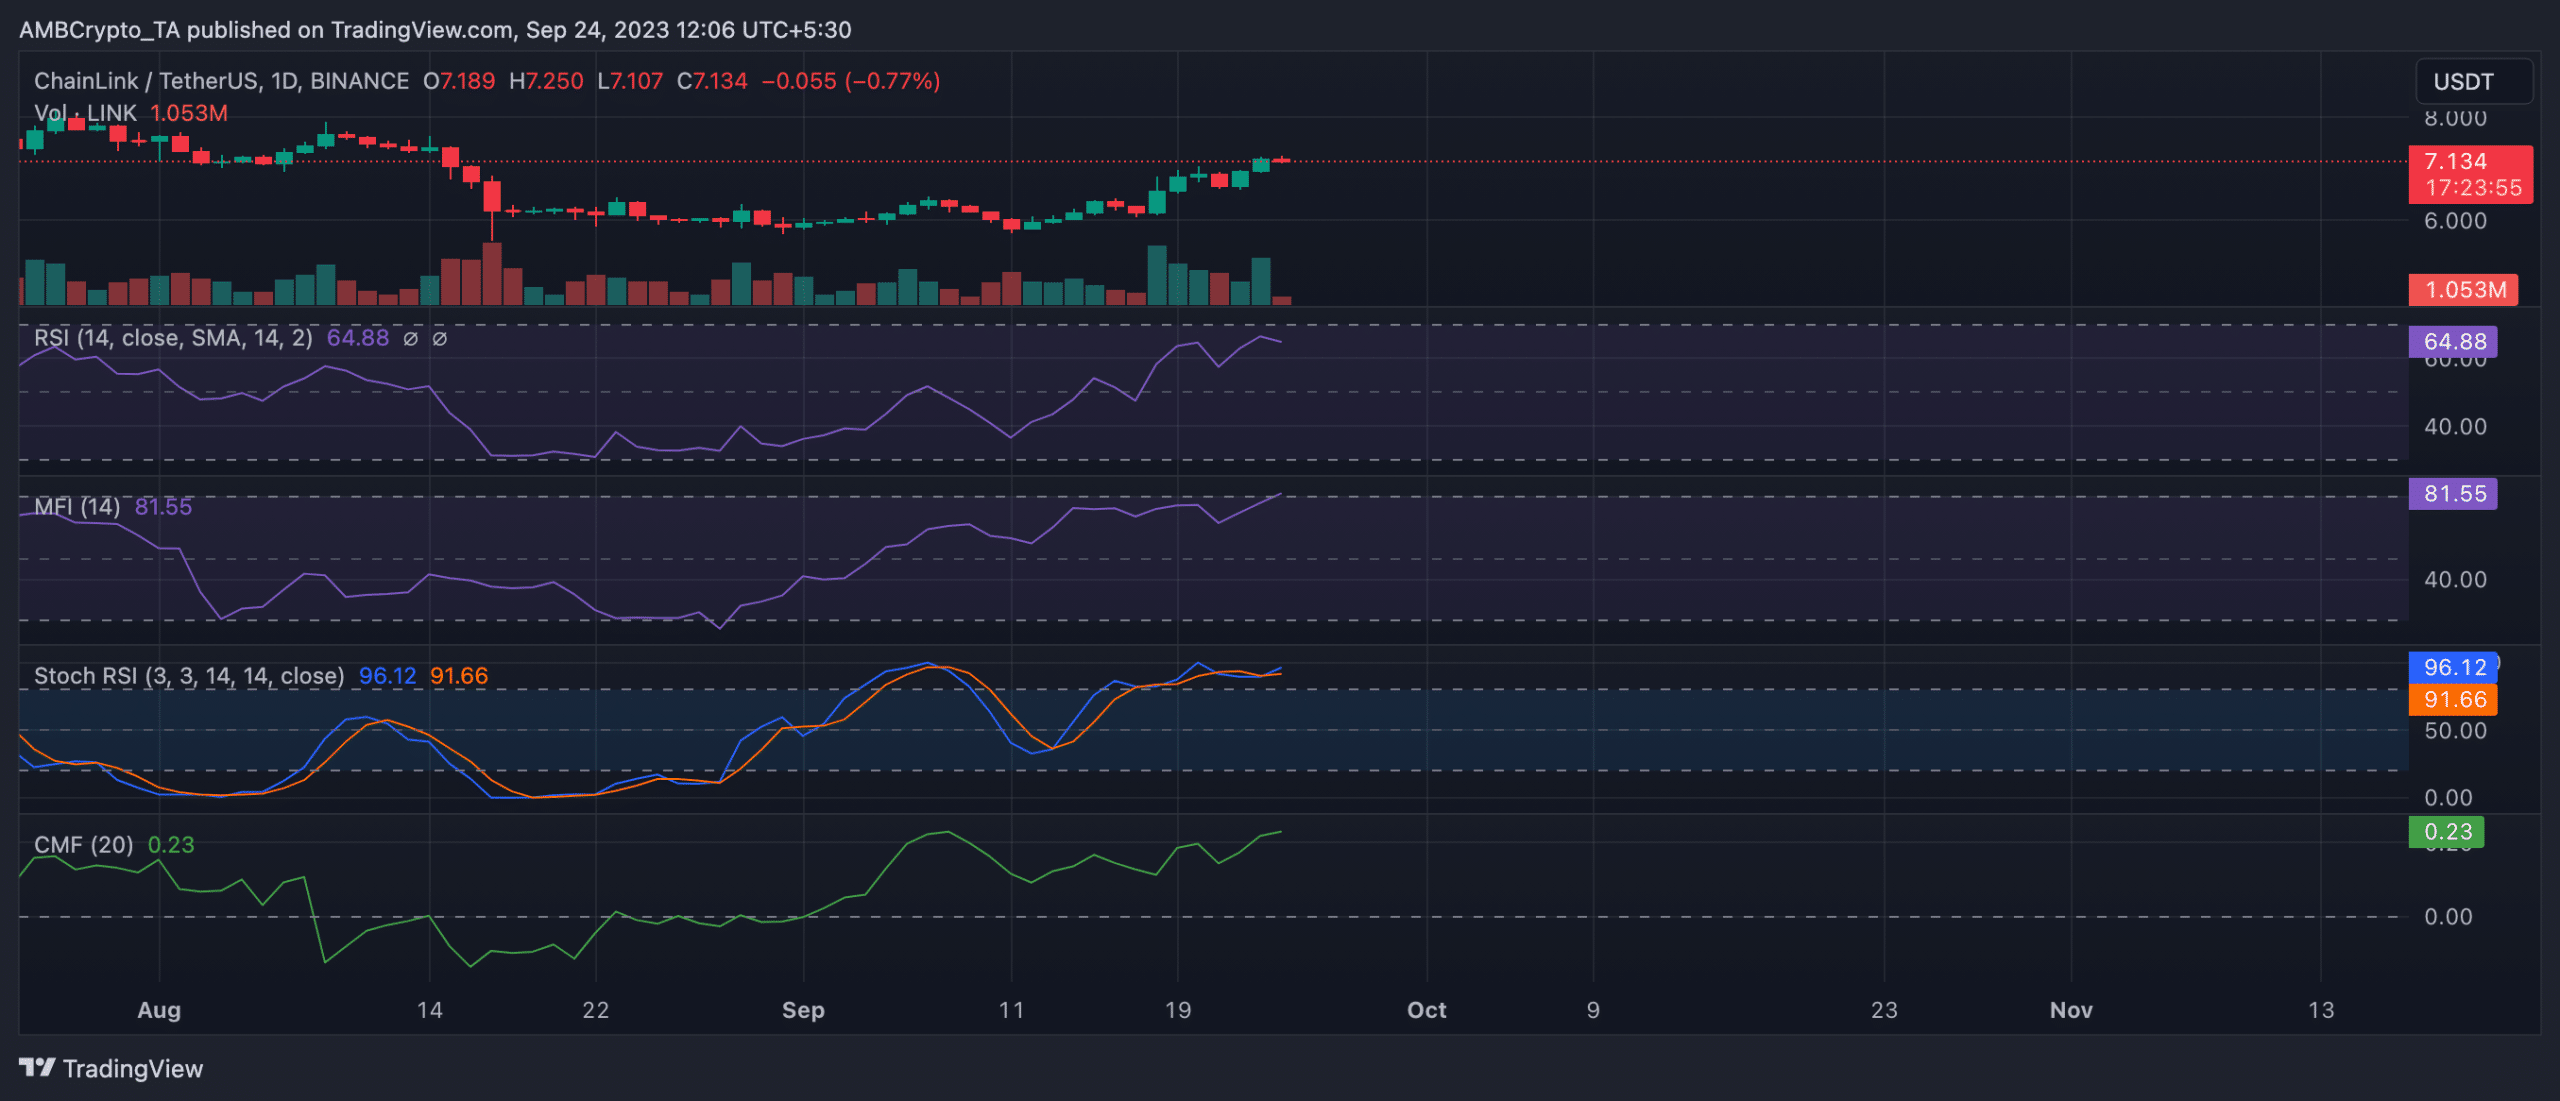
Readings made from LINK’s price movements on a daily chart confirmed the bullish momentum in the alt’s market. Key momentum indicators rested above their respective center lines at press time, suggesting that spot traders have continued to accumulate the token.
For example, LINK’s Relative Strength Index (RSI) was 64.88. Its Money Flow Index (MFI) at 81.55 suggested that the token might even be overbought due to increased accumulation pressure.
Its Chaikin Money Flow (CMF) – which tracks an asset’s buying and selling pressure over a period of time – was positioned above the zero line at 0.23. CMF values above the zero line indicate that there is more buying pressure than selling pressure.
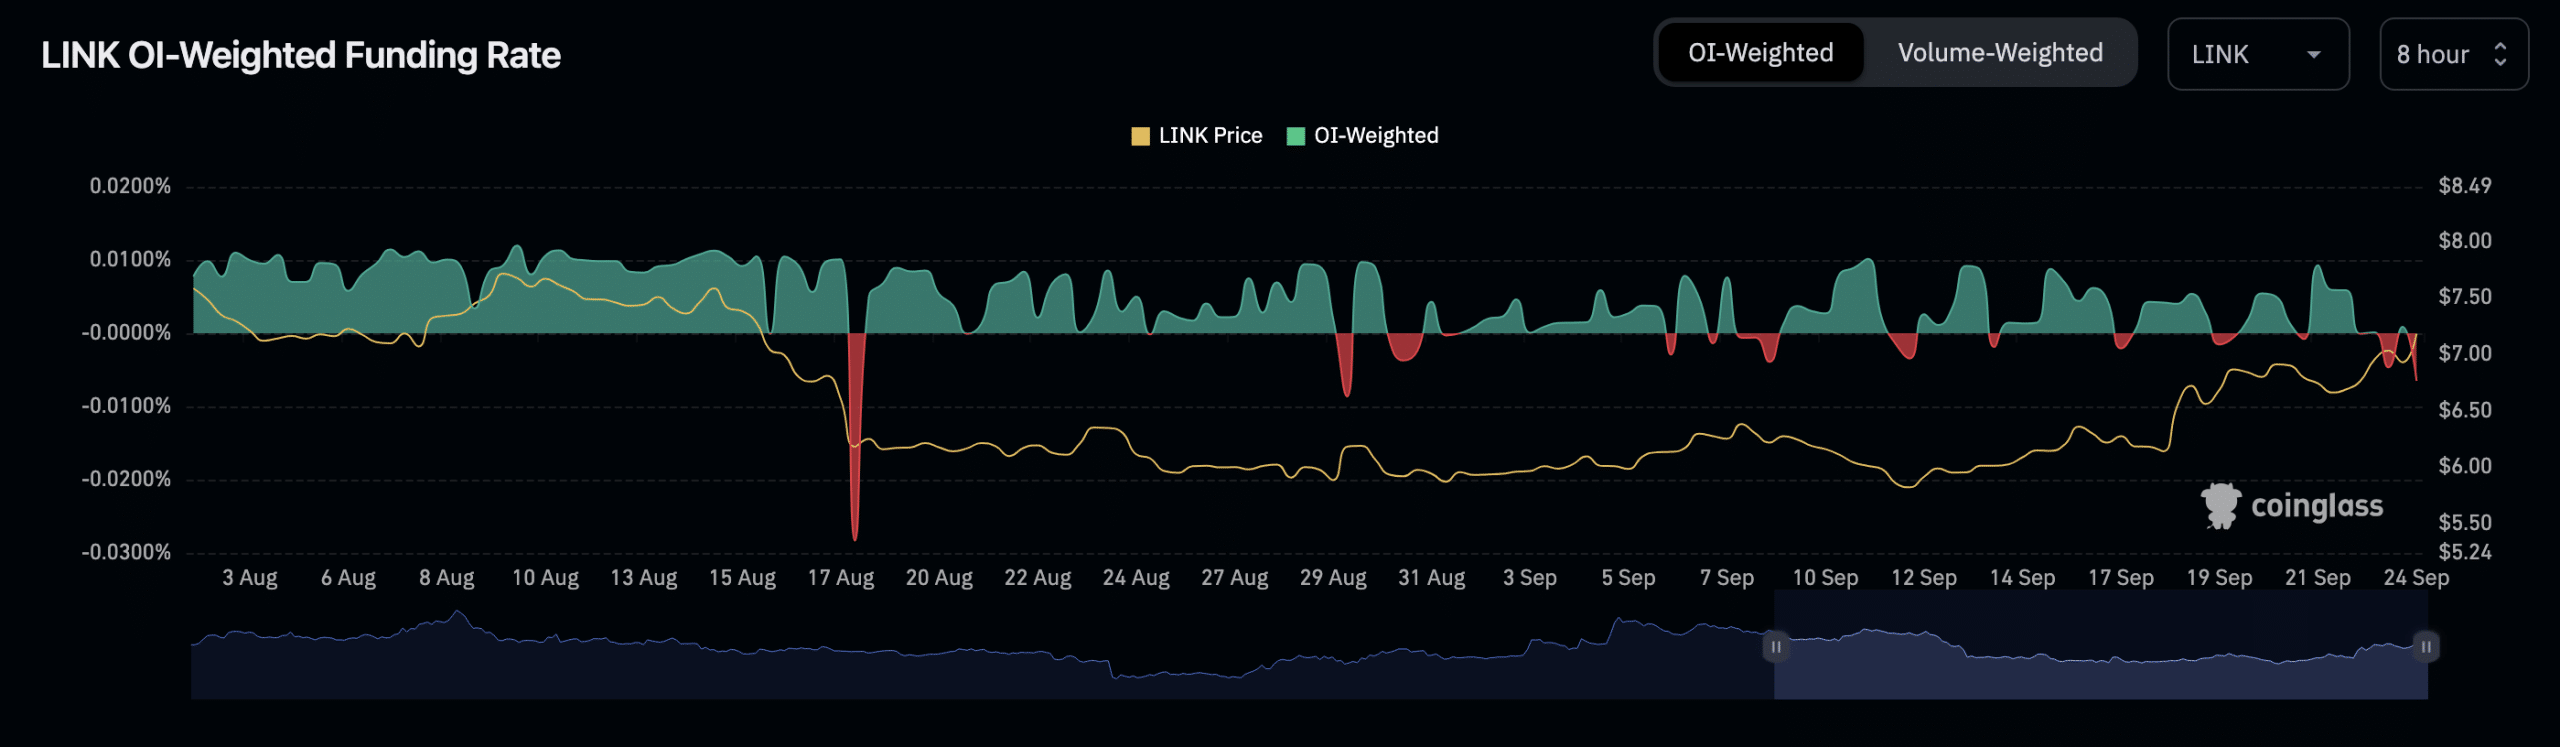
In LINK’s futures market, bullish sentiment was also spotted. The token’s Open Interest has risen by 69% since 17 September, according to data from Coinglass. At press time, this was $181 million.
Likewise, the token’s funding rates across exchanges have been predominantly positive within the same period. While there have been days marked by negative funding rates, most traders in LINK’s futures market have continued to place bets in favor of a price rally.
Realistic or not, here’s LINK’s market cap in BTC’s terms
Not ready to sell
An assessment of the alt’s exchange activity revealed a decline in sell-off activity in the past few days. After a period of increased sell-offs, the past few days have seen a decline in profit-taking activity.
Data from Glassnode showed LINK’s Net Transfer Volume from/to Exchanges to be negative since 22 September, suggesting that more LINK tokens have since been transferred off exchanges than onto exchanges.


