
What FARTCOIN’s $2 mln whale movement means for traders targeting $1.60

Disclaimer: The findings of the following analysis are the sole opinions of the writer and should not be considered investment advice.
Chainlink’s [LINK] previous movements revitalized the bearishness while it saw a volatile plunge below the Point of Control (POC, red). As a result, LINK fell to retest the $6.1 zone before marking an impressive 24-hour revival.
As the bulls breached the 20/50/200 EMA, the recent outlook for the alt favored the bulls. But looking at the rejection of higher prices at the trendline resistance, LINK could continue its sluggish phase in the coming times. At press time, LINK was trading at $6.814, up by 8.16% in the last 24 hours.
LINK 4-hour Chart
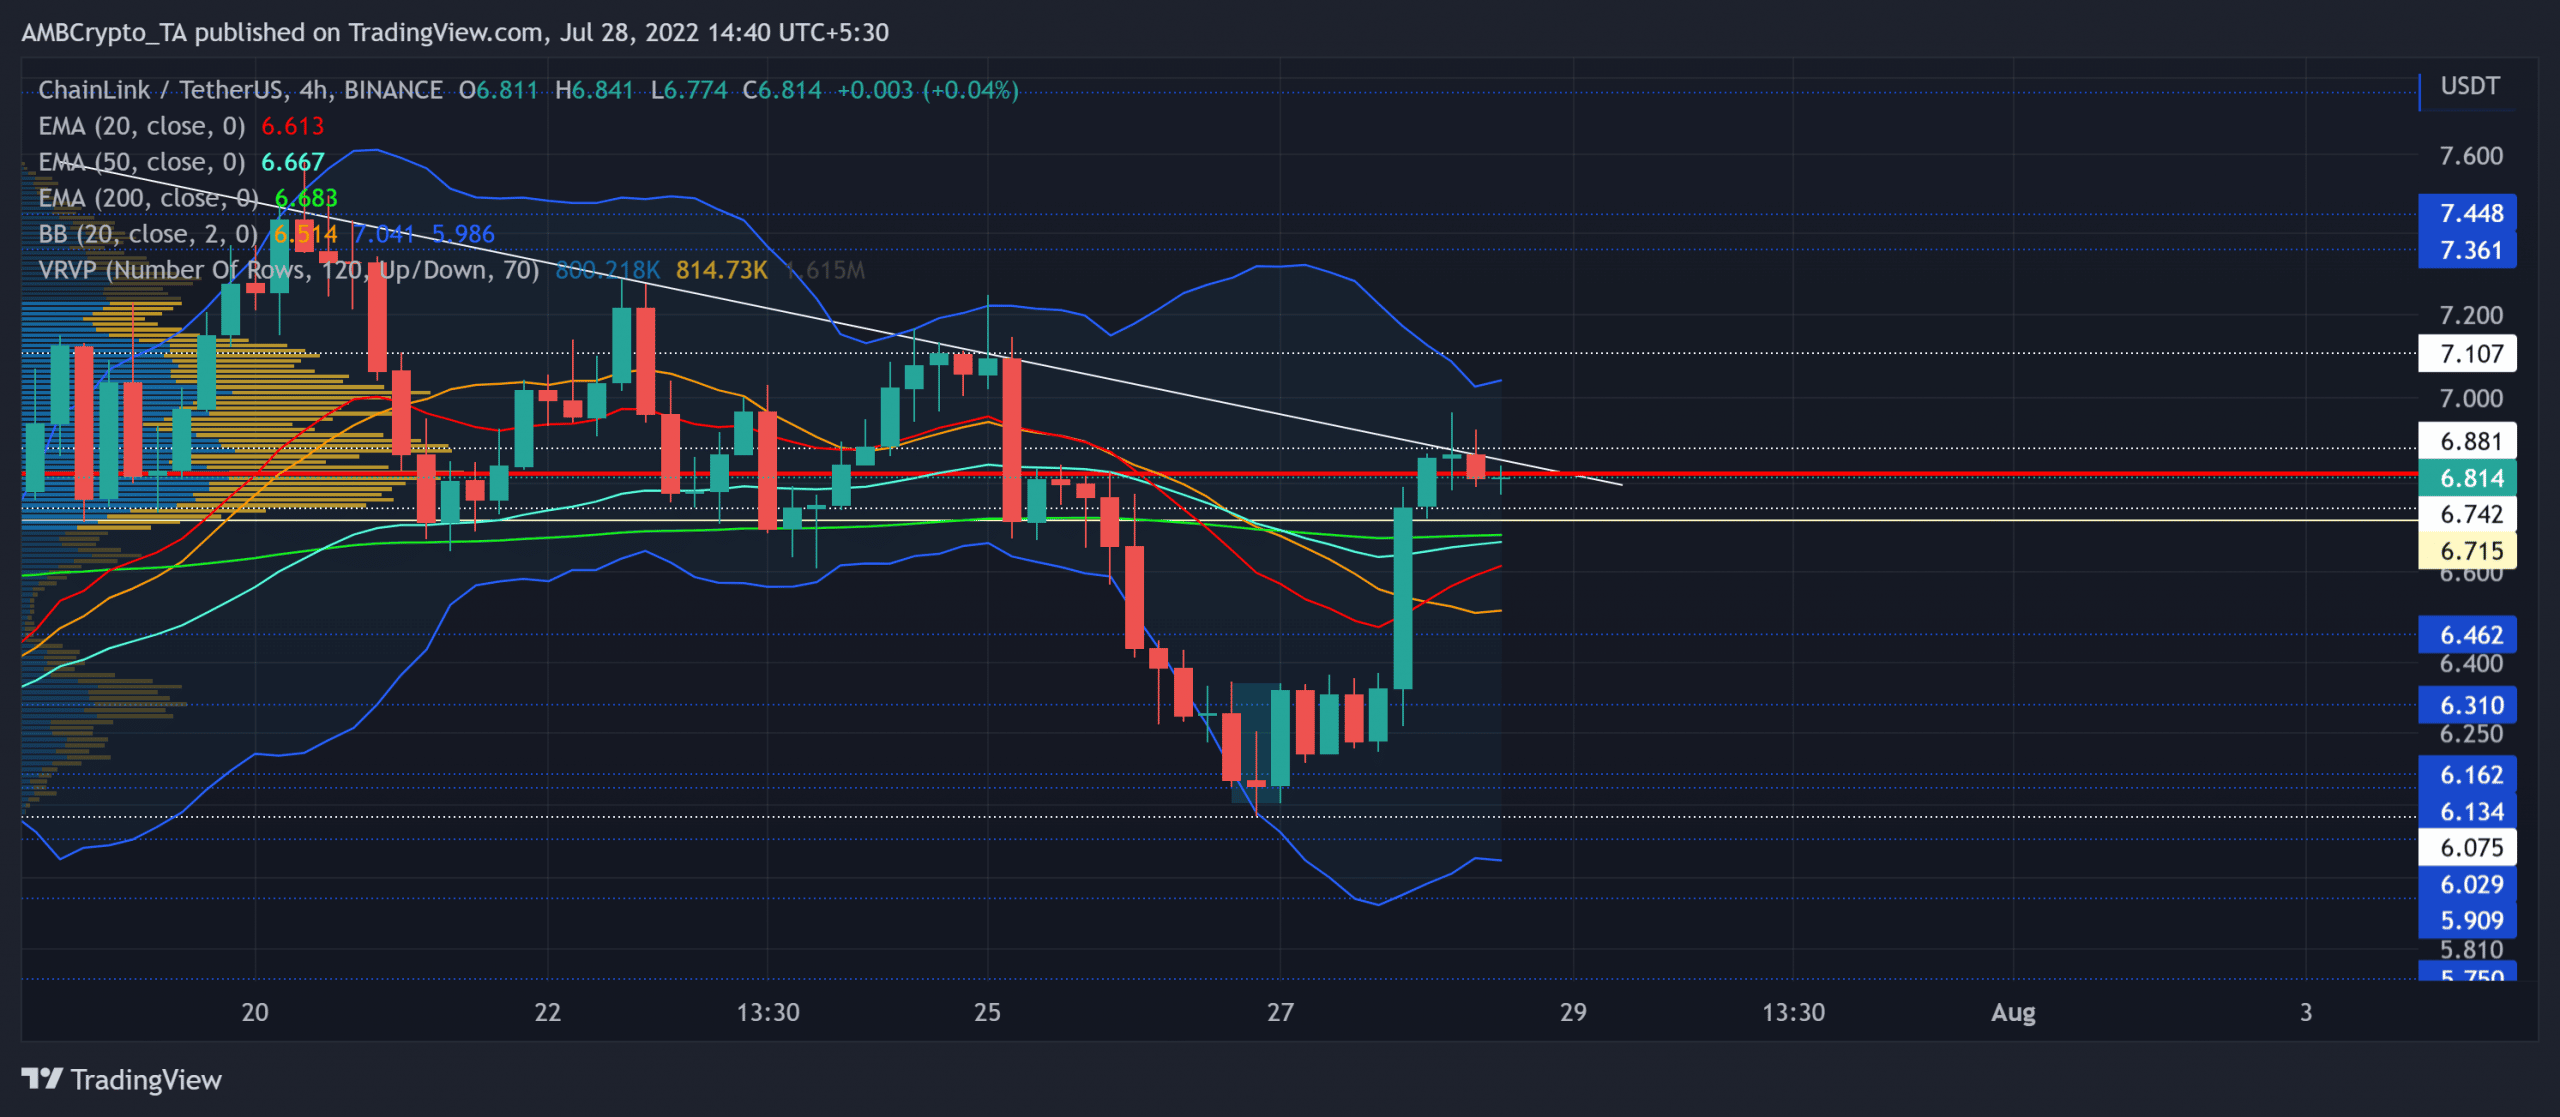
Source: TradingView, LINK/USDT
LINK’s descent from the $7.4-mark transposed into a descending triangle structure in this timeframe. Sellers provoked a series of lower lows that kept testing the $6.715 level until finally breaching it. A nearly 13% one-day drop pulled the alt toward a multi-weekly low on 26 July.
The last two days observed a strong buying resurgence while the alt jumped above the 20/50/200 EMAs. The morning star candlestick pattern aided the bulls in inflicting a convincing rebound toward the trendline resistance (white).
As the recent bullish engulfing candlestick reflected a robust uptick in buying volumes, buyers could aim to snap the $6.8 resistance. However, a sustained close below the immediate resistance would extend the sluggish phase near the POC. In this case, a potential rebounding target could lie near the basis line of the Bollinger Bands (BB) in the $6.5-region.
Any close above the trendline resistance could position LINK to retest the $7.1-zone before a likely reversal.
Rationale

Source: TradingView, LINK/USDT
The Relative Strength Index (RSI) sustained itself above the midline to depict a slight bullish edge. But the reversal from its trendline resistance could reaffirm the bearish divergence with the price action.
Also, the Chaikin Money Flow (CMF) saw a gradual rise in its peaks. Similar to RSI, any reversals from the resistance line could confirm a bearish divergence. Nevertheless, the ADX displayed a weak directional trend for the alt.
Conclusion
LINK was walking on a thin line at press time. A bullish crossover on the EMAs could reignite the buying power. But the threats along the indicators could delay these tendencies in the near term. In either case, the targets would remain the same as discussed.
Finally, an overall market sentiment analysis becomes vital to complement the technical factors to make a profitable move.


