
Chainlink flipped the $28.34 level from resistance to support over the past few days and defended it from bearish pressure once more. VeChain was strongly bullish on the charts as bulls eyed a target of $0.077, and Decred was trading at $149.
Chainlink [LINK]
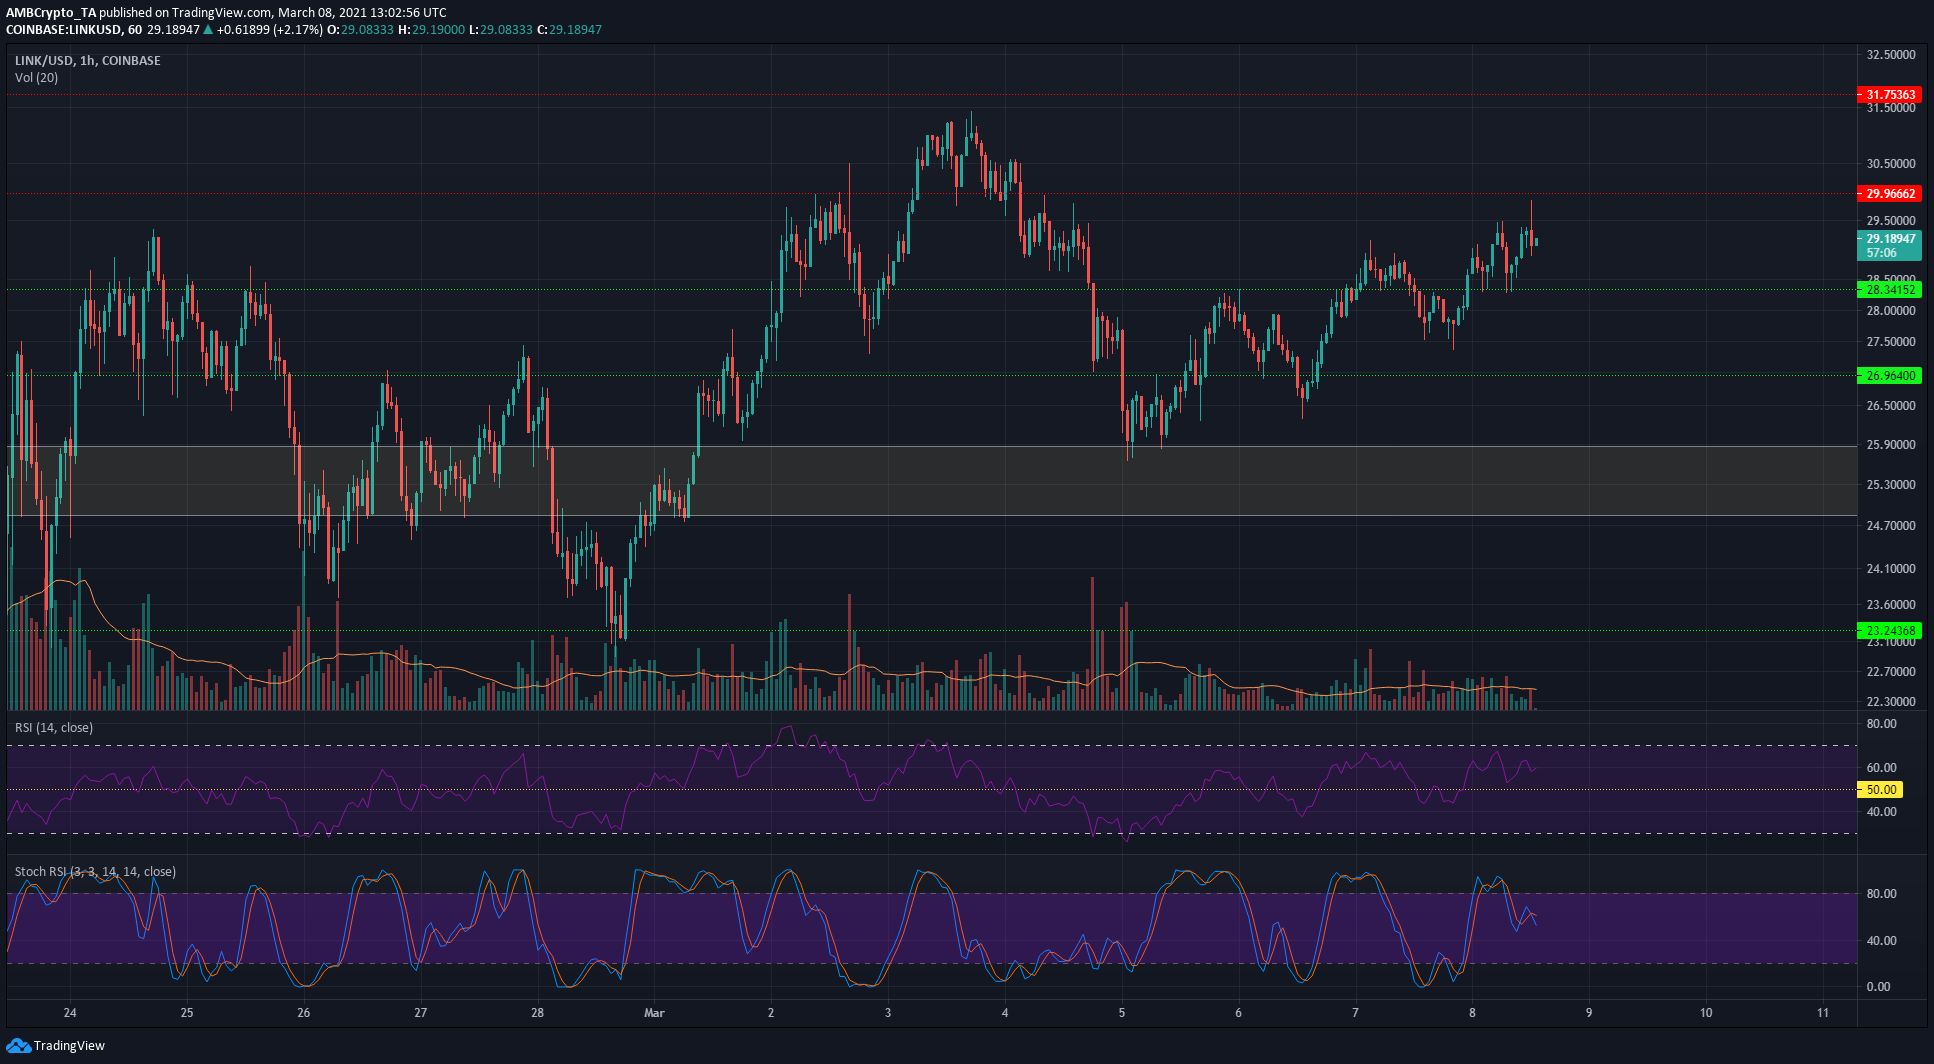
Source: LINK/USD on TradingView
On the hourly chart, LINK made steady progress past levels of former resistance, now turned support. The past couple of days saw the $28.34 level flipped to support, ceded to selling pressure before being converted into a support level once more.
This showed that in the short-term, there was some demand for LINK, which should aid its move toward and past $30 over the next few days.
The RSI moved above the neutral 50 value while the Stochastic RSI had corrected from overbought territory, showing further gain are possible in the coming hours.
VeChain [VET]
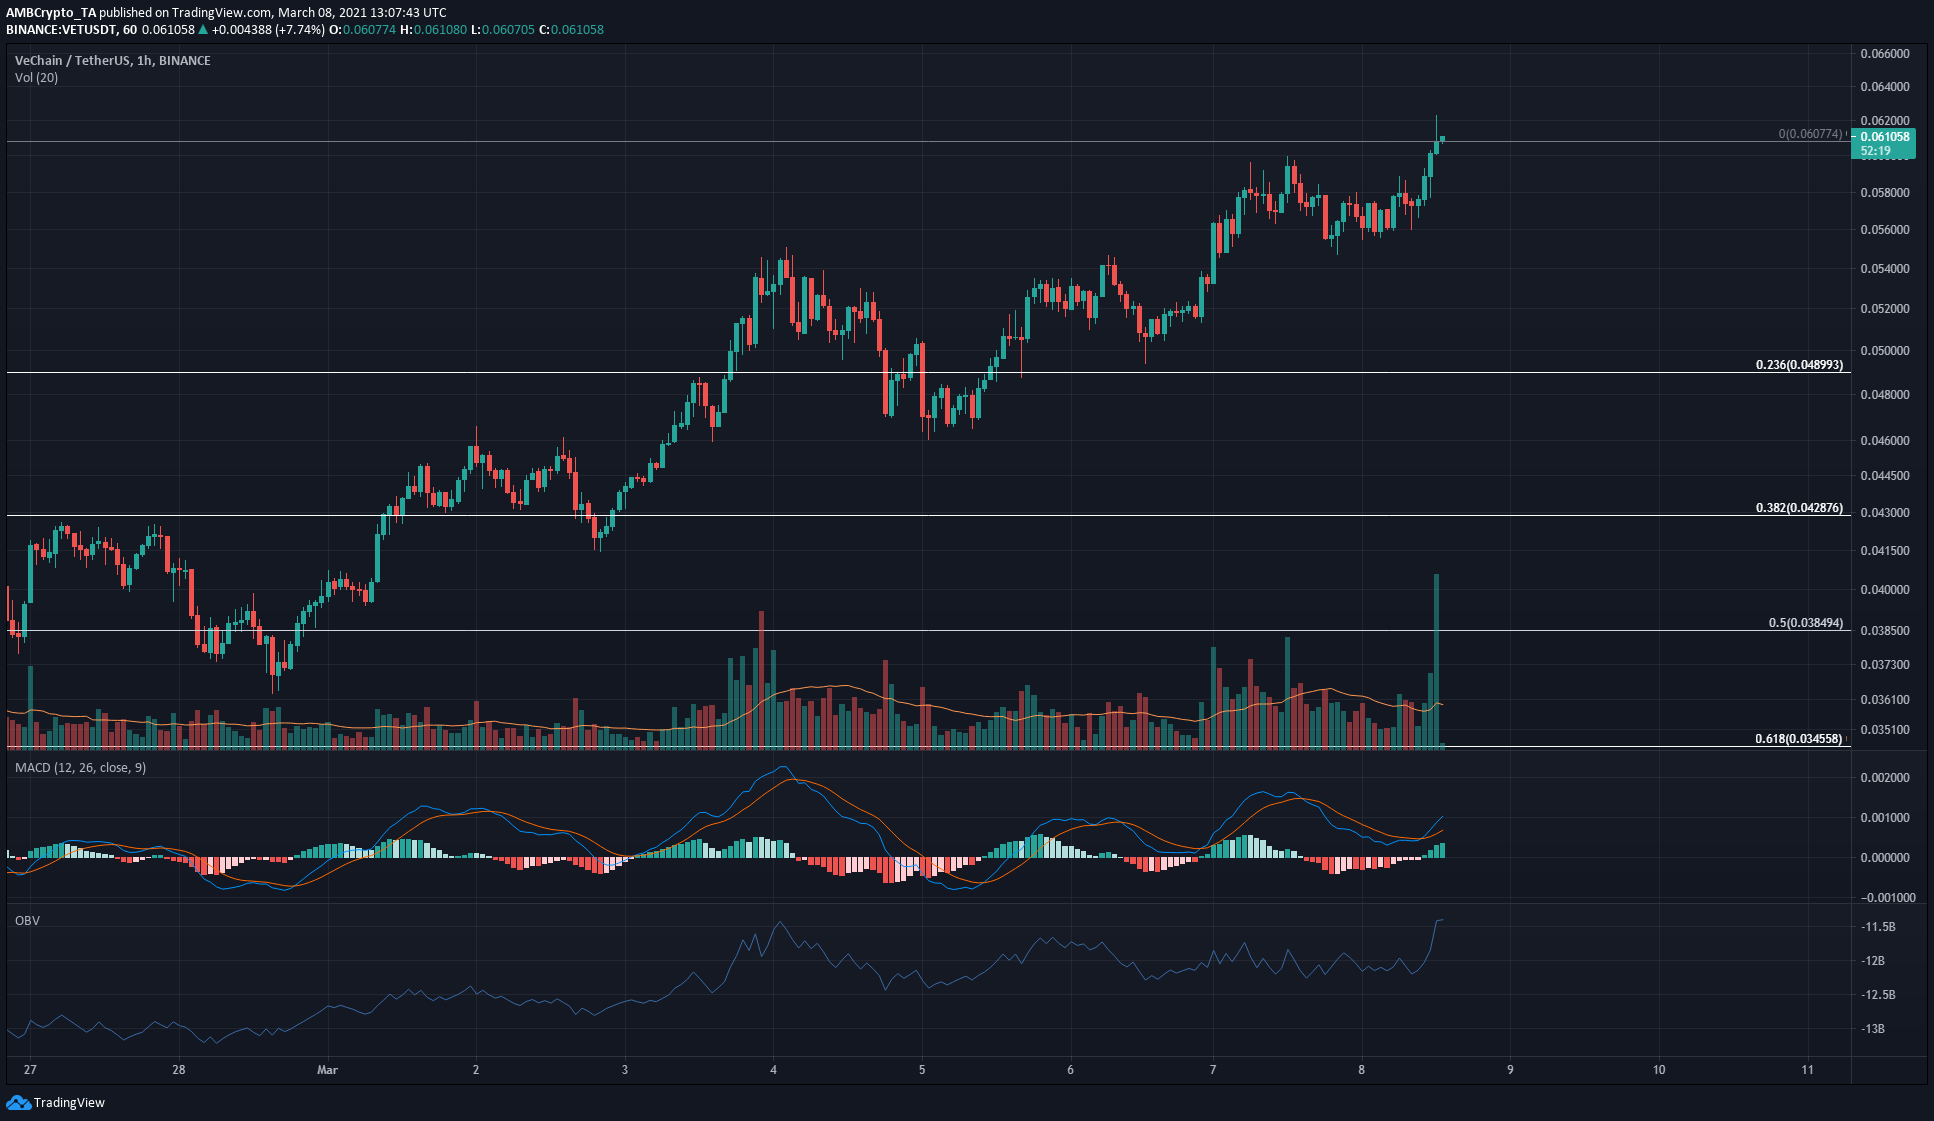
Source: VET/USDT on TradingView
The $0.06 was a high reached in mid-February, and a brief rectangle-top pattern was formed before VET plunged to $0.038. However, the bulls have picked up the pieces since, and driven the prices past the local highs at $0.06.
This recovery was driven by strong demand, as the OBV shows a series of higher lows that have formed recently. This is indicative of buying volume being greater than selling volume, that is, greater demand than supply recently.
The Fibonacci extension levels past $0.06 give a bullish target of $0.077 (27% extension) for VET bulls to achieve over the next few days.
Decred [DCR]
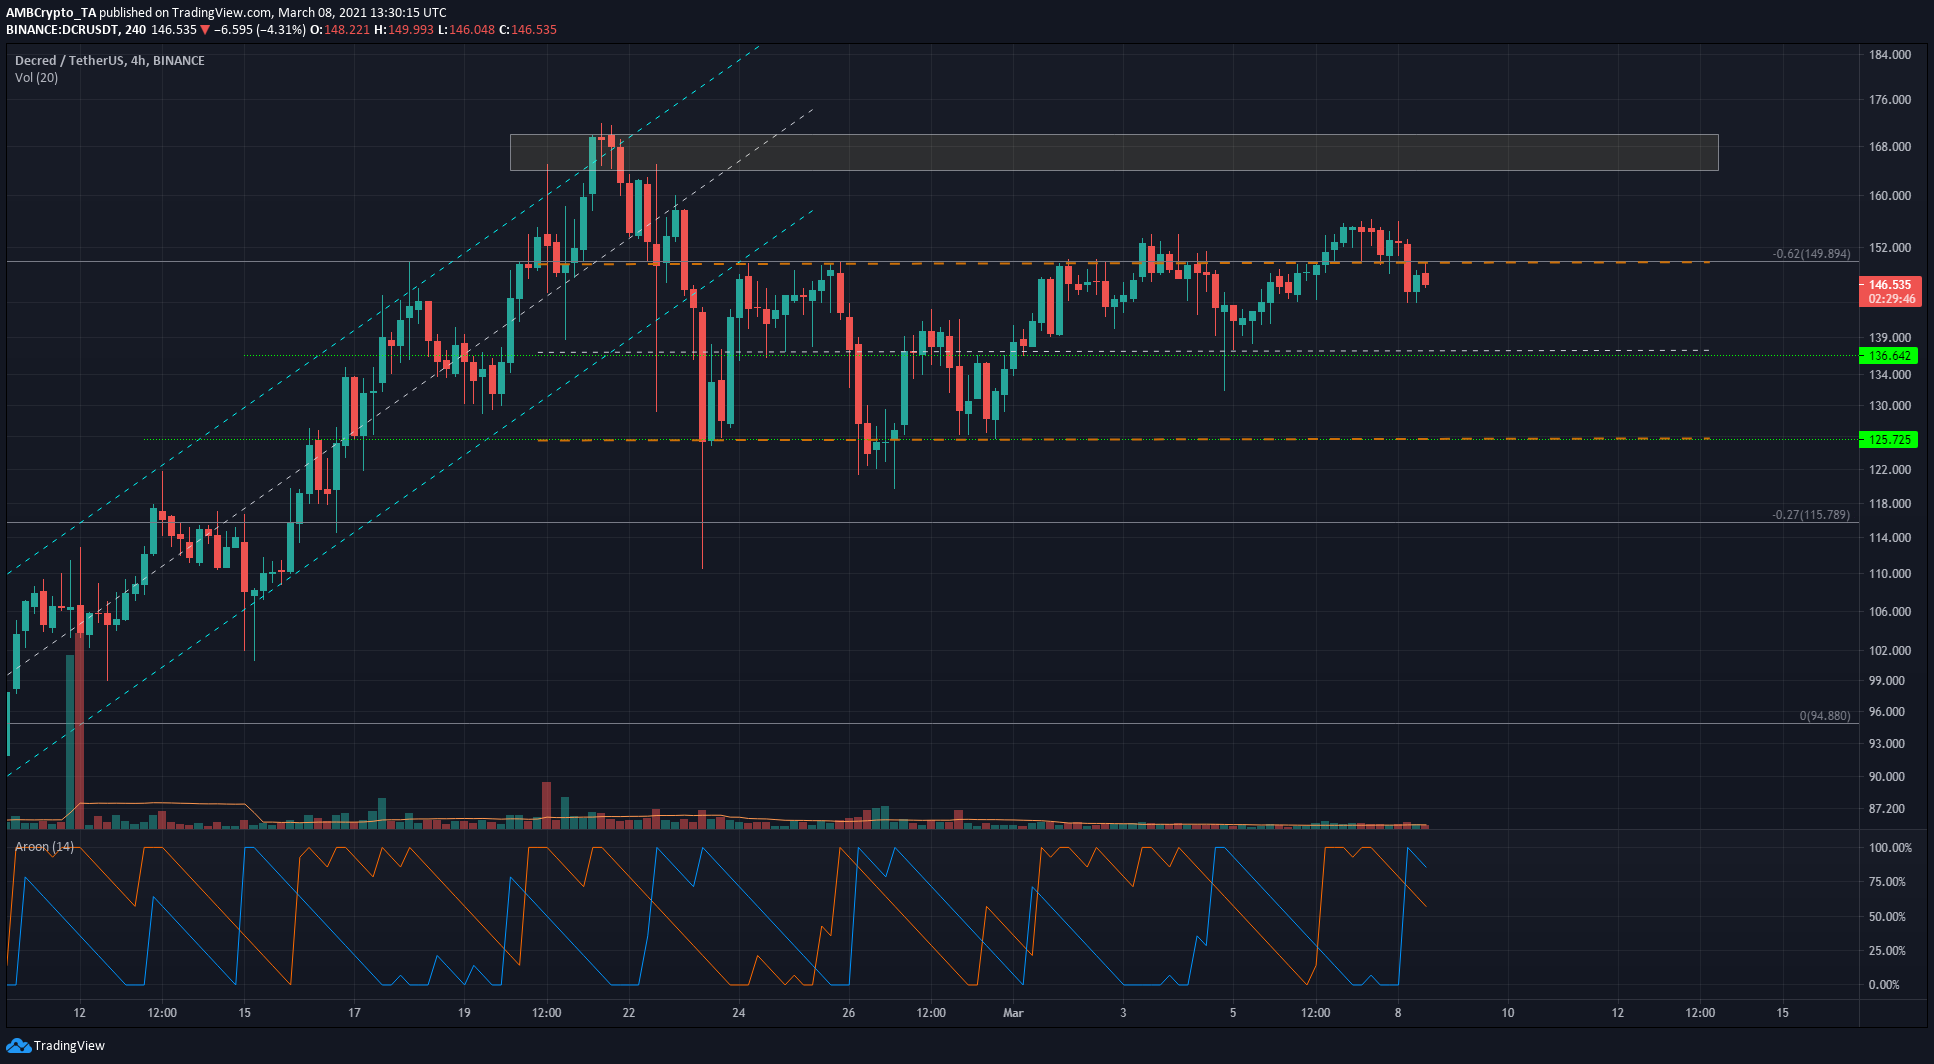
Source: DCR/USDT on TradingView
The ascending channel (cyan) was one that DCR has been trading within since late January. DCR broke down beneath the channel, but not far. The $125 mark caught its fall and served as support on multiple retests.
Since then, a short-term range appears to have formed, from $125 to $149.
On the 4-hour chart, the Aroon indicator showed some choppiness for DCR- a trend hasn’t yet been established. Above the $149 mark, which also represents the 62% Fibonacci extension level for a past move, there lies a region of supply at $165-$170.