Charting the stablecoin market course for Q1 2024
USDT's dominance chart can gauge how the altcoin market will perform in coming weeks.

- The stablecoin metrics pointed toward a robust crypto market and rising confidence in it.
- The dominance chart showed that the altcoin run was not yet done.
The crypto market capitalization has been on the rise since late September. It was around that time that Bitcoin [BTC] found demand at the $26k level and began to rally higher. This infused confidence across the market.
AMBCrypto looked at some relevant stablecoin metrics and found that they reflected investor confidence. Could this winning run extend into the new year?
The stablecoin market shows an uptick in usage and adoption
Some on-chain metrics for the stablecoin market are the exchange reserve, inflows, circulating supply, and active addresses. AMBCrypto noted that the circulating supply of ERC20 stablecoins has trended higher over the past month.
The last time this happened was in February/March 2023. In the intervening period, the supply has trended downward. This could be due to a variety of factors.
For example, stablecoins could be staked to earn rewards during times of market uncertainty or a lack of a strong uptrend.
They might also be locked in DeFi platforms for loans or yield farming, or users could be holding their stablecoin in reserve for a large drop in prices before entering the markets.
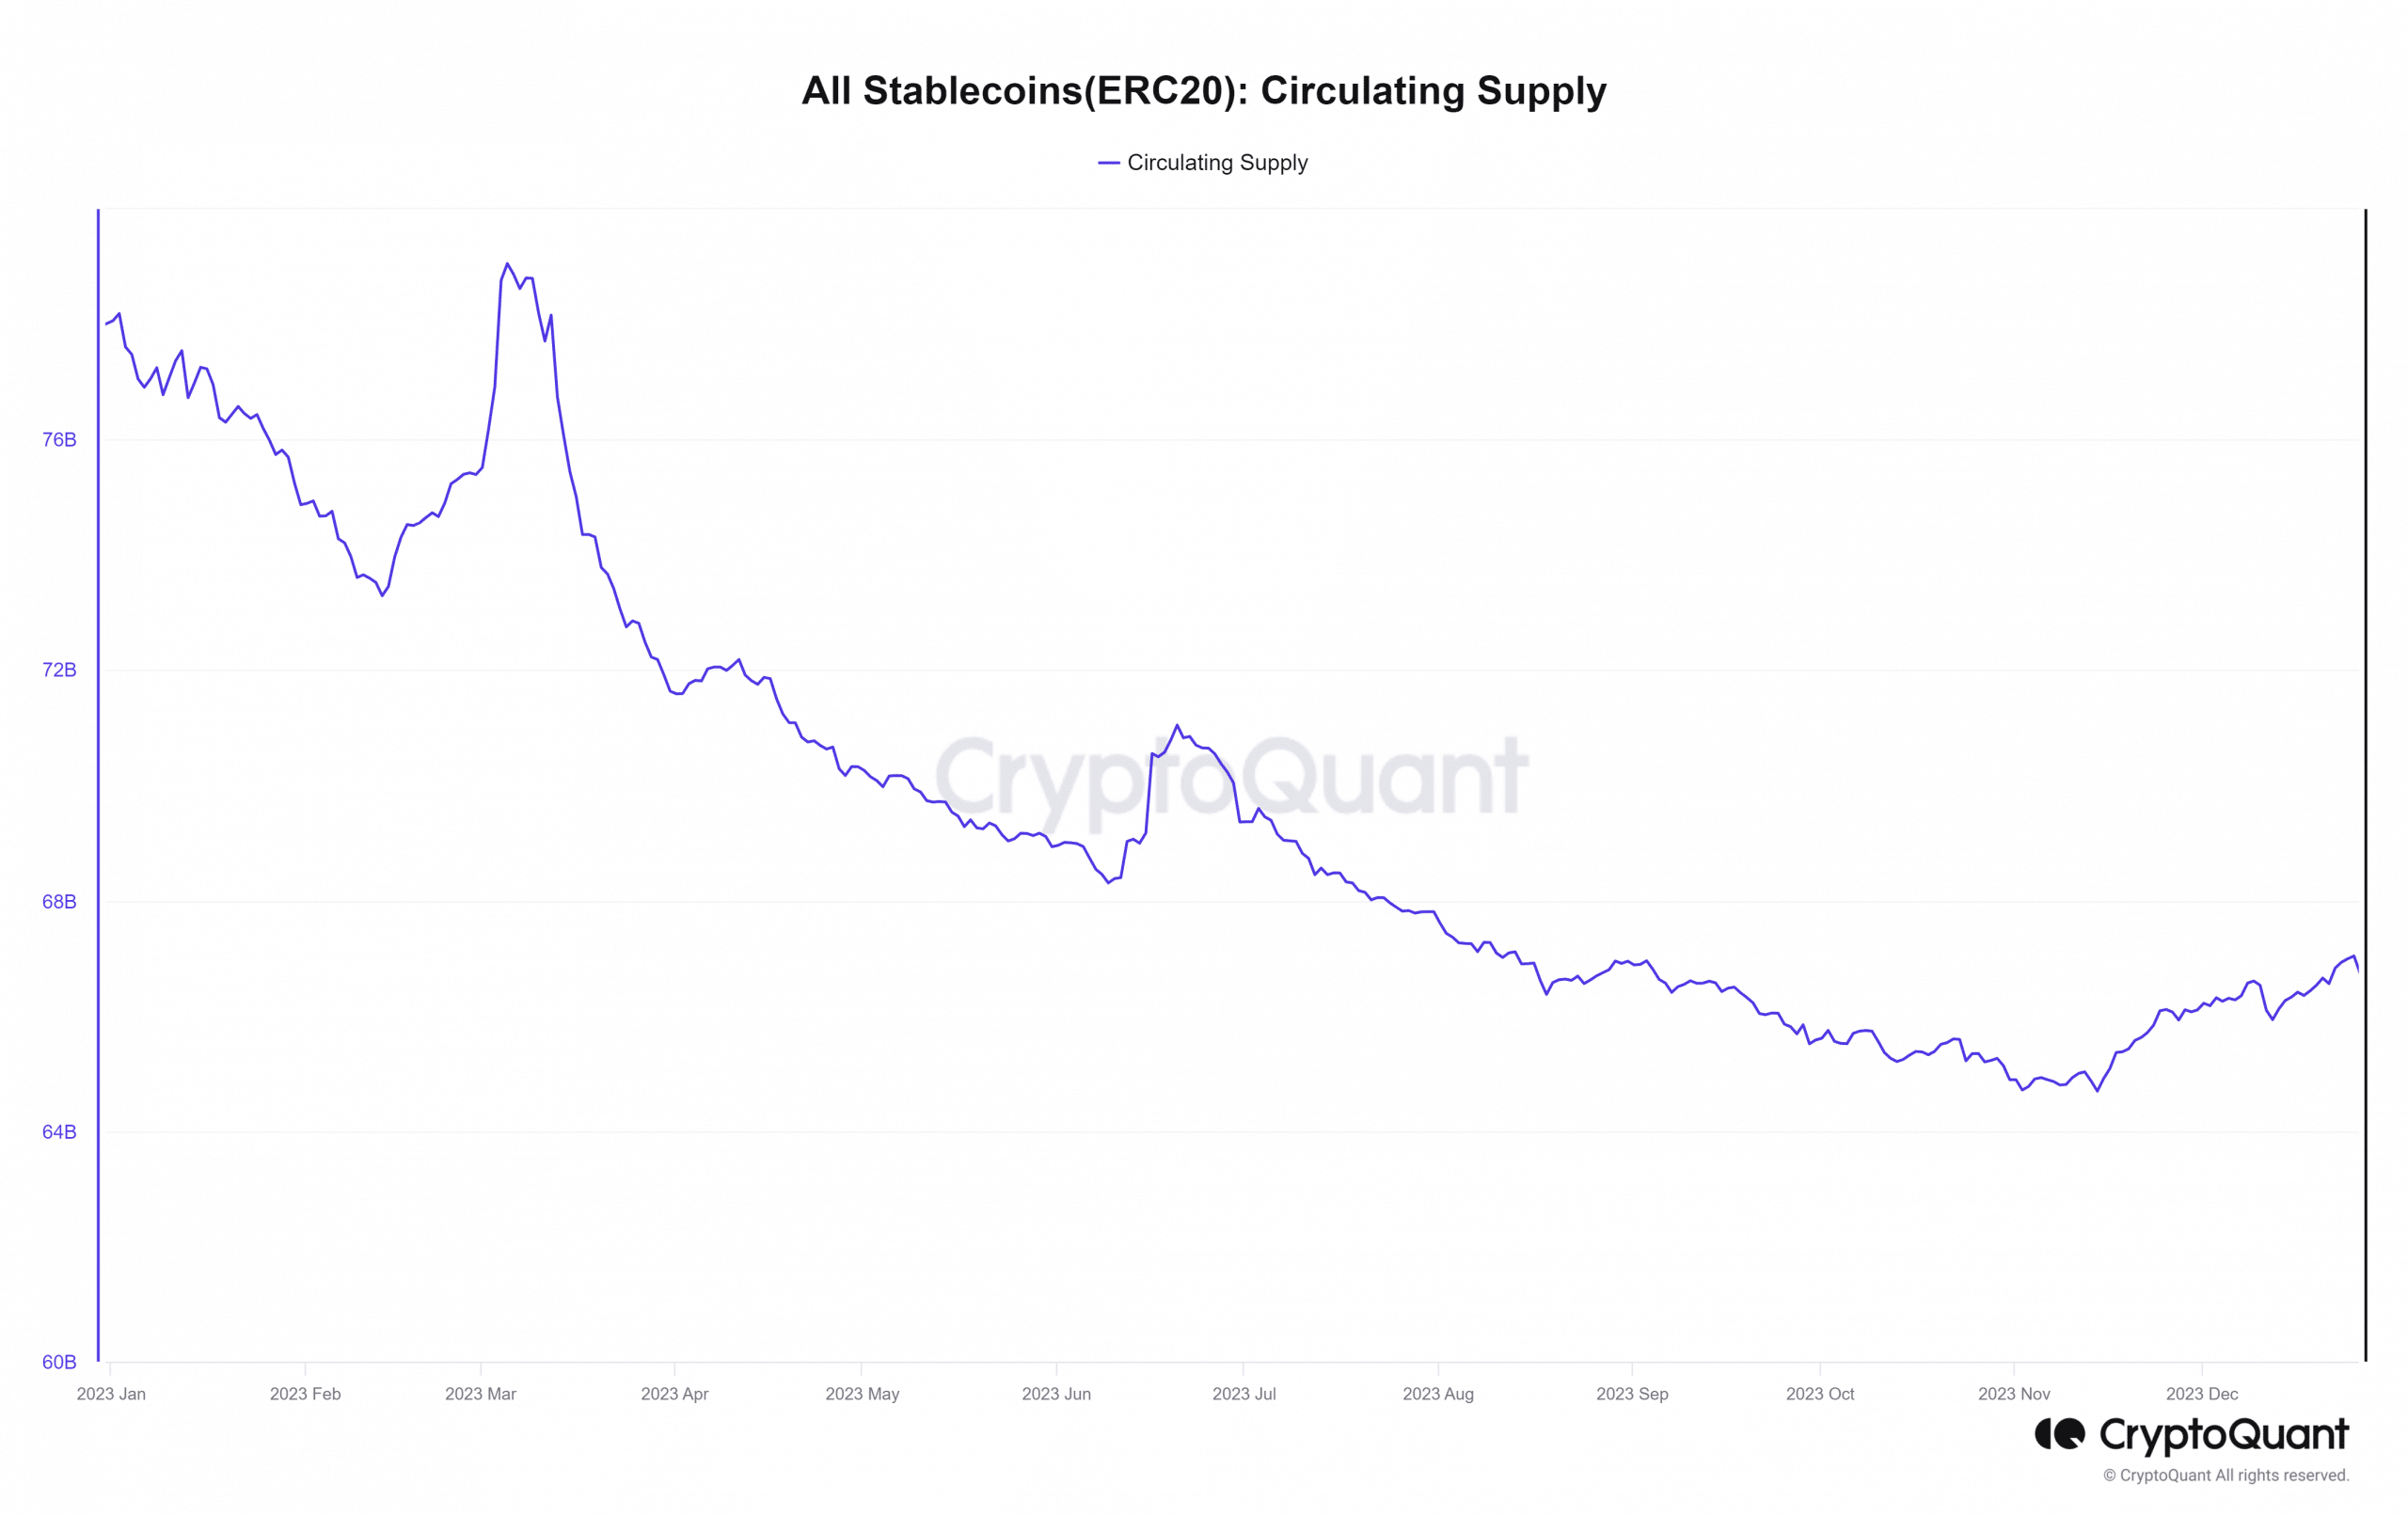
The uptick in the circulating supply since mid-November suggested that more stablecoins are being used in day-to-day transactions, or in trading and speculatory ventures.
This pointed toward increased usage, which is generally a positive outcome.
The speculation is an indication that market participants have more confidence in crypto assets. A look at the rising Open Interest of Bitcoin, or many other assets, shows strong bullish market sentiment in recent weeks.
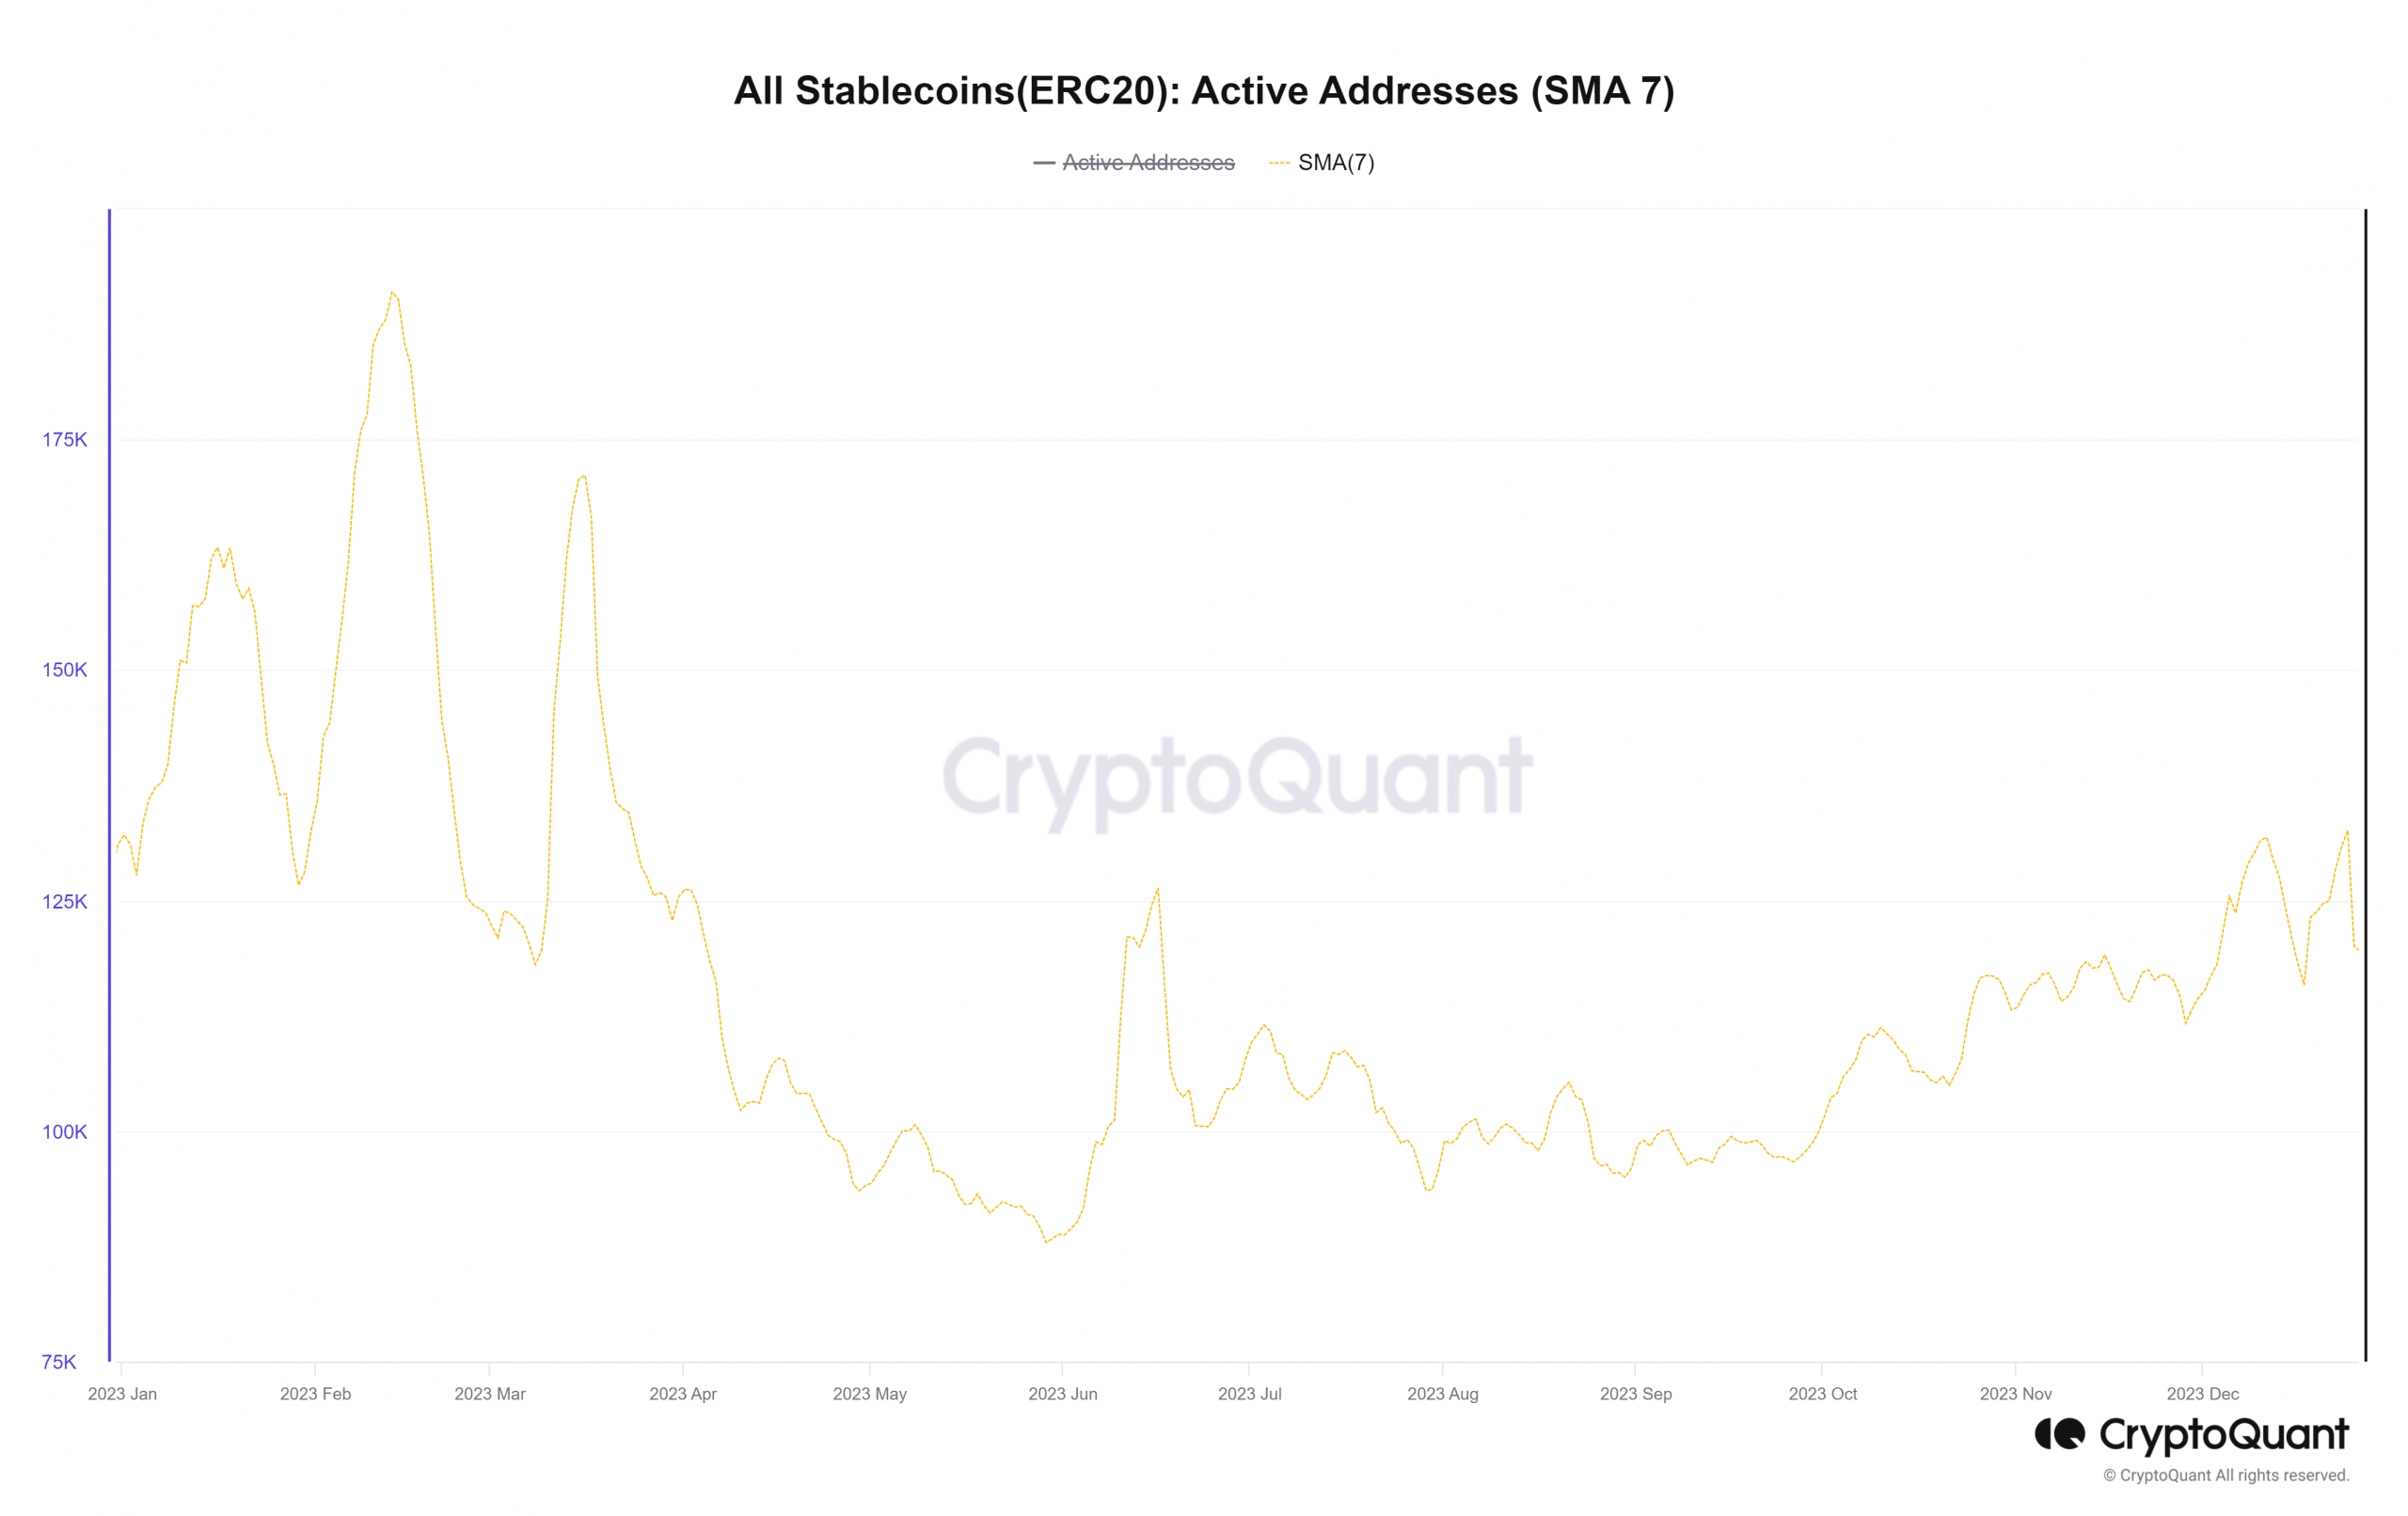
The active addresses count has also trended higher since late September. The 7-day Simple Moving Average showcased this more clearly. The uptrend of supply and unique active addresses pointed toward greater market activity and adoption.
Alongside this, the exchange inflow has also tracked higher since mid-October. It was a sign of rising buying pressure in the crypto market since an influx of stablecoins to exchanges provides ready liquidity.
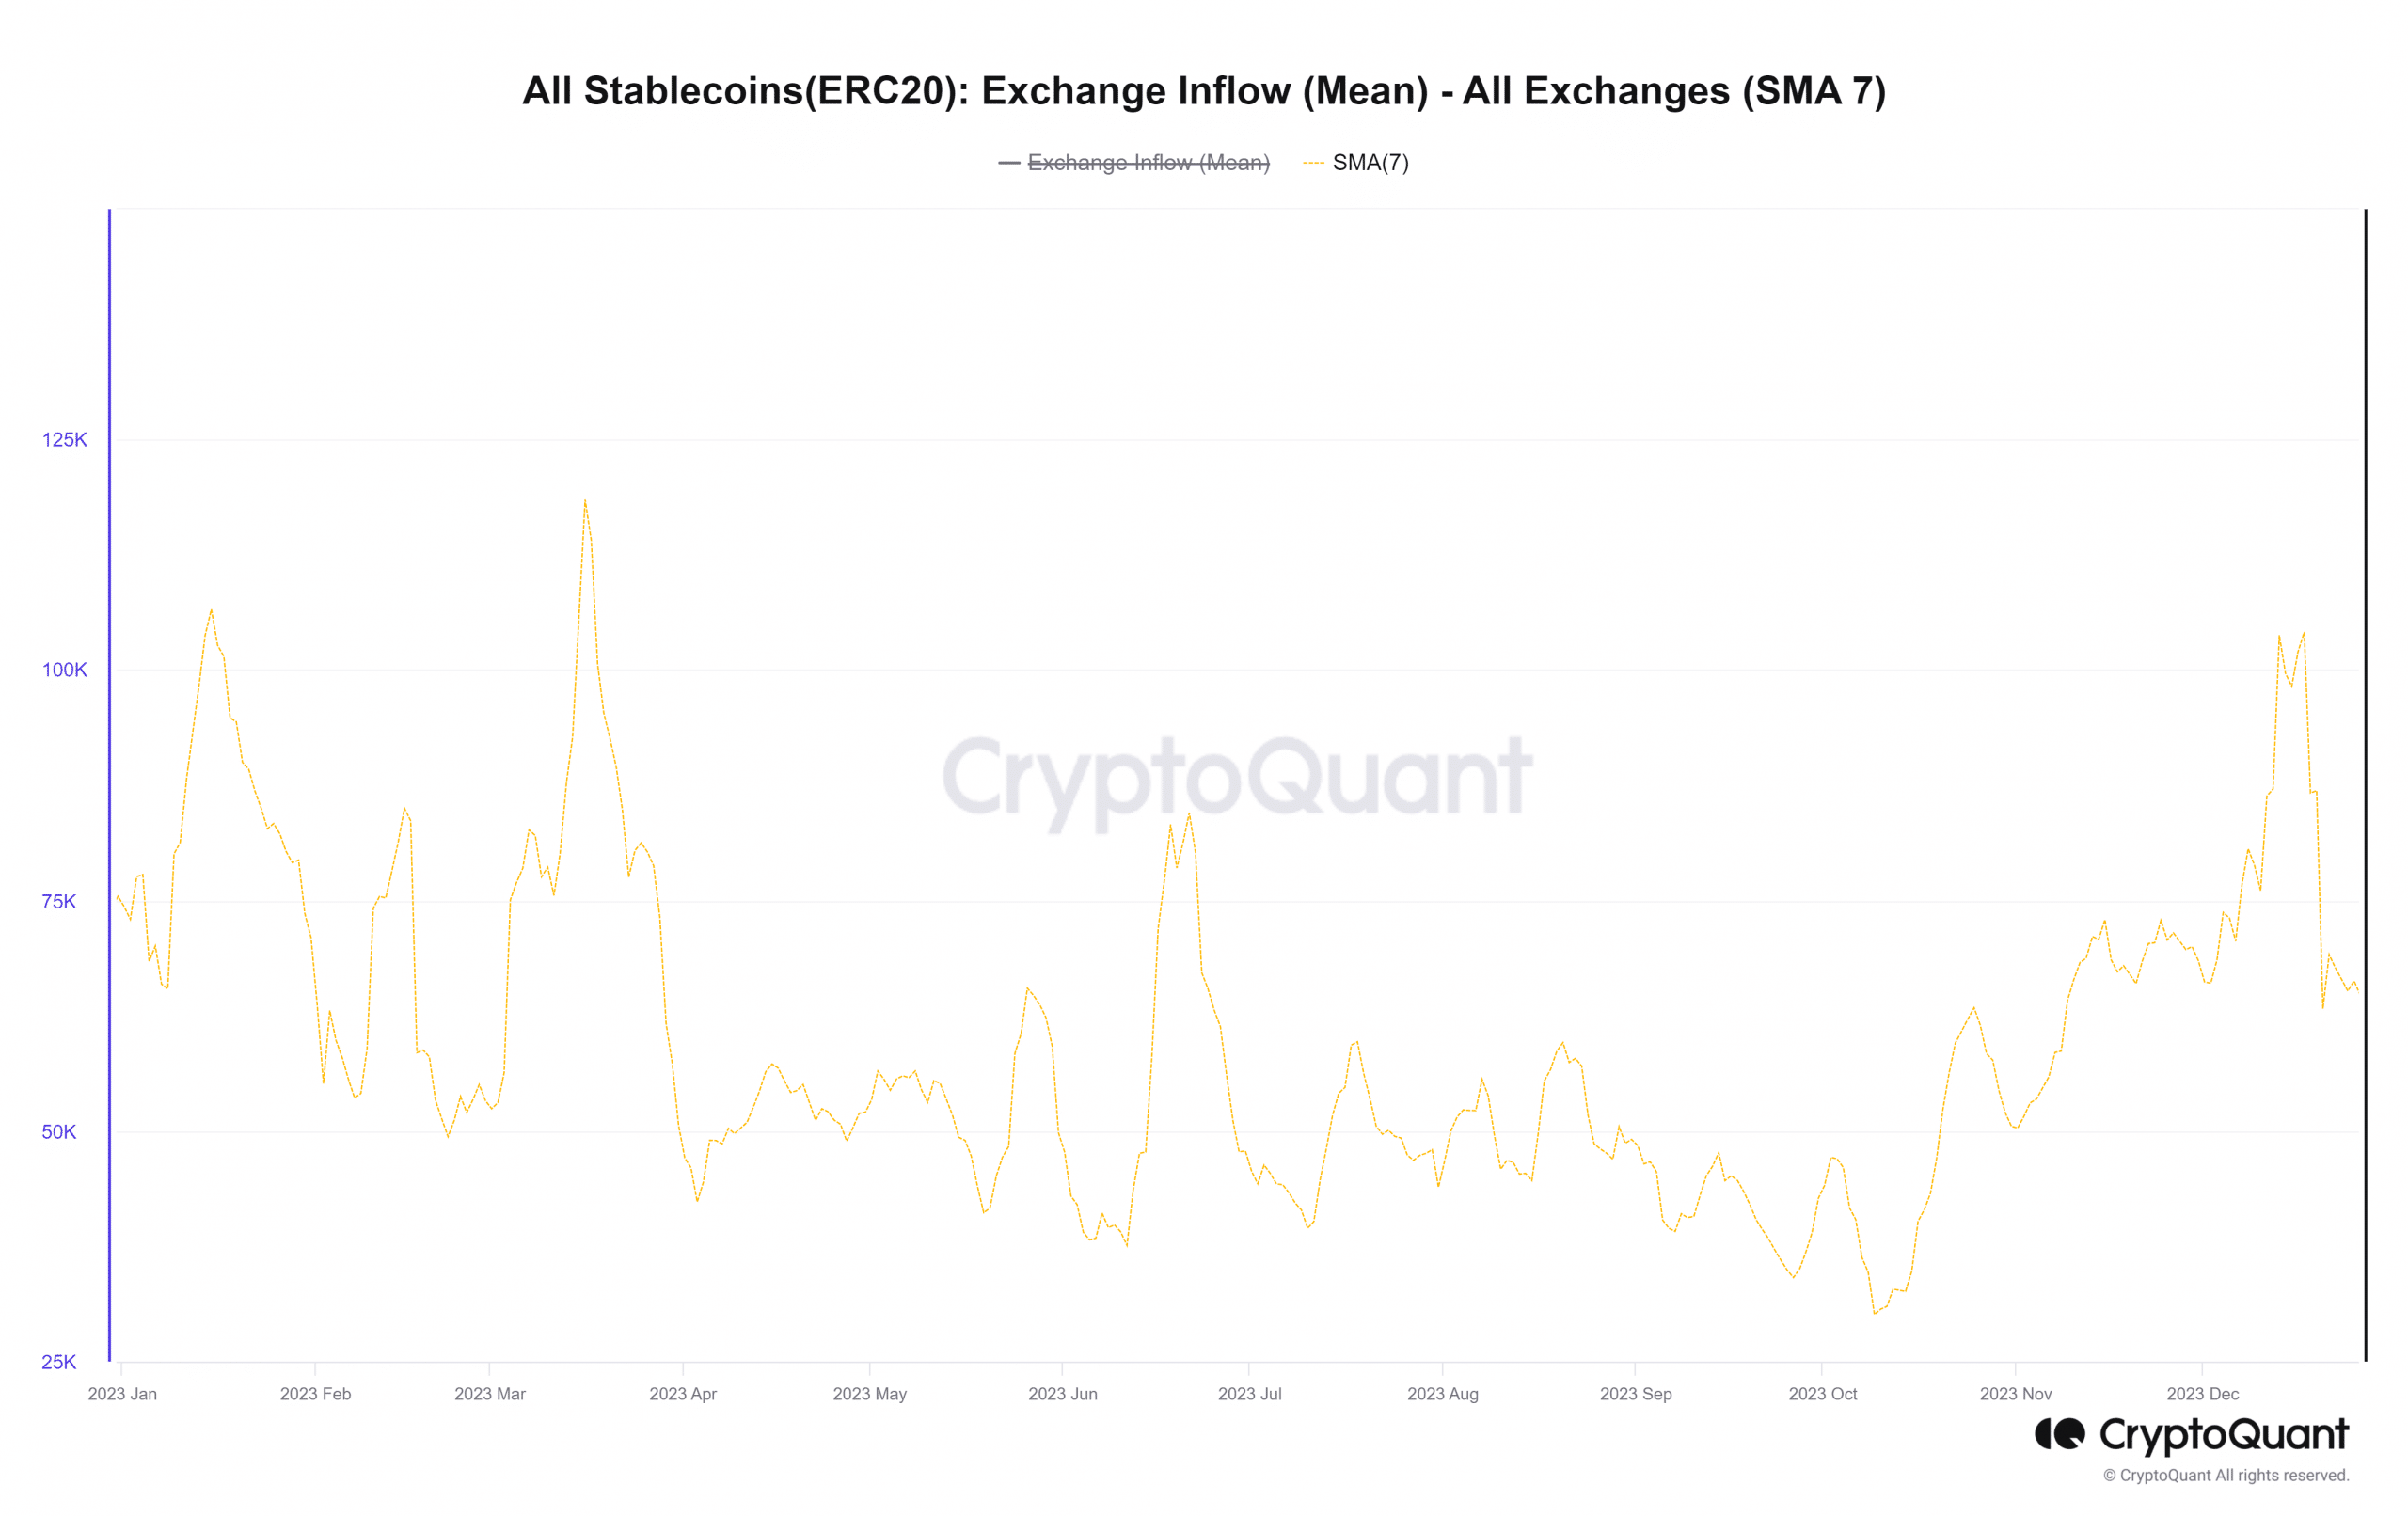
All the factors examined thus far point toward the bullishness of the market. In hindsight, this is obvious. However, the stablecoin exchange inflow saw a sharp drop after the 17th of December, while the other metrics continued to rise.
Does this imply the buying pressure has begun to dry up?
Technical analysis of stablecoin dominance could reveal more
Tether [USDT] is the most popular stablecoin, at least as far as market capitalization is concerned. According to CoinMarketCap, USDT’s 24-hour volume is nearly 12 times higher than the next stablecoin on the list, USD Coin [USDC].
Hence, the USDT dominance chart can serve well as a proxy for the performance of stablecoins, and what the coming months could have in store.
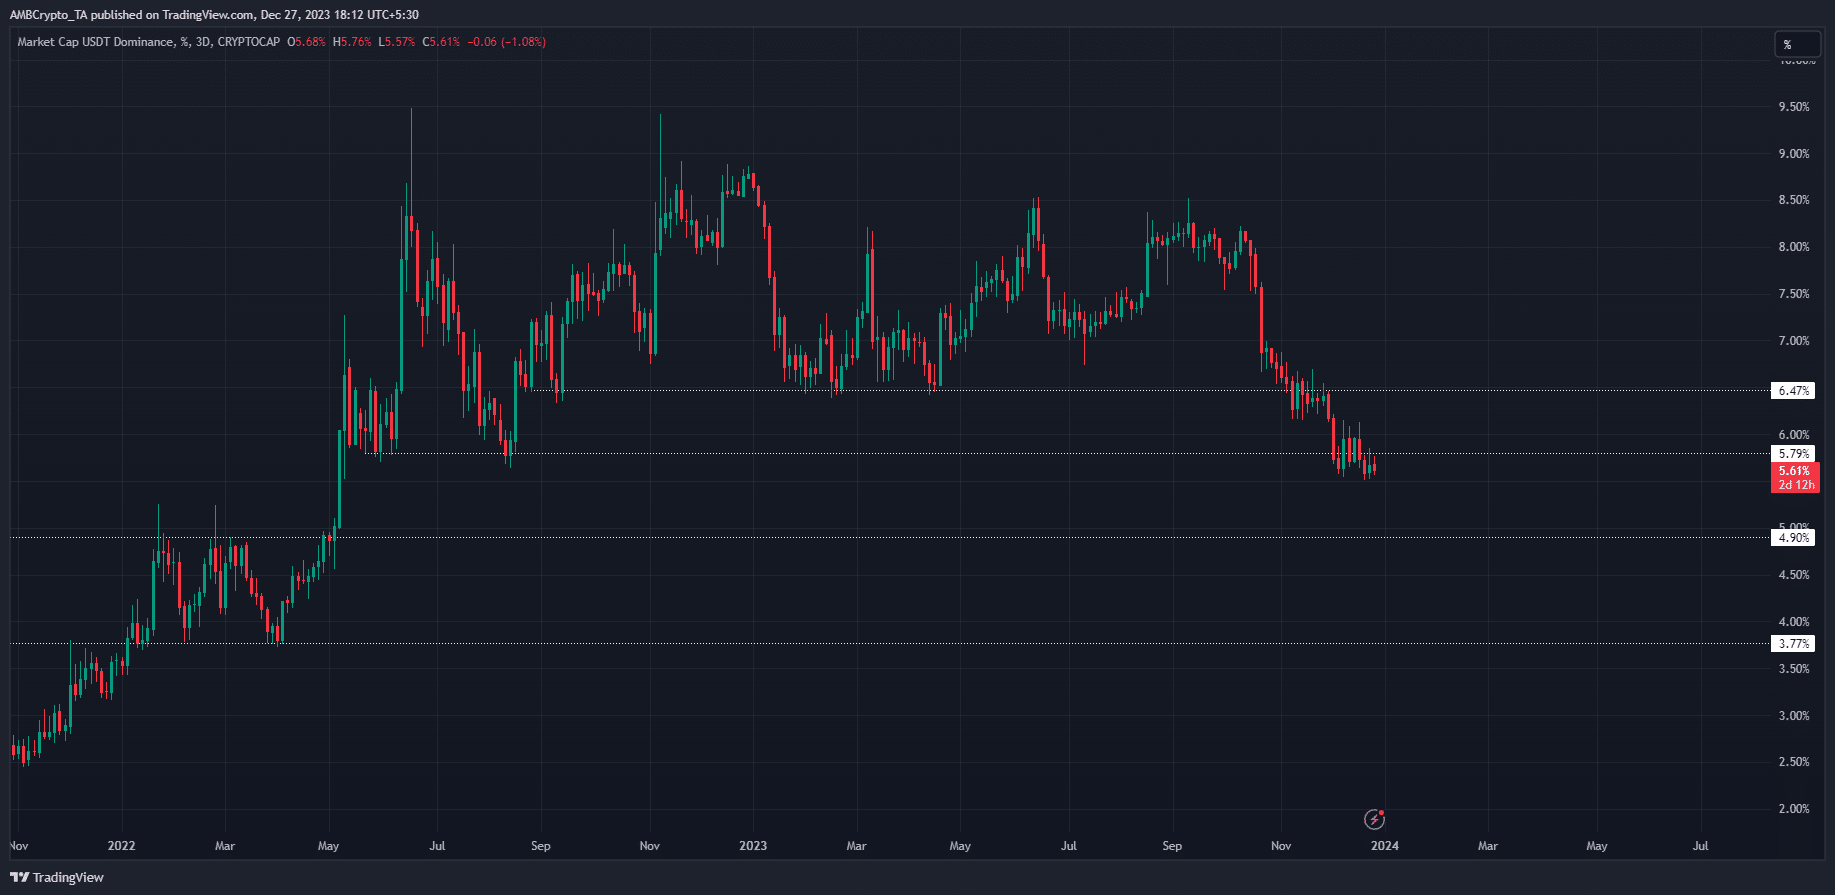
The USDT Dominance was in a strong downtrend. It has slid from standing at 8% on 16 October to 5.62% at press time. Moreover, the 5.79% level, which had been a support level almost 18 months ago, has been flipped to resistance.
To the south, the next long-term support sits at 4.9%. It is unclear just how much could be added to the crypto market capitalization. However, altcoin investors could plan to book profits should USDT’s dominance test the 4.9% level.
Read Bitcoin’s [BTC] Price Prediction 2023-24
This could take approximately 4–8 weeks to materialize.
Thereafter, Bitcoin’s reaction and market sentiment would be crucial in understanding where the altcoin market is headed next. A lower timeframe analysis of the dominance chart at that time could yield some relevant answers.


