Chiliz: Here’s how CHZ buyers can make the most of this bullish volatile break

Disclaimer: The findings of the following analysis are the sole opinions of the writer and should not be considered investment advice.
- Can the 20/50 EMA bullish crossover support Chiliz’s bullish efforts in the coming days?
- The altcoin saw a decline in daily active addresses but maintained a relatively high market cap dominance.
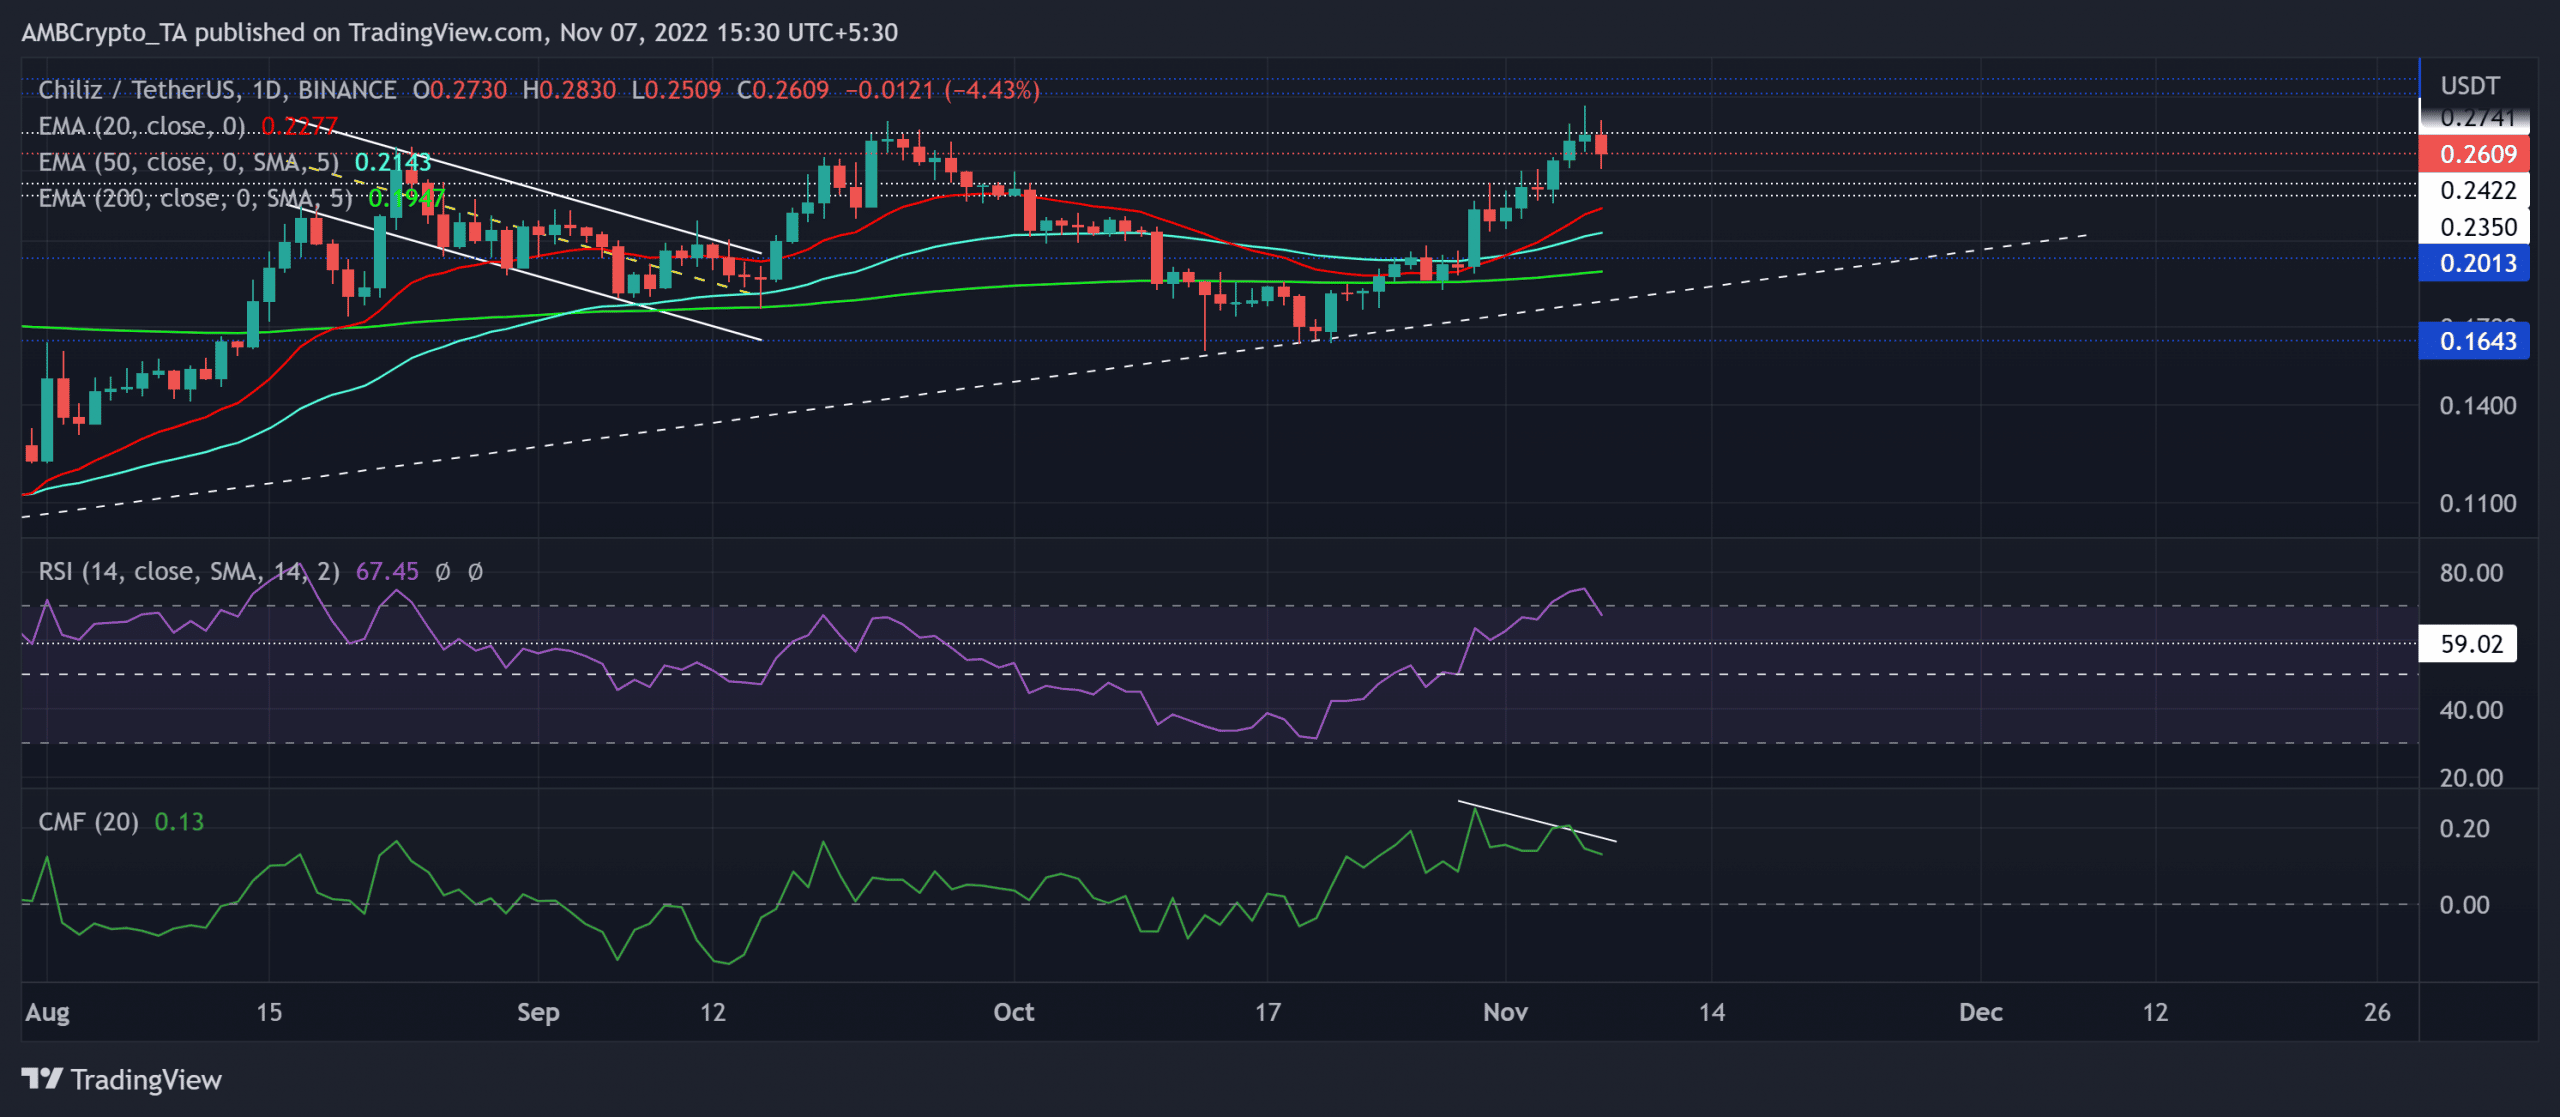
Chiliz’s [CHZ] bullish resurgence from its multi-monthly trendline support (white, dashed) firmly coordinated a bullish rebuttal rally. The resultant gains set the stage for the bulls to maintain a position above the 20/50/200 moving averages.
Here’s AMBCrypto’s price prediction for Chiliz [CHZ] for 2023-2024
With the north-looking 20 EMA (red) undertaking a bullish crossover with the 50 EMA (cyan), buyers could strive to maintain their advantage in the coming weeks. Owing to a relatively high correlation with Bitcoin [BTC], buyers should factor in the broader market sentiment to gauge CHZ’s ability to continue growing.
At press time, CHZ was trading at $0.2609, down by 2.04% in the last 24 hours.
Can the buyers find reliable rebounding grounds?
The bulls found renewed pressure after a morning star candlestick setup at the five-month trendline support. This recovery from the $0.16 level entailed a whopping 63% ROI from 21 October to 6 November.
The recovery reversed from its long-term resistance mark in the $0.274 zone. Should the current candlestick close as red, CHZ could witness an Evening Star candlestick pattern in the daily timeframe.
A convincing rebound from the $0.23-$0.24 range can position the altcoin for an upside in the coming days. An immediate or eventual bullish comeback can witness the first major resistance barrier in the $0.27 zone. A close above this mark can open doorways toward the $0.3-$0.31 range.
But a reversal below the $0.23 support level could hamper the bullish progress. In these circumstances, the 20/50 EMA could offer a recovery potential.
The Relative Strength Index (RSI) saw a reversal from its overbought region as the altcoin eyed to test the 59-mark support. Any rebound from this support could continue aiding CHZ’s bullish endeavors.
Furthermore, the Chaikin Money Flow’s (CMF) lower peaks over the past week confirmed a bearish divergence with the price action. This reading depicted the possibility of ease in buying pressure.
A decline in daily active addresses
An analysis of data from Santiment revealed a sharp plunge in the number of daily active addresses over the past day. Empirically, the price action managed to show a relatively high sensitivity toward this metric.
Should the price action follow, CHZ could see a near-term downside before picking itself up.
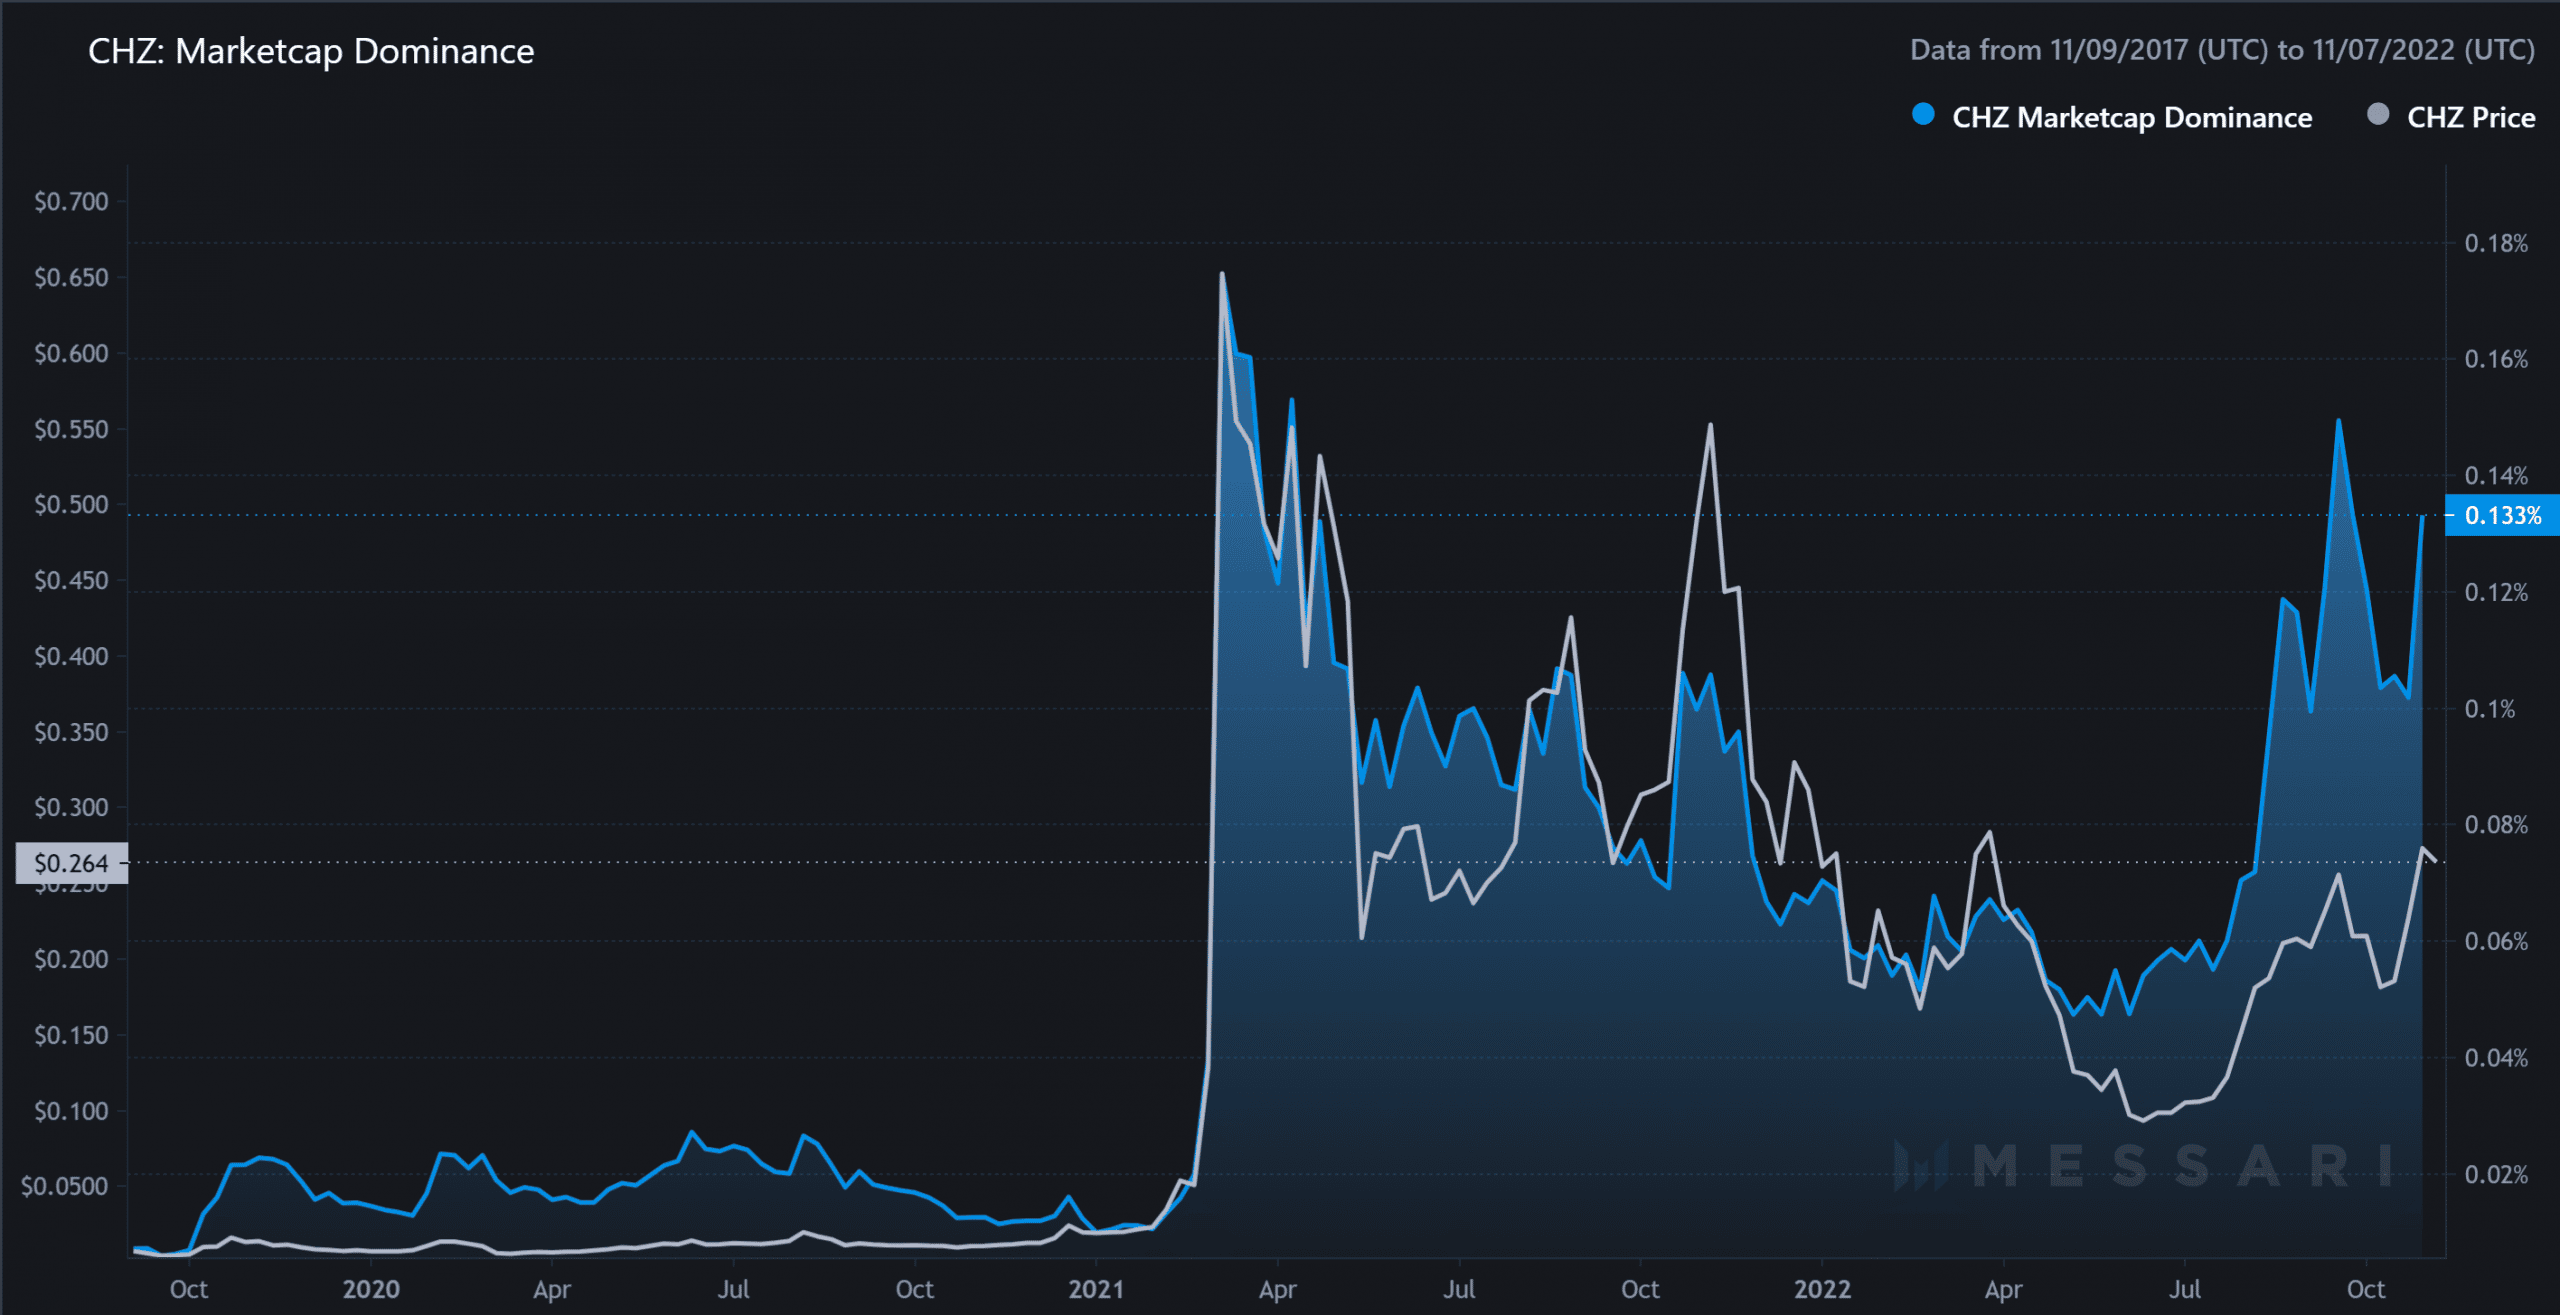
Nonetheless, CHZ’s market cap dominance saw a solid spike in the past few months as it reached its ATH levels in September. This reading entailed that CHZ performed quite well relative to its peer altcoins over the past few months.
The potential targets would remain the same as above. Finally, traders/investors should keep a close watch on Bitcoin’s movement and its effects on the wider market to make a profitable move.


