Cosmos [ATOM]: An optimal buying strategy to sail through its bull run

Disclaimer: The findings of the following analysis are the sole opinions of the writer and should not be considered investment advice.
Since swopping to its 17-month low on 18 June, Cosmos (ATOM) bulls have been on a roll as they kept finding fresher highs over the last three months.
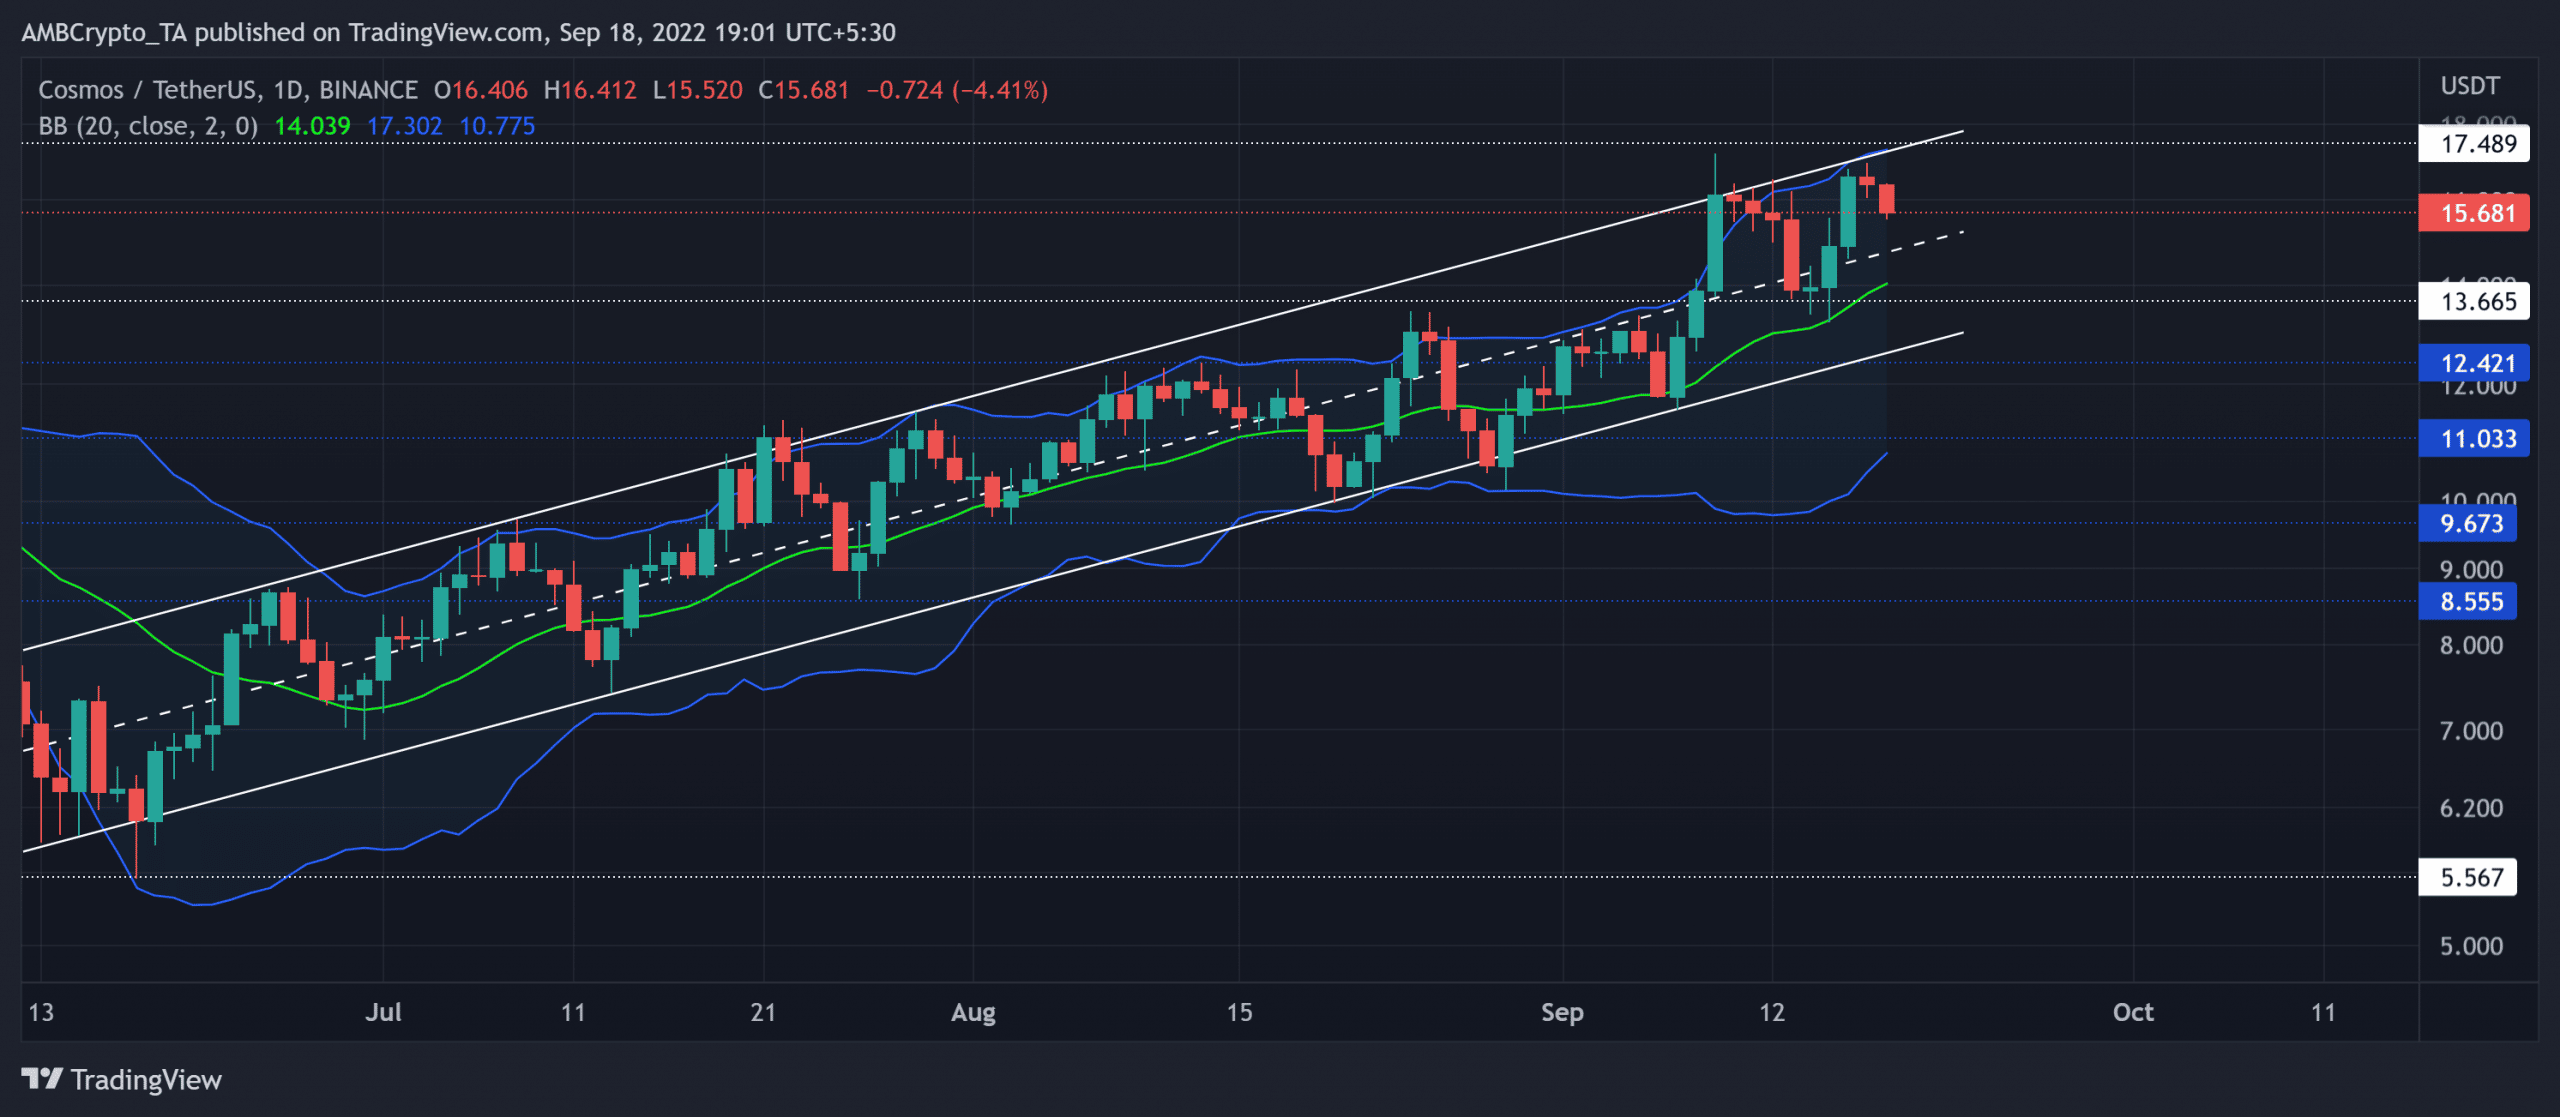
This bullish break transposed into a robust ascending channel on the daily timeframe. With current price movements approaching the upper band of the Bollinger Bands (BB), ATOM could see a near-term decline before a bullish rebound.
At press time, the alt was trading at $15.681, down by 4.59% in the last 24 hours.
ATOM Daily Chart
Despite the prevailing ‘fear’ sentiment in the crypto-market for the last few months, ATOM defied the market-wide inclinations to register consistent gains on its chart.
The buying spree from its multi-month low in June set a solid foundation for an ascending channel rally. This hike resulted in nearly 182% returns until press time.
The bull run has positioned ATOM above the basis line of the BB for the most part. Over the last three weeks, the basis line has provided dependable rebounding support. On the other side, the upper trendline of the up-channel has coincided with the upper band of the BB to constrict the buying efforts.
A plausible close toward the basis line could inflict a near-term bounce-back on the chart. In these circumstances, ATOM could see recovery towards the $17-$17.4 range. Contrarily, a sustained decline below the basis line would hint at a retest of the lower trendline of the up-channel.
Rationale
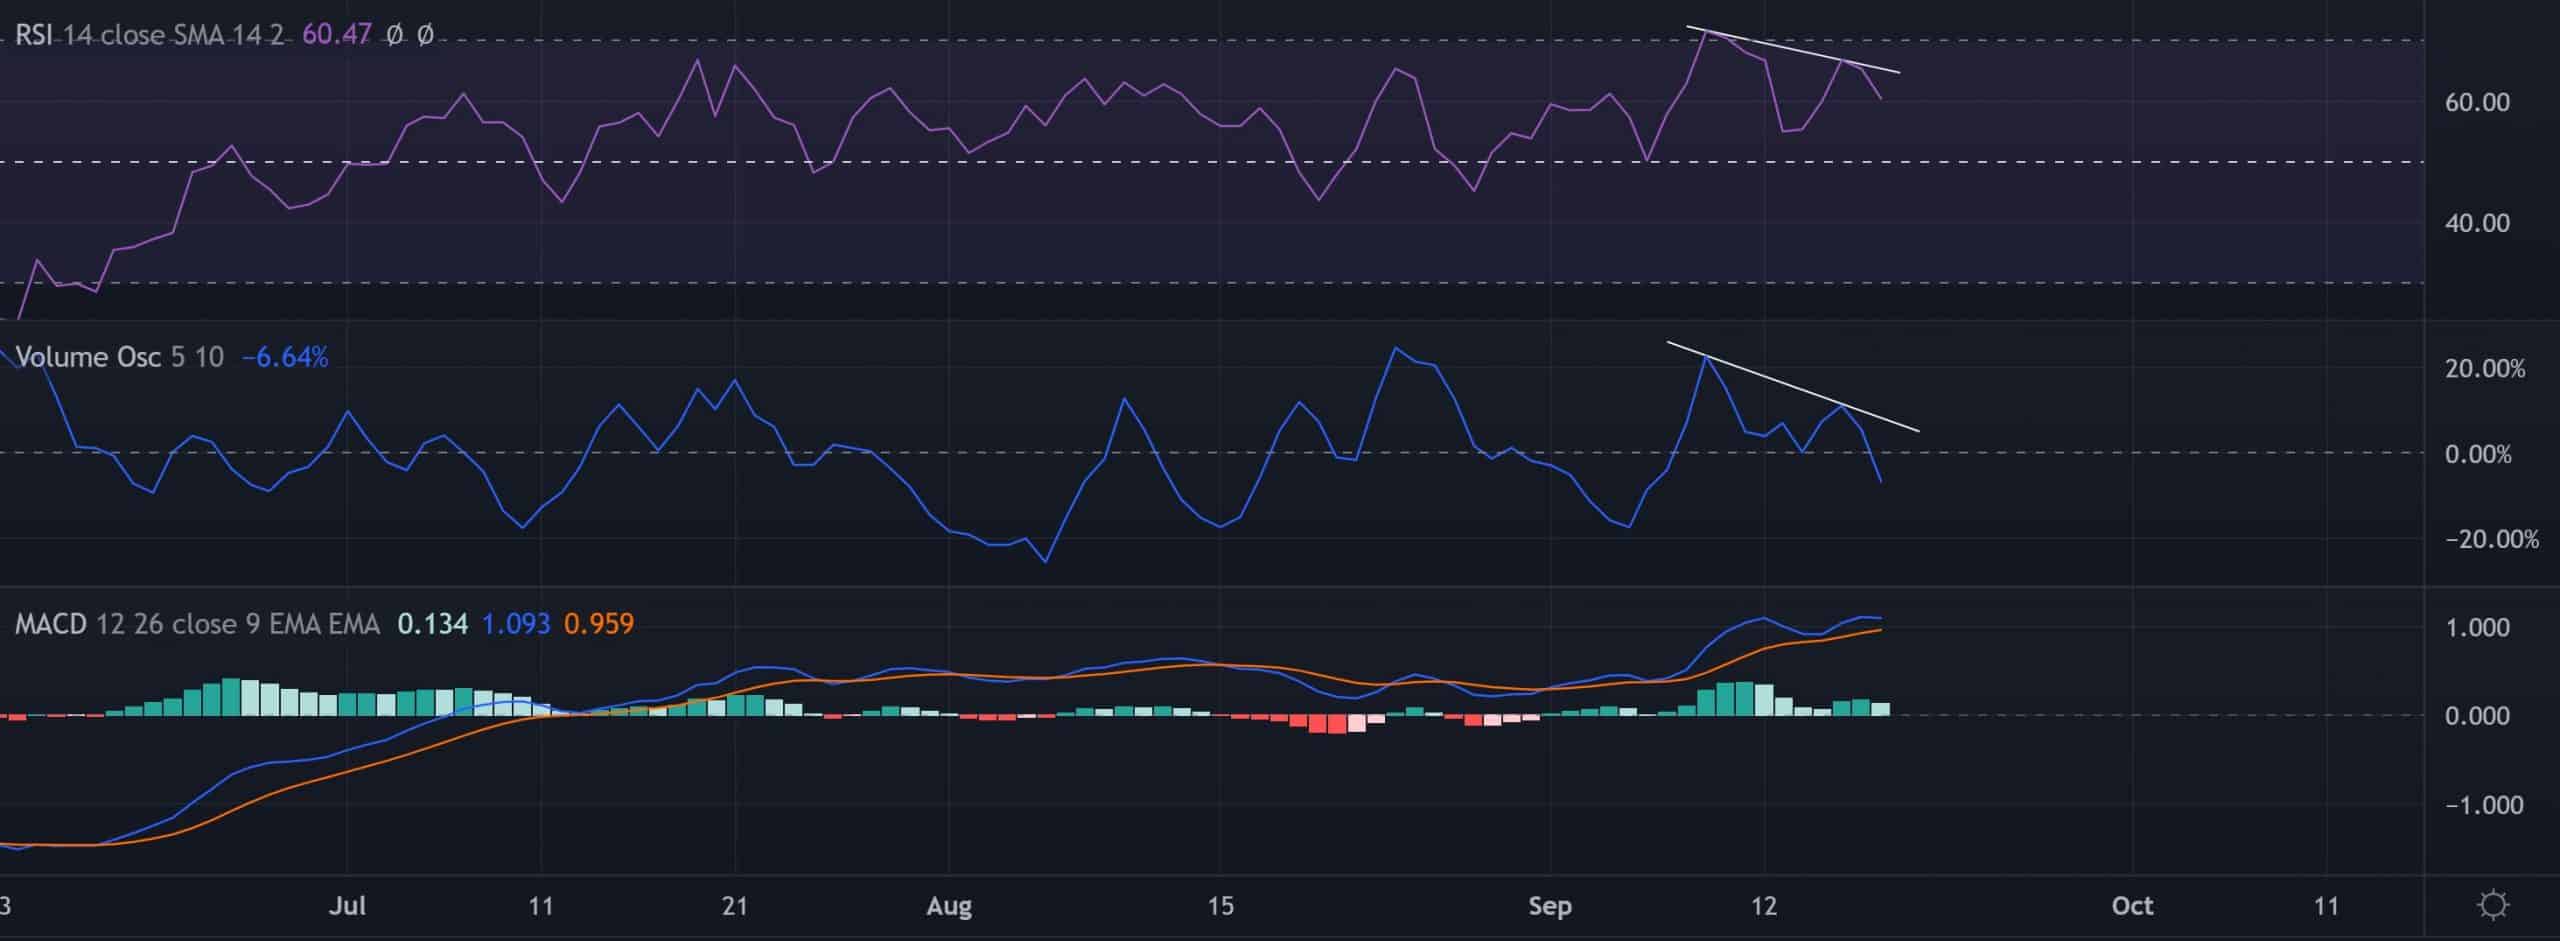
The bullish Relative Strength Index (RSI) retraced from the overbought level as it marked lower peaks to mark a slight bearish divergence. This decline reaffirmed the strength of the sellers near the $17-resistance.
Similarly, the Volume Oscillator (VO) witnessed a downtrend during the coin’s recent gains to depict a slight buying weakness in the market. Nonetheless, the MACD lines continued to depict a strong buying edge in this timeframe.
Conclusion
Considering the intersection between the basis line and the horizontal support in the $13.6-zone, ATOM unveiled rebounding tendencies. A fall below the basis line would invalidate these bullish inclinations. The targets would remain the same as discussed.
At last, market sentiment analysis to complement these technical factors is vital for making a profitable move.


