Cosmos transitioned away from a descending channel and tested $19.9-resistance at the time of writing. Bitcoin SV awaited stronger signals to rise above the upper barrier of $224.1, while Synthetix was projected to move sideways from $15.8-support.
Cosmos [ATOM]
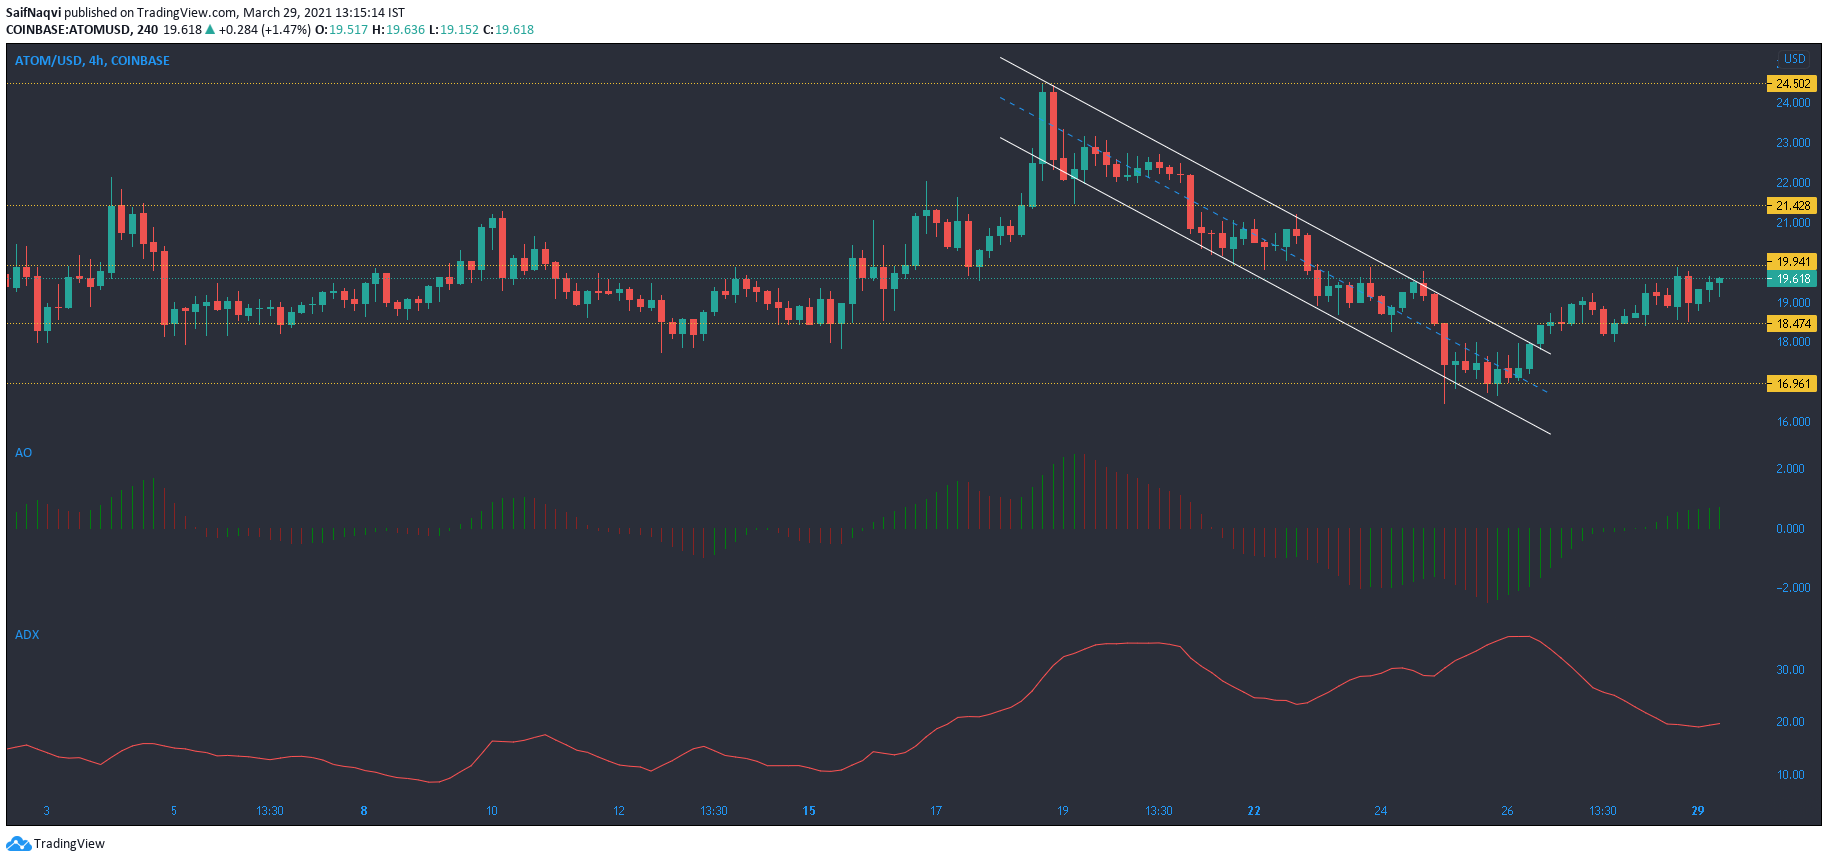
Source: ATOM/USD, TradingView
Losses in the last two weeks amounted to nearly 30% as Cosmos moved south after a sell-off from the $24.5-mark. A descending channel even appeared on the 4-hour timeframe, and losses were finally cushioned at $16.96-support. This led to a minor rally as the cryptocurrency regained the channel $19.94-$18.47, an area that has typically seen some buying activity on previous occasions.
According to the Awesome Oscillator, momentum was strong and was on the bullish side as the green bars rose above the half-line. A pickup above 25 in the ADX could see the price break north of its overhead resistance and move towards the next ceiling at $21.4. A hike in the 24-hour trading volumes could signal the breakout and the same must be observed over the coming sessions.
Bitcoin SV [BSV]
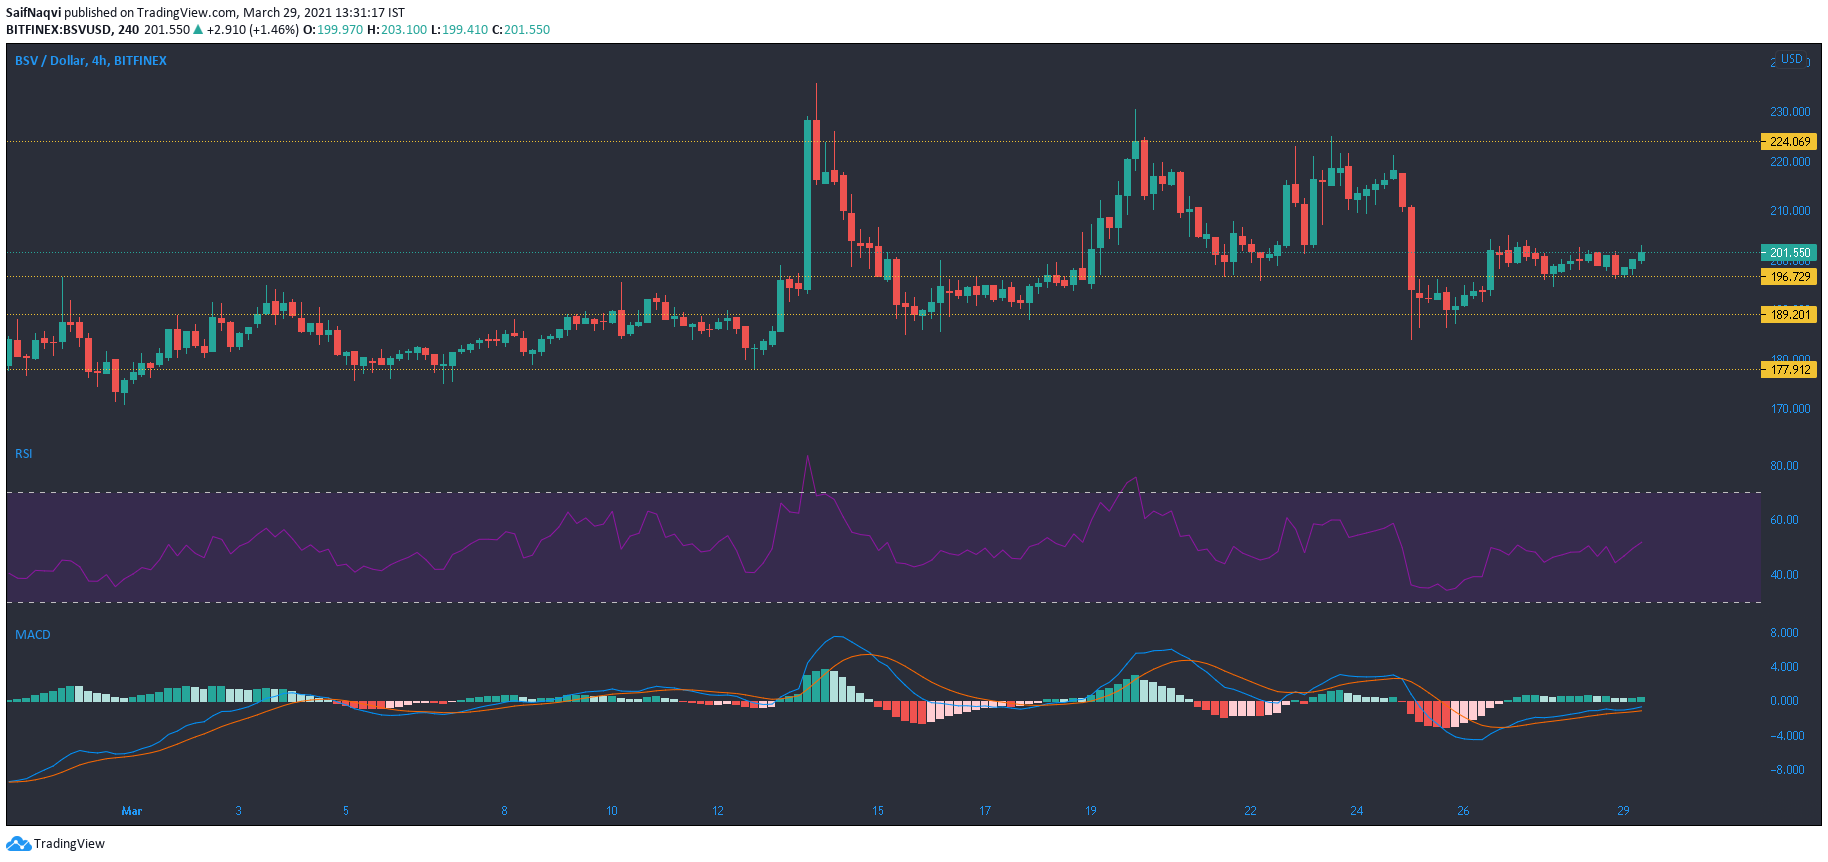
Source: BSV/USD, TradingView
Choppy movement over the past couple of weeks saw Bitcoin SV largely oscillate between $224.1 and $189.2. At the time of writing, the price hovered above $196.7-support and showed bullish movement on the 4-hour chart.
On the other hand, the indicators suggested that stronger cues were needed to back a rise above the upper ceiling of $224.1. The RSI was in a neutral territory even though the index pointed north from 50. While the MACD line maintained its movement above the Signal line, the index was below equilibrium which was not exactly a show of bullish strength.
Synthetix [SNX]
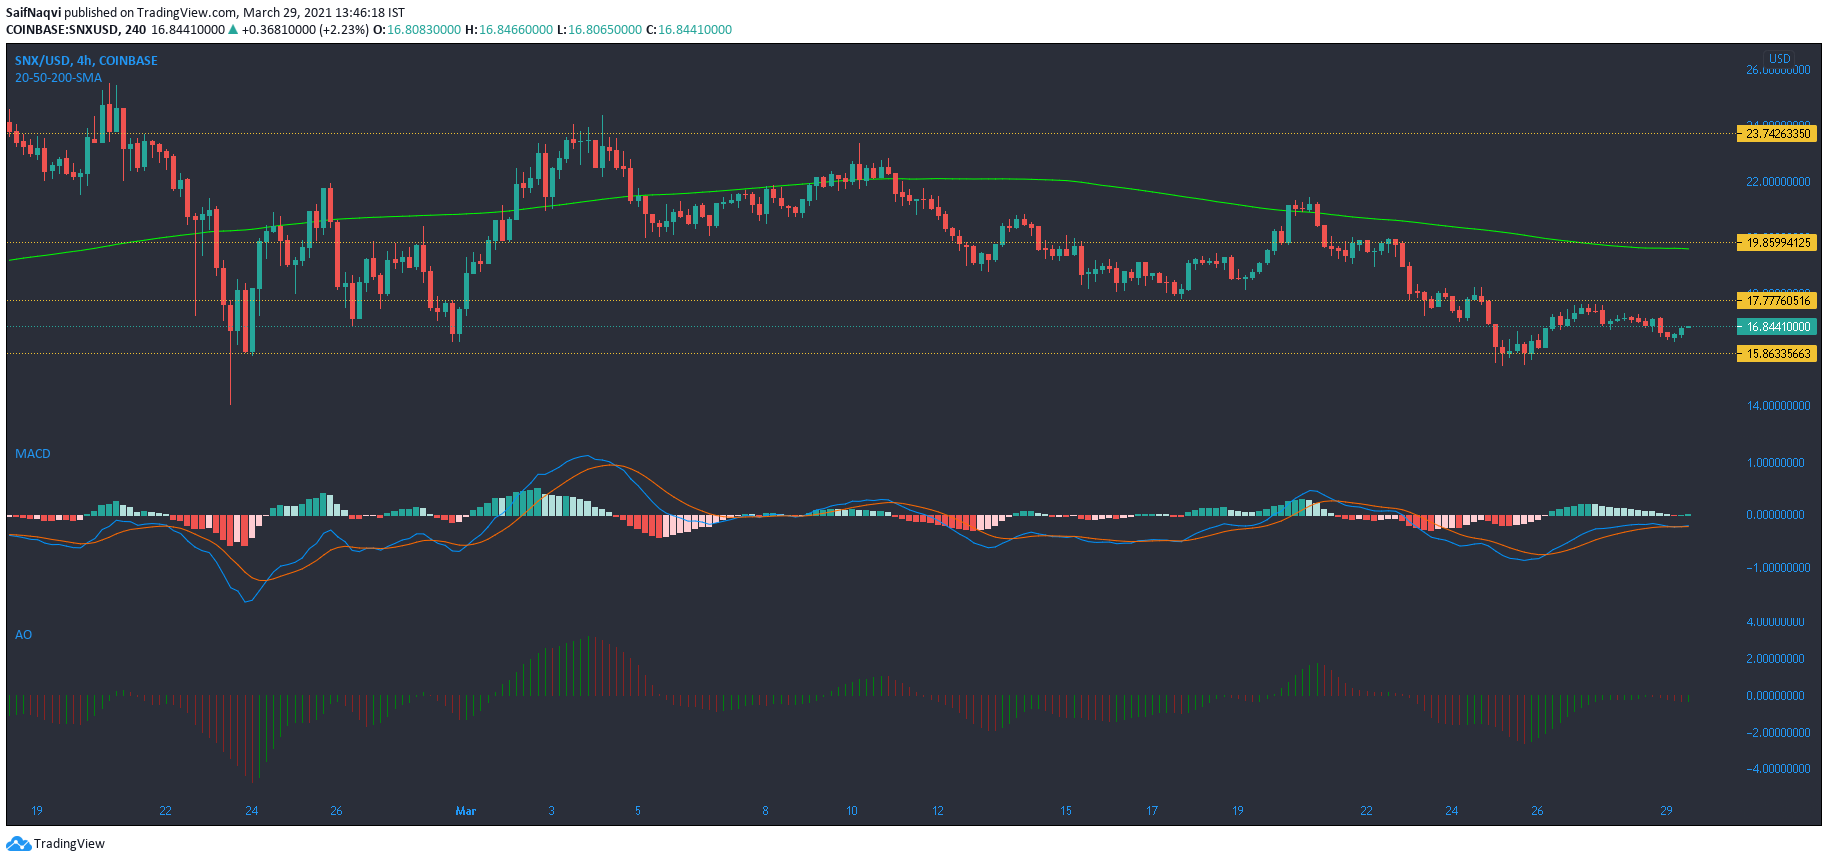
Source: SNX/USD, TradingView
While Synthetix saw positive movement during the first few days of March, the price fell steadily after reaching an upper ceiling of $23.7. The lowest point reached during the month was close to $15.8-support, a level that was seen during the pullback in late-February. With the candlesticks moving well below their 200-SMA (green), gains were expected to be subdued over the coming sessions as well. However, the current price level presented an opportunity for traders to buy SNX at a discounted price.
The indicators showed a degree of equilibrium in the market and consolidation looked likely in the short-term. The Awesome Oscillator was bullish-neutral, while the MACD line moved along the Signal line.