Cosmos: How ATOM traders can capitalize on this pattern’s breakout

Disclaimer: The findings of the following analysis are the sole opinions of the writer and should not be considered investment advice.
Since attaining its ATH early this year, Cosmos (ATOM) has exhibited a persistent bearish tilt. The break below the $20-mark transposed into a steep decline. Thus, pulling ATOM toward its multi-monthly lows in the $8-$9 range.
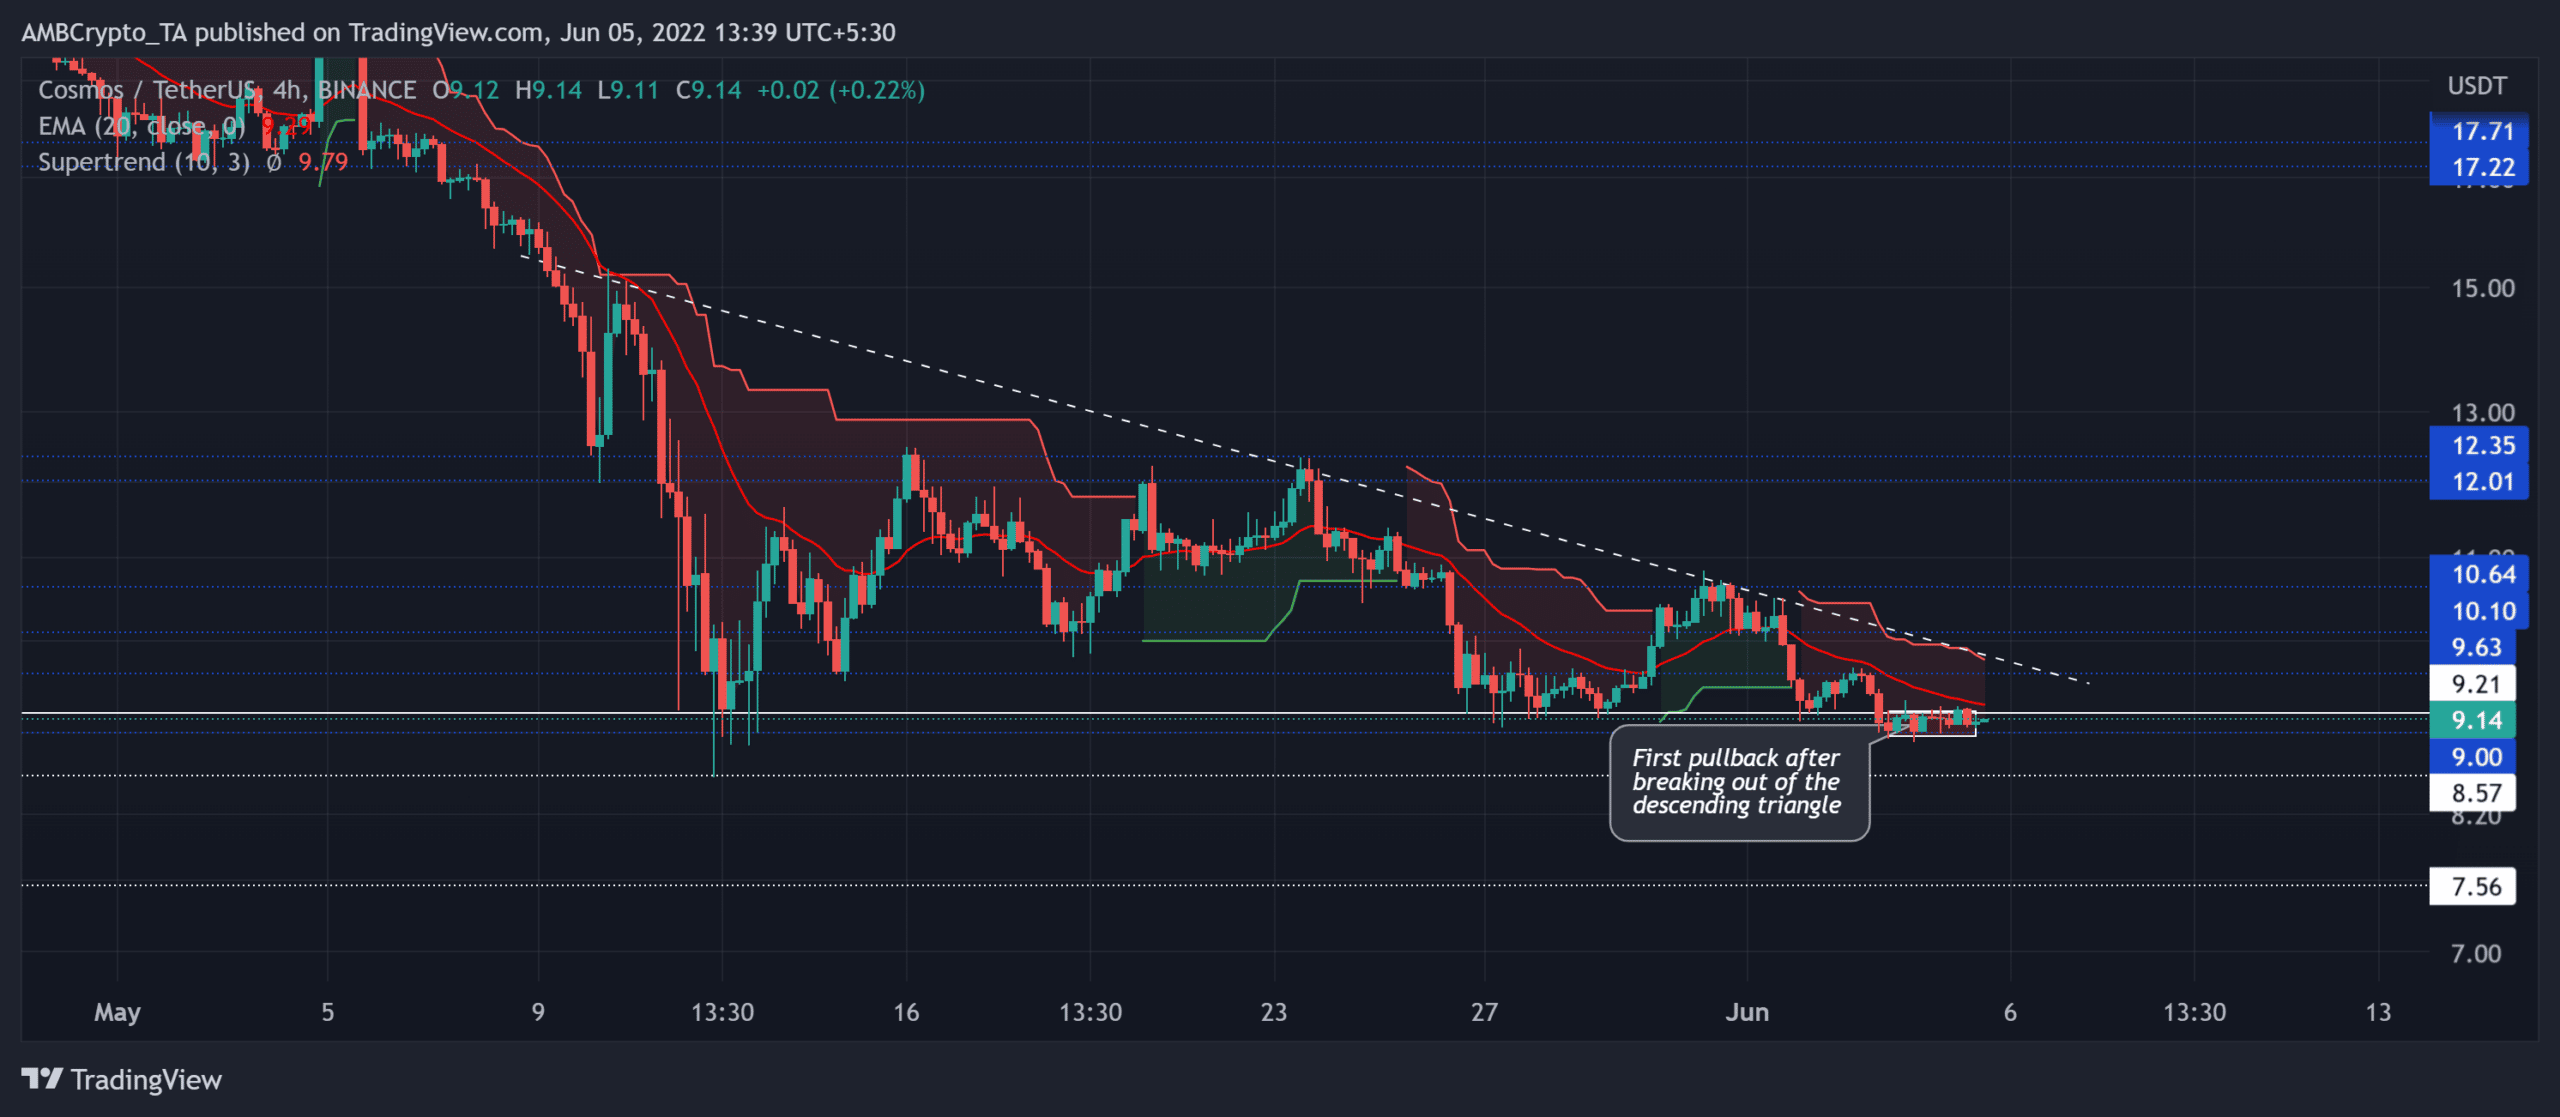
With the current price movements confirming a descending triangle, ATOM’s near-term future seemed rather wobbly. At press time, the alt traded at $9.14.
ATOM 4-hour Chart
For over a month, the broader market swayed the ‘extreme fear’ sentiment. While it refrains from substantial improvements, HODLers have struggled to hold their long-term grounds.
The recent sell-offs pulled ATOM toward its 10-month low on 12 May after a 57% weekly decline (5-12 May). Since then, the bullish efforts to hold $9.2-support saw a push back by the bearish peaks. Thus, forming a descending triangle on the four-hour timeframe.
During this bearish setup, the volumes were constantly receding as the price approached the tighter part of the triangle. This volume trend alongside a break below the $9.2-level indicated a relatively effective descending triangle.
Also, with the price action being near its 20 EMA (red), the chances of volatility are high in the coming sessions. A close below the $9-support would provide shorting opportunities by confirming the heightened selling control.
In this case, the take-profit levels will stand in the $7.5-$8.5 range for the short-sellers. However, any throwbacks above the $9.2-level could impair the bearish performance.
Rationale
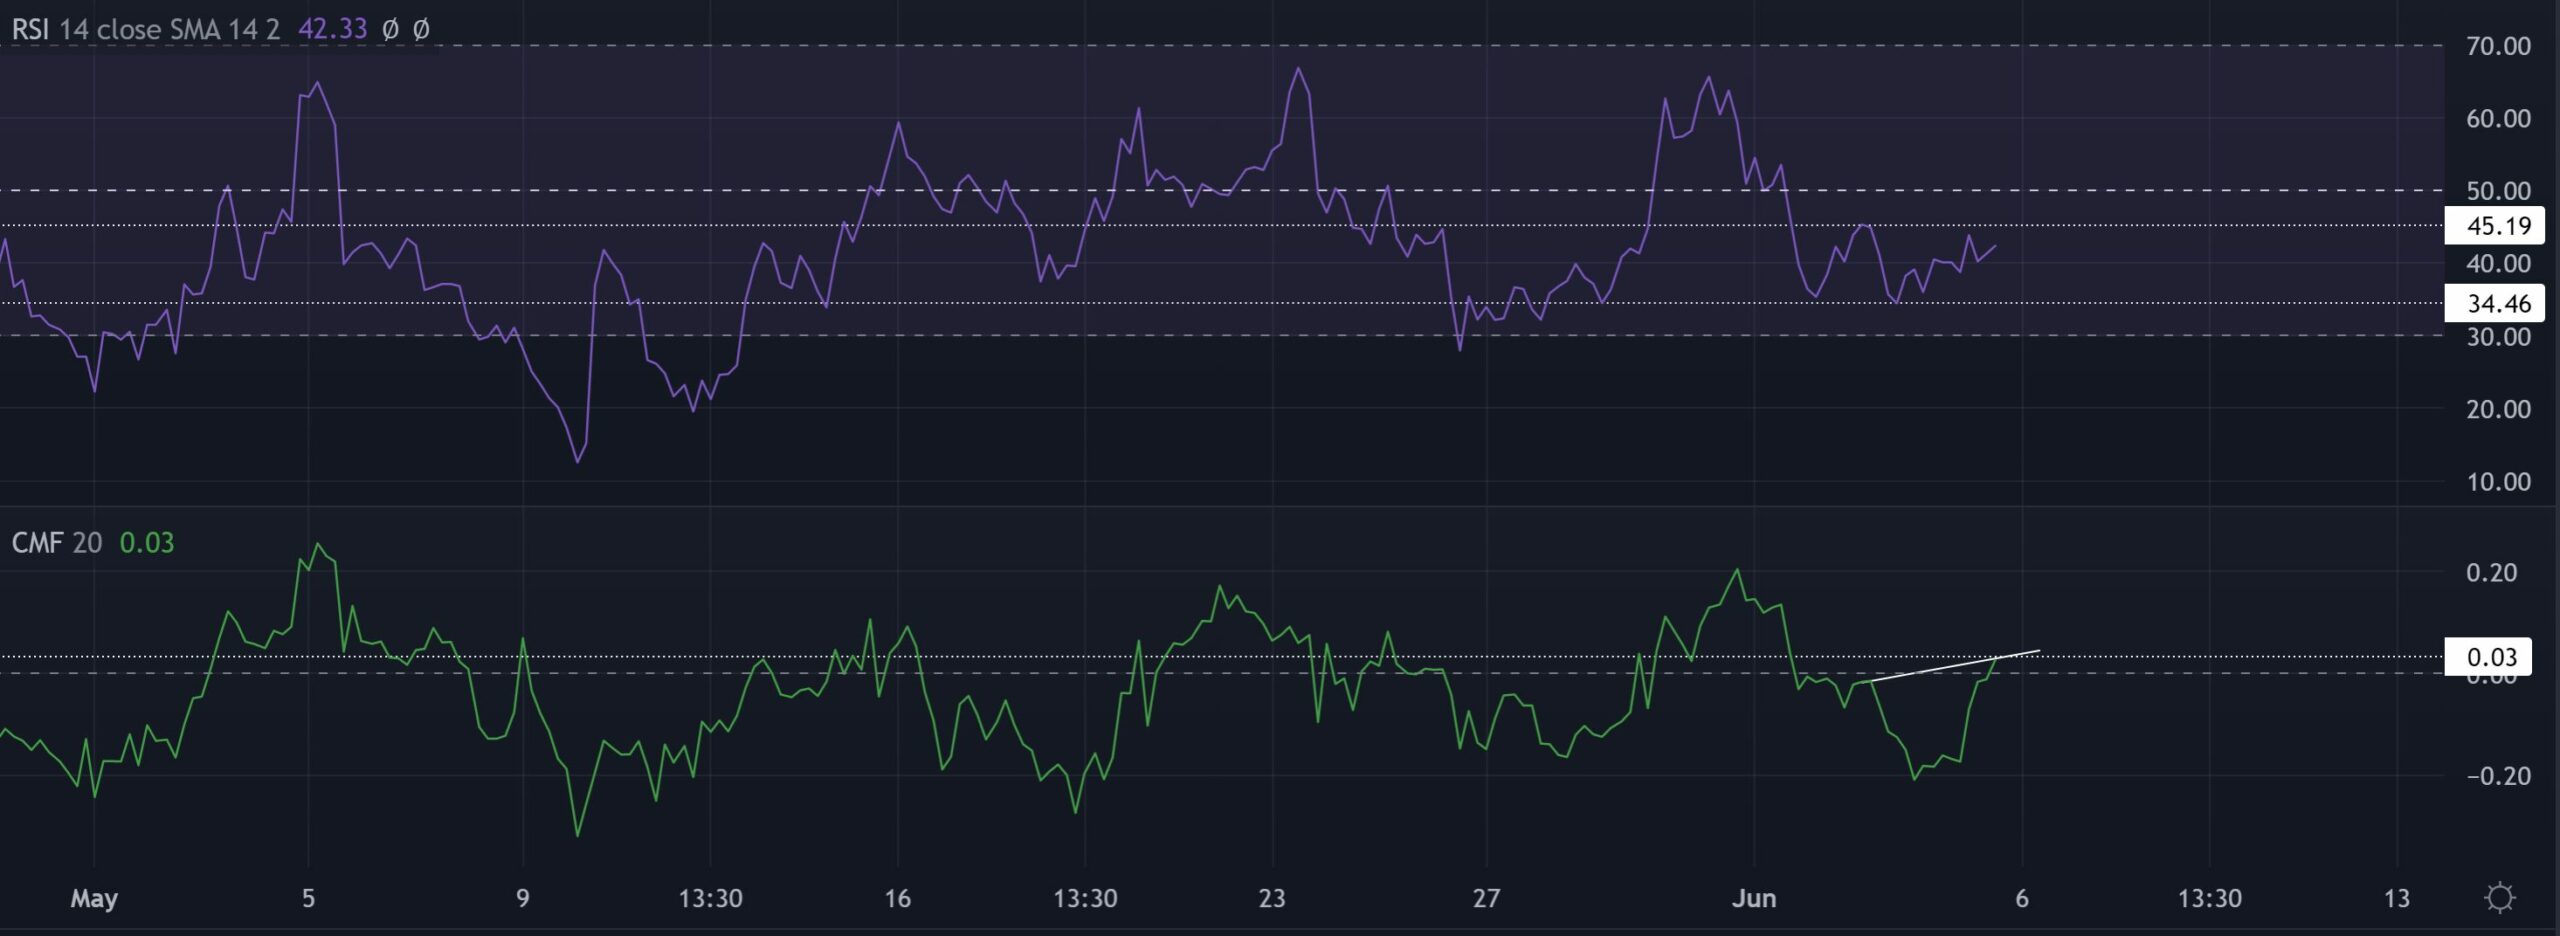
The bearish RSI revived from the 34-level as it endeavored to test the 45-resistance. A close beyond this resistance would reignite the chances of any recovery on the chart.
While the CMF saw a break above the zero-mark, it registered a bearish divergence on its peaks with the price. Any reversal from the trendline resistance below the equilibrium would reaffirm the bearish control.
Conclusion
Looking at the confluence between the descending triangle setup and the south-looking Supertrend in the red zone, ATOM could see a setback on its charts.
A fall below the $9-support would fuel up shorting opportunities with a take-profit as suggested above.
At last, market sentiment analysis to complement these technical factors is vital for making a profitable move.