Cosmos, MANA, SAND Price Analysis: 19 April

After a marginal 24-hour surge in the crypto fear and greed index, the global market cap registered an over 4.5% improvement over the last day.
As a result, Cosmos, MANA, and SAND’s near-term technicals displayed heightened buying influence but still flashed neutrality from an objective standpoint. The recent gains need to be backed by ramping up the volumes for the buyers to sustain their edge.
Cosmos (ATOM)
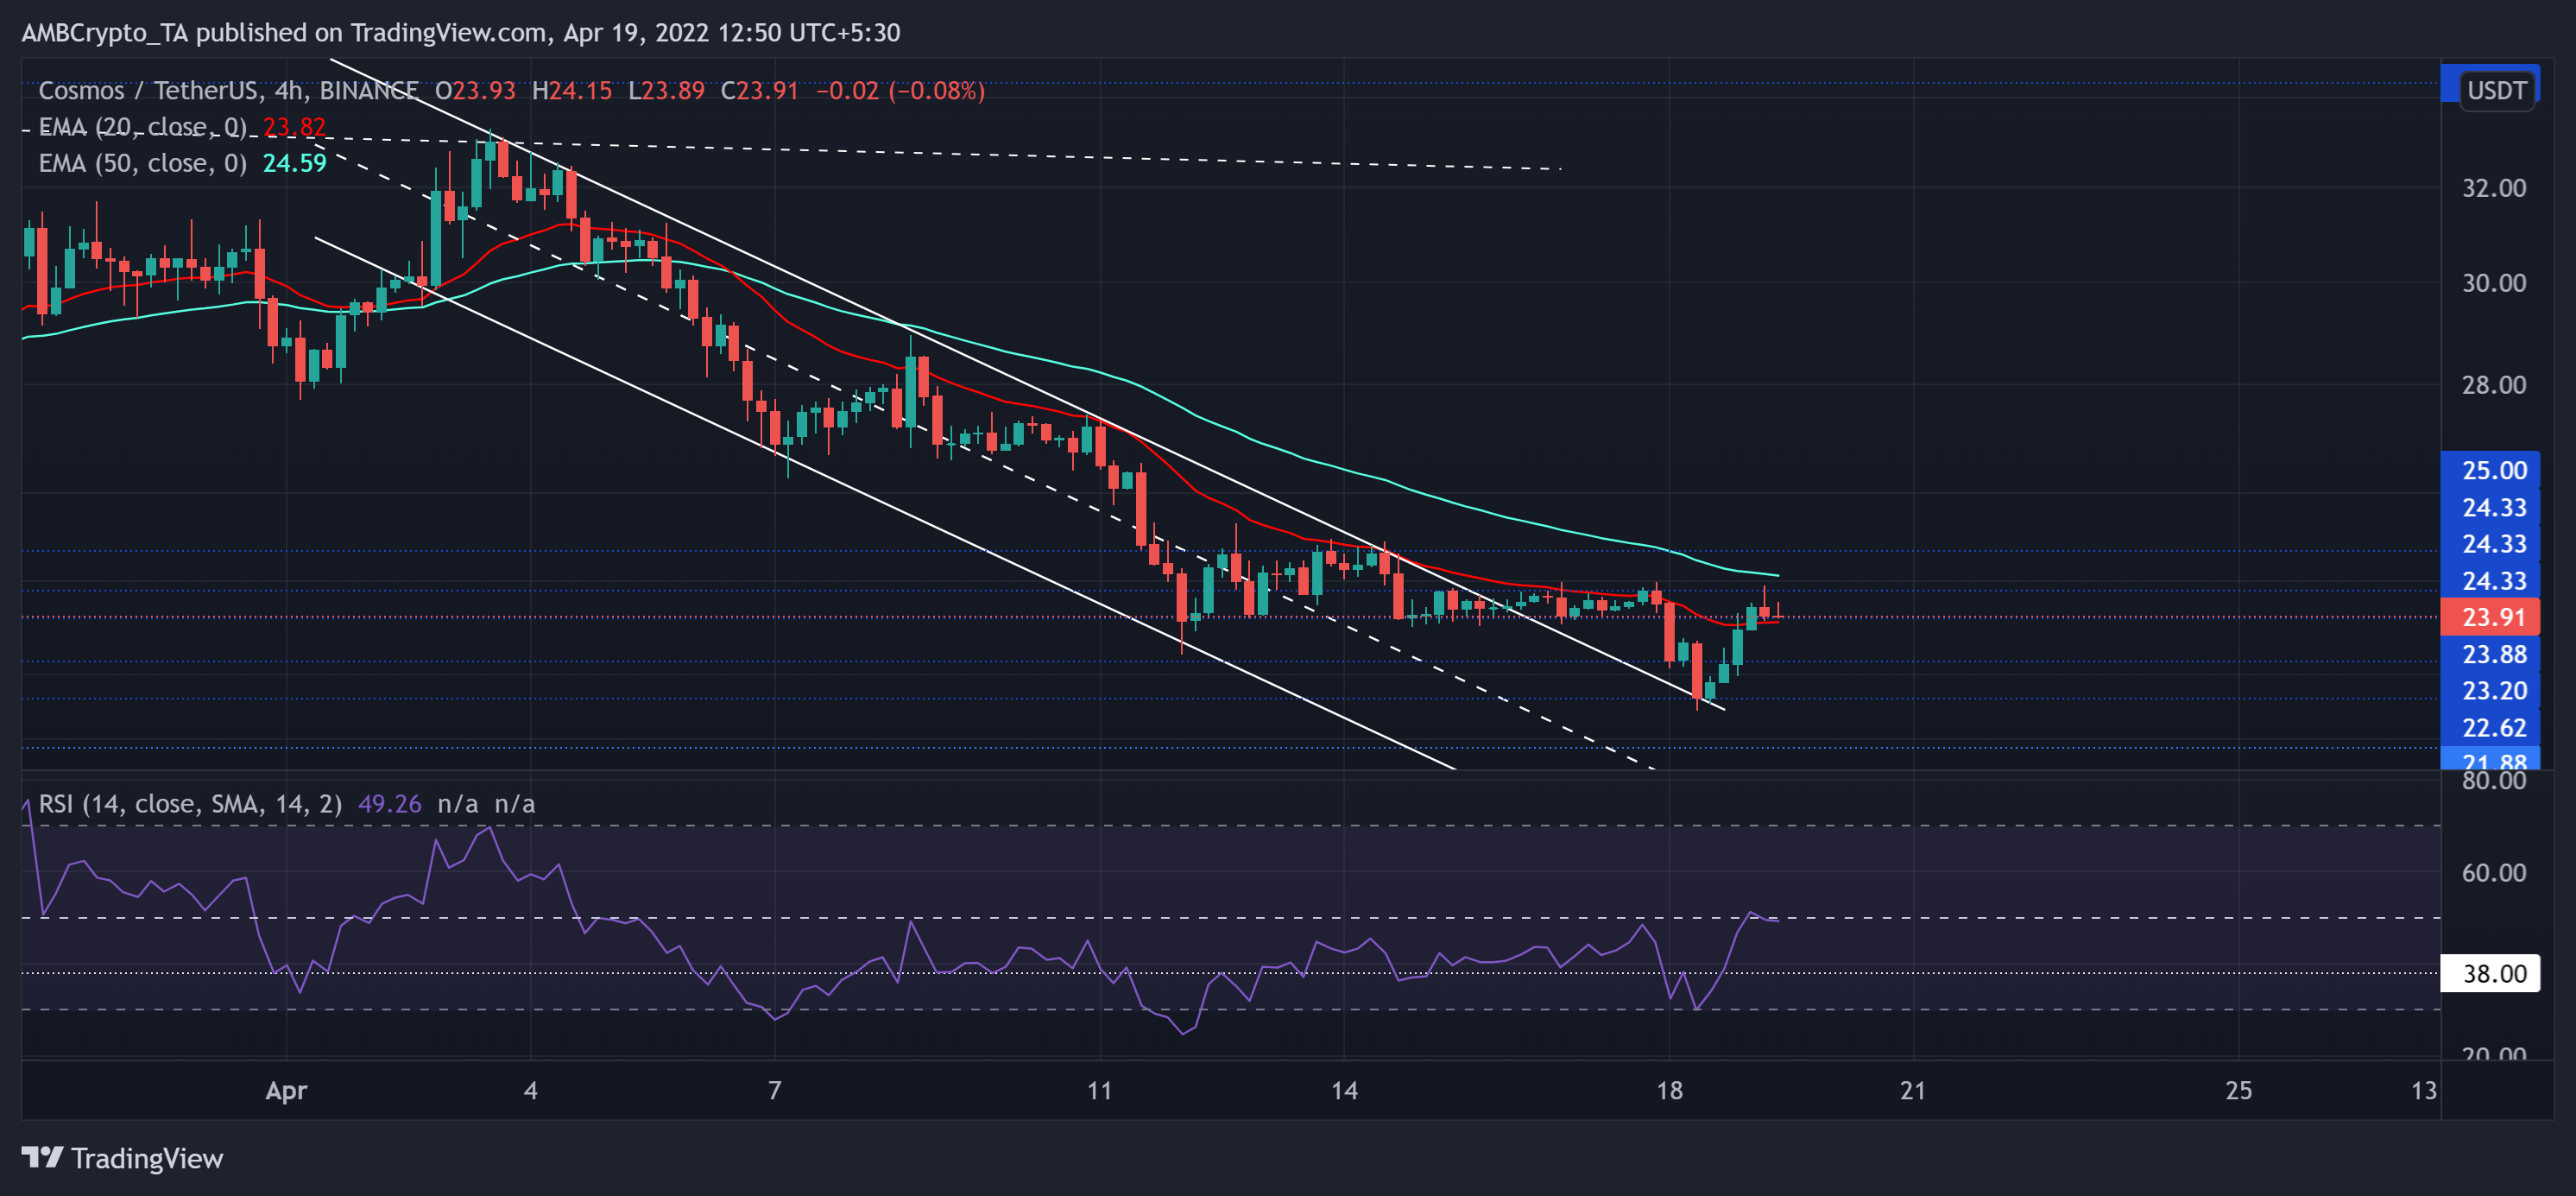
Since tumbling from the $43-resistance, the alt consistently dropped its peaks in the last three months. The recent sell-off phase led ATOM to lose nearly a third of its value from 3 April until it matched its seven-week low on 18 April.
Meanwhile, bulls stepped in to defend the $22-mark as ATOM finally witnessed a patterned breakout in the 4-hour timeframe. As a result, buyers flipped the 20 EMA (red) from resistance to support.
At press time, ATOM was trading at $23.91. The RSI saw a rapid jump after bouncing back from the oversold mark in the last 24 hours. A sustained close above the midline would position the alt for a test of the 50 EMA (cyan).
Decentraland (MANA)
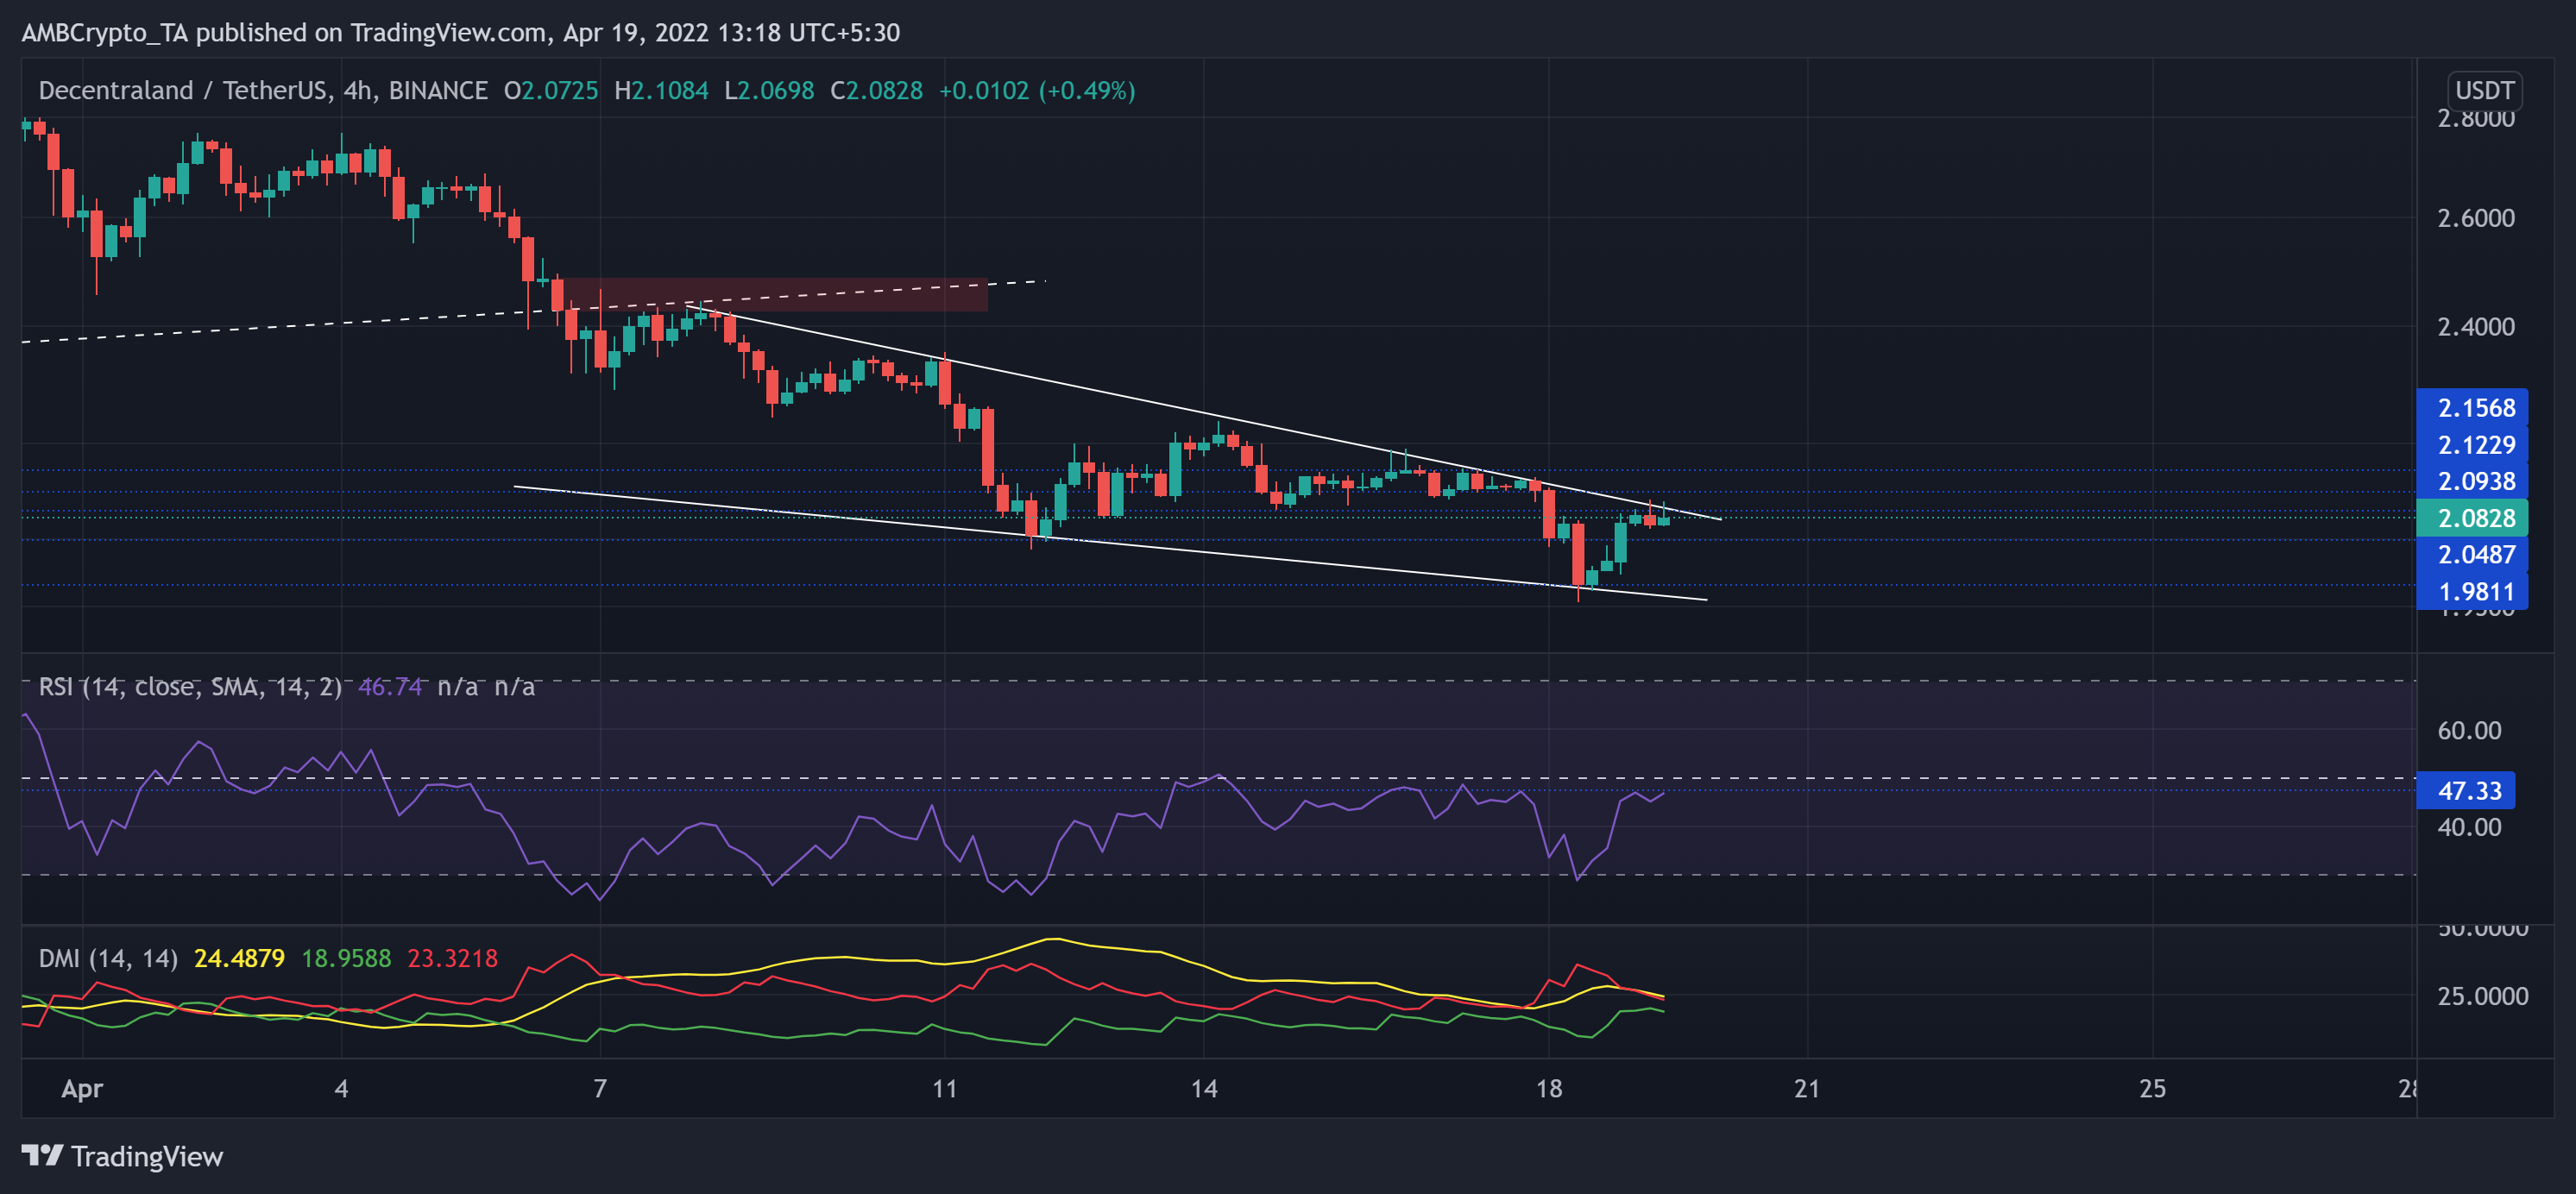
After dropping from its November highs and poking its multi-month low in late January, the $3.3-level shunned all bullish recovery attempts. Despite this, the bulls have ensured higher troughs but failed to uphold the three-month-long trendline support (now resistance) (white, dashed).
Over the last ten days, MANA descended in a falling wedge (white) on its 4-chart. The price is now approaching a squeeze phase after a steep 24-hour surge. To propel a trend-altering rally in favor of bulls, a close above the $2.09-mark would be imperative.
At press time, MANA was trading at $2.08, up by 5.52% in the last 24 hours. The alt’s RSI struggled to overturn the 47-mark but revealed an underlying increase in buying pressure. Further, the DMI gave the sellers a slight edge while its ADX depicted a weak directional trend for MANA.
The Sandbox (SAND)
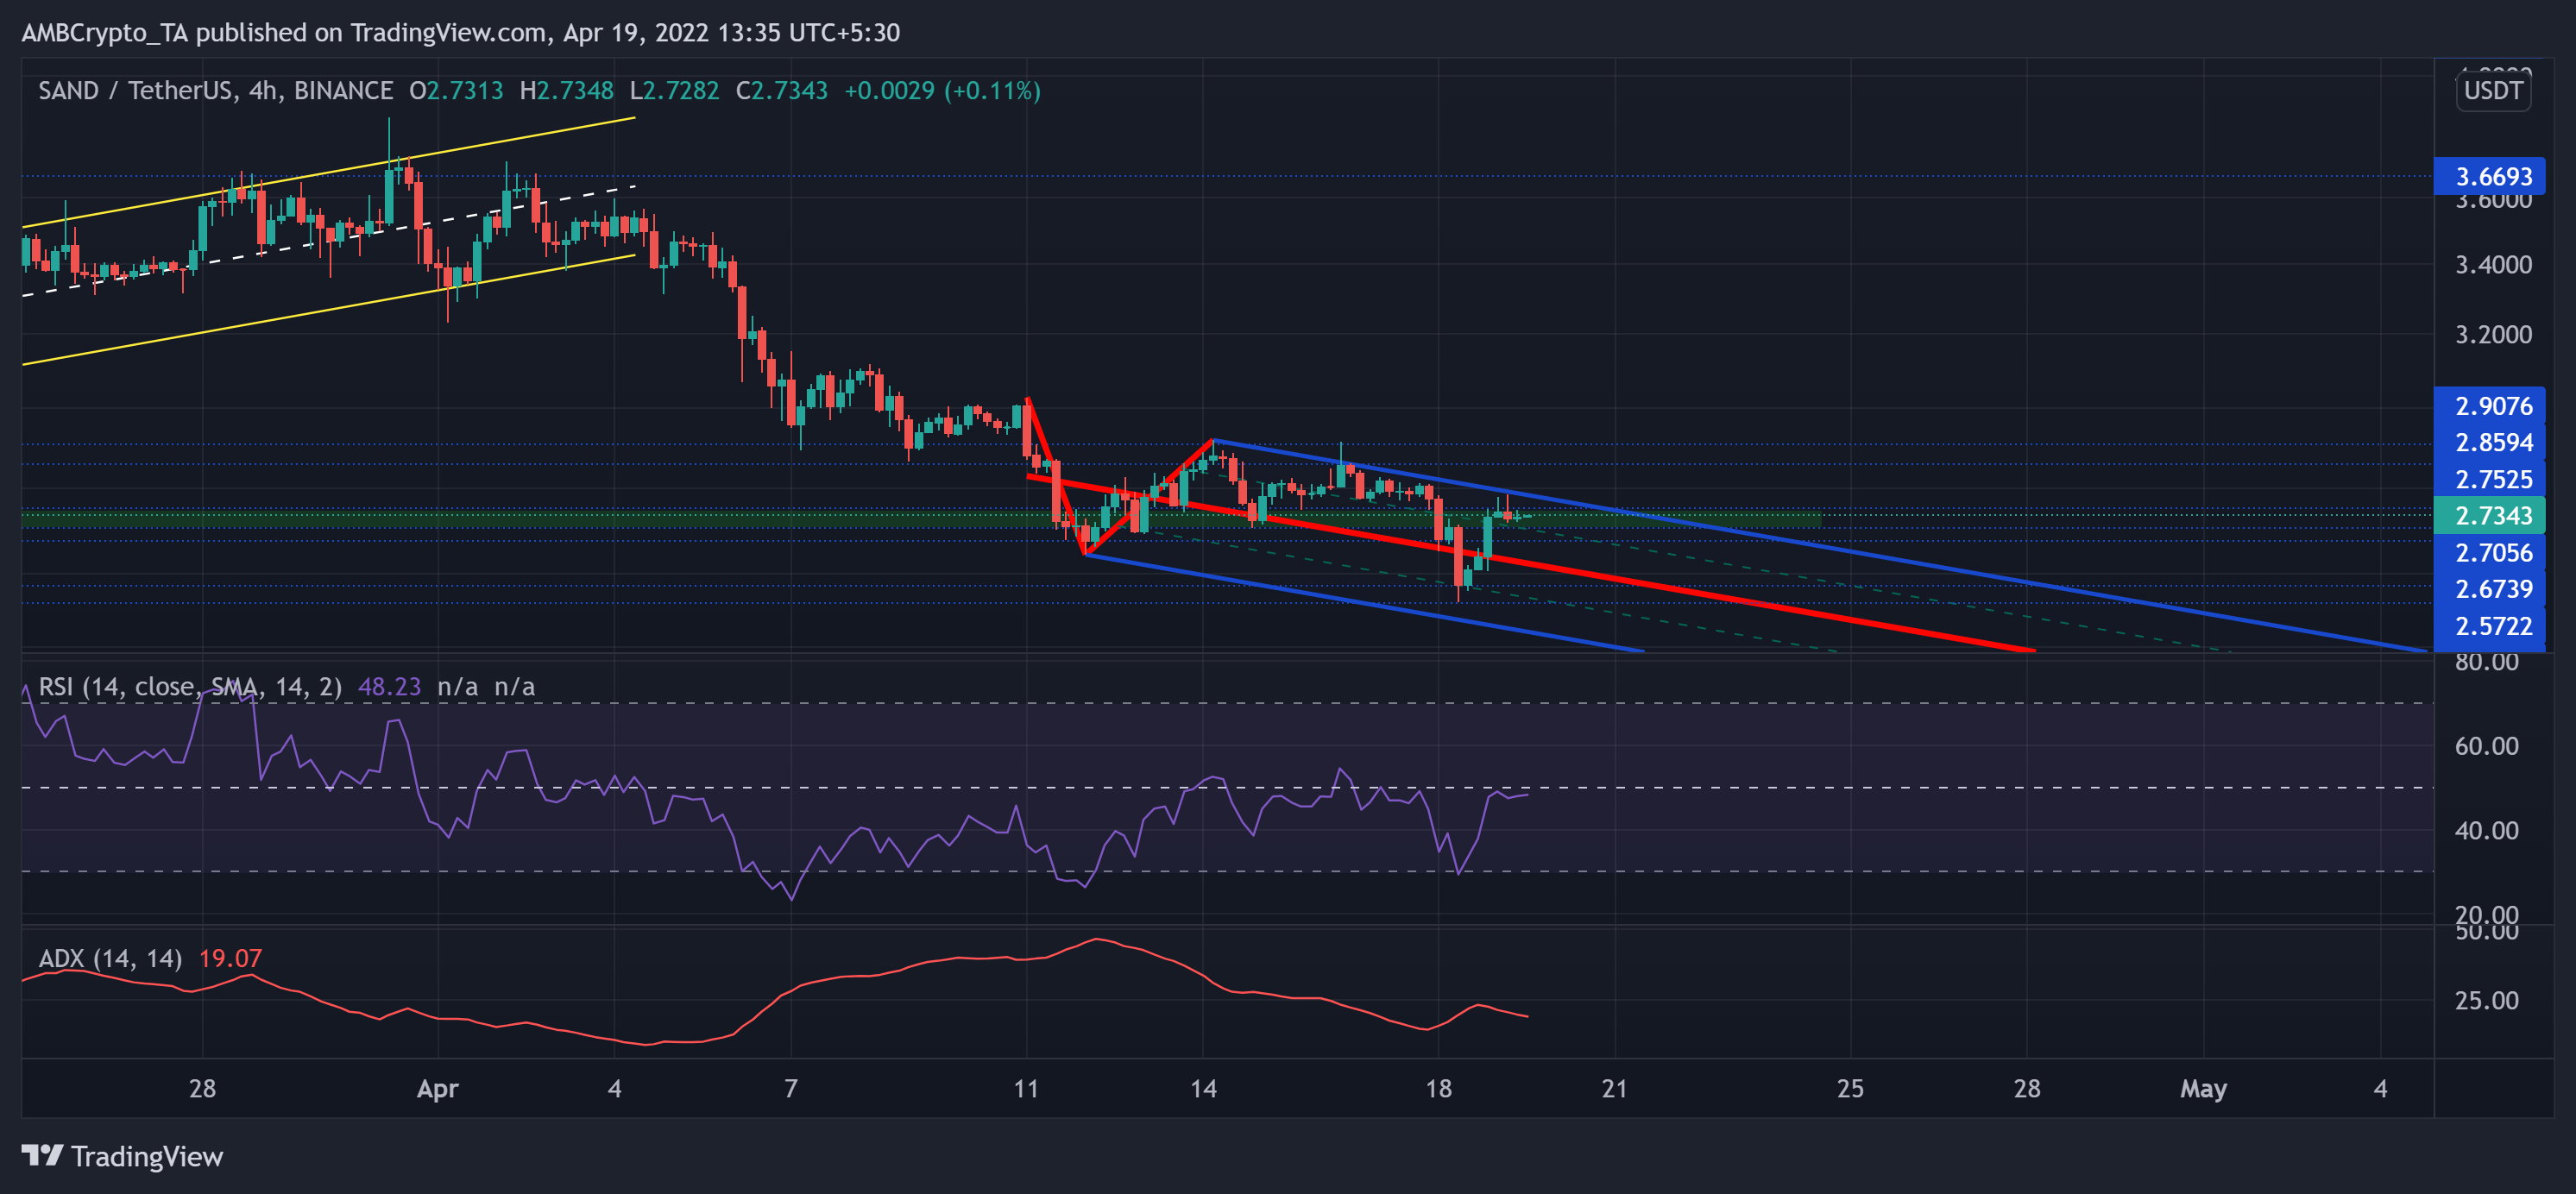
The recent up-channel rally from its long-term demand zone halted at the $3.6 resistance. Consequently, SAND was down by over 31% and plummeted toward its five-month low on 18 April.
The pitchfork tools’ upper trendline offered a strong resistance over the last five days. If the bears continue their selling spree, SAND eyed at a likely retest of the median (red) of the pitchfork. The $2.7-mark would be critical to determine the fate of SAND’s trend in the coming days.
At press time, the alt was trading at $2.7343. The RSI was near the midline while refraining from exhibiting a one-sided bias. Similar to MANA, SANDs ADX revealed a fragile directional trend as it still looked south.


