Cosmos, Tezos, NEAR Price Analysis: 02 March

After improvements in the broader sentiment, Cosmos reclaimed the vital $30-support. However, any break below its pattern could lead to a strong pullback. Although Tezos saw promising gains, it still lacked enough volumes for a sustainable rally. On the other hand, NEAR saw an inverse head and shoulder breakout while gaining its lost $11 support.
Cosmos (ATOM)
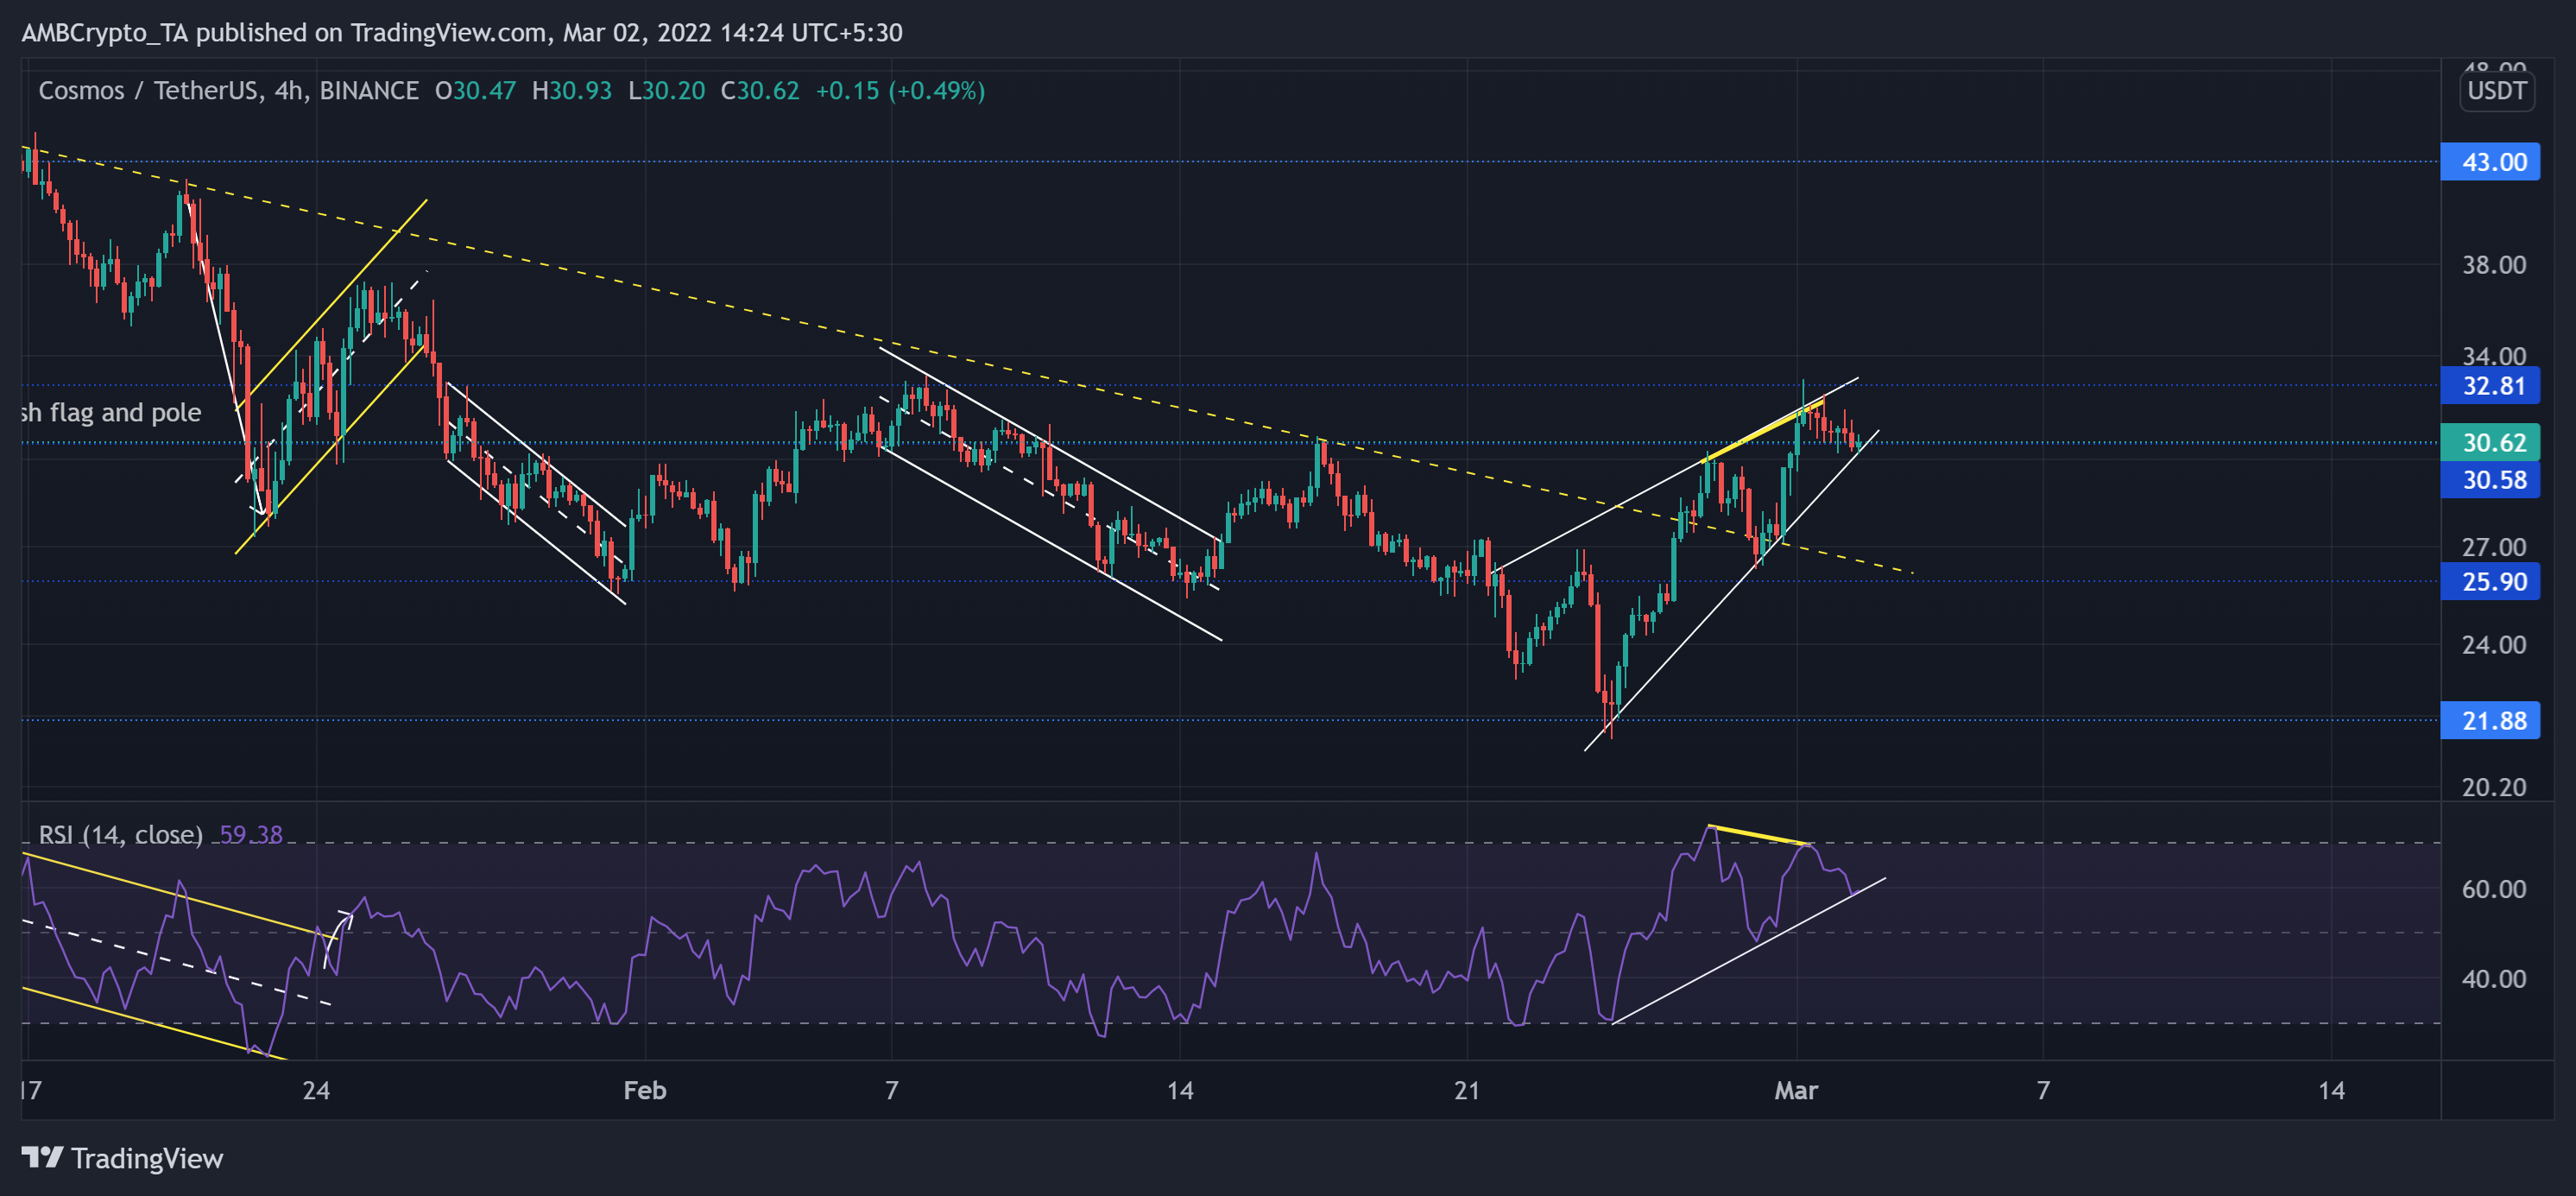
The latest sell-off phase led ATOM to lose nearly 30% (from 17 February) of its value until it touched its two-month low on 24 February.
Since falling from the $43-mark, the alt had been on a sharp downturn by marking lower peaks and troughs. The trendline resistance (yellow, dashed) (now support) visibly demonstrated the bearish edge as ATOM tested the $21-level. Since then, the bulls took over as the alt rose in a rising wedge (white) while snapping the trendline support and reclaiming the $30-mark again. Now, if the bulls ensure this mark, ATOM eyed to test its one-month long resistance at the $32-mark.
At press time, ATOM was trading at $30.62. The bullish RSI pulled back from the overbought region after a bearish divergence (yellow trendline) with the price. Going forward, Bulls needed to defend the trendline support to prevent the RSI from a half-line retest.
Tezos (XTZ)
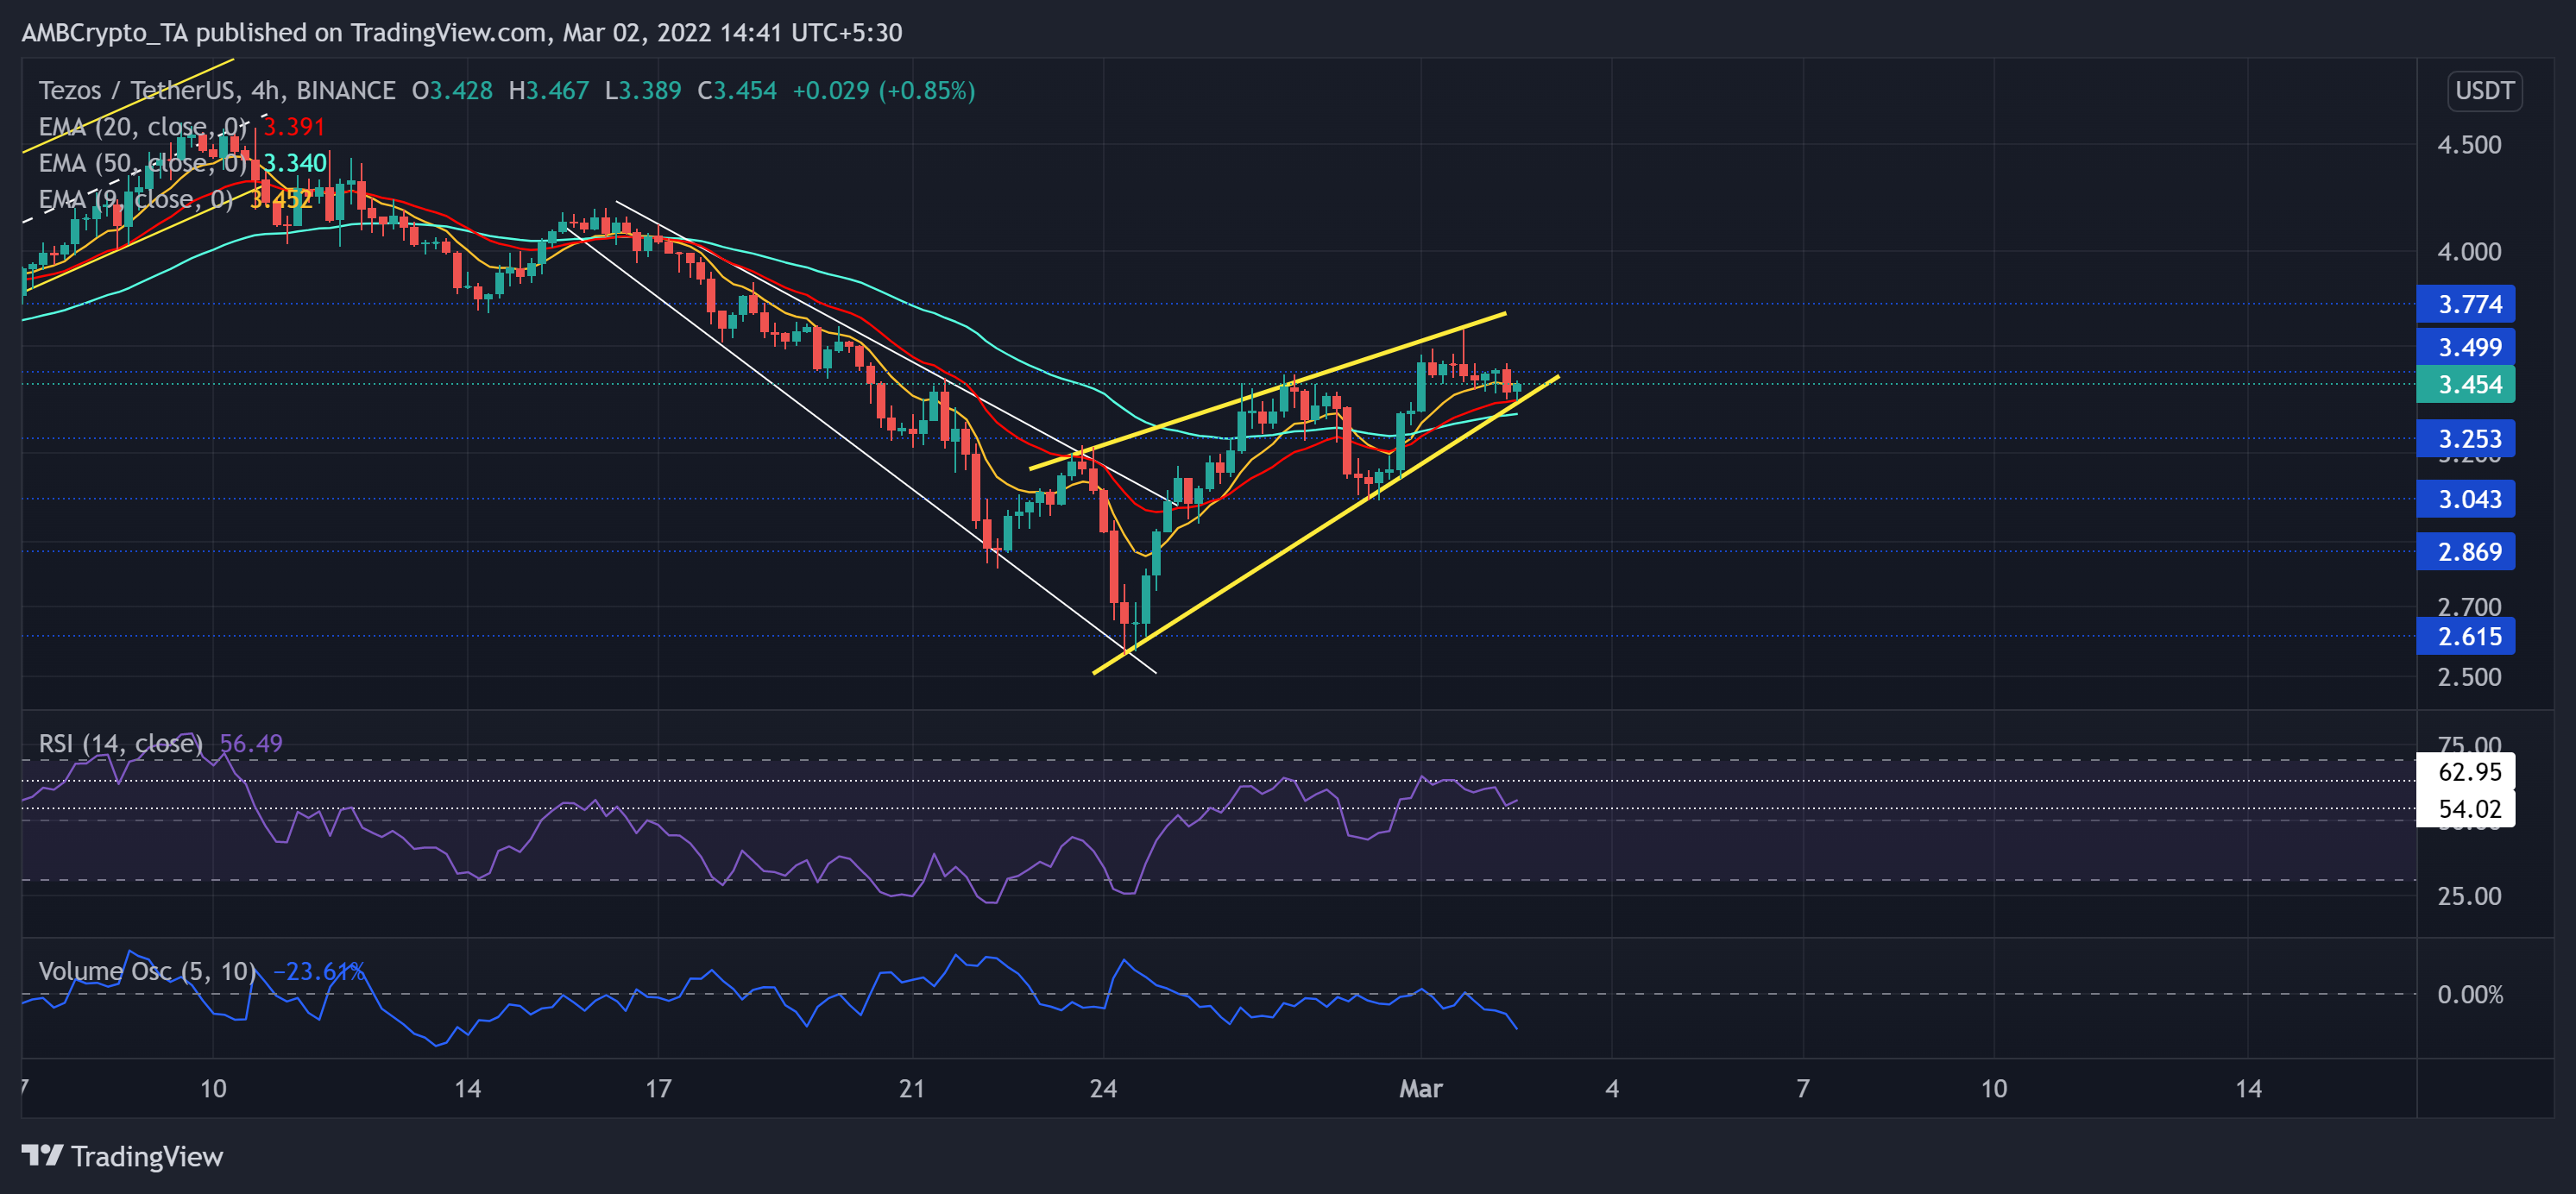
XTZ saw an over 43% pullback as it fell in a descending broadening wedge (white) and matched its January lows.
From its $2.6, 26-week floor, the bulls propelled a 34.7% rally above the 20-50-200 EMA that was shunned by the $3.4-resistance. However, since the last day, XTZ saw a pullback towards the lower trendline of the rising wedge (yellow). Meanwhile, the 20 EMA (red) jumped above the 50 EMA (Cyan) and affirmed a bullish edge.
At press time, the alt traded at $3.454. Over the last day, the RSI floated above the 54-level and confirmed the bullish strength. Also, the Volume Oscillator remained below its zero-line during the breakout phase, hinting at a weak bull move.
Near Protocol (NEAR)
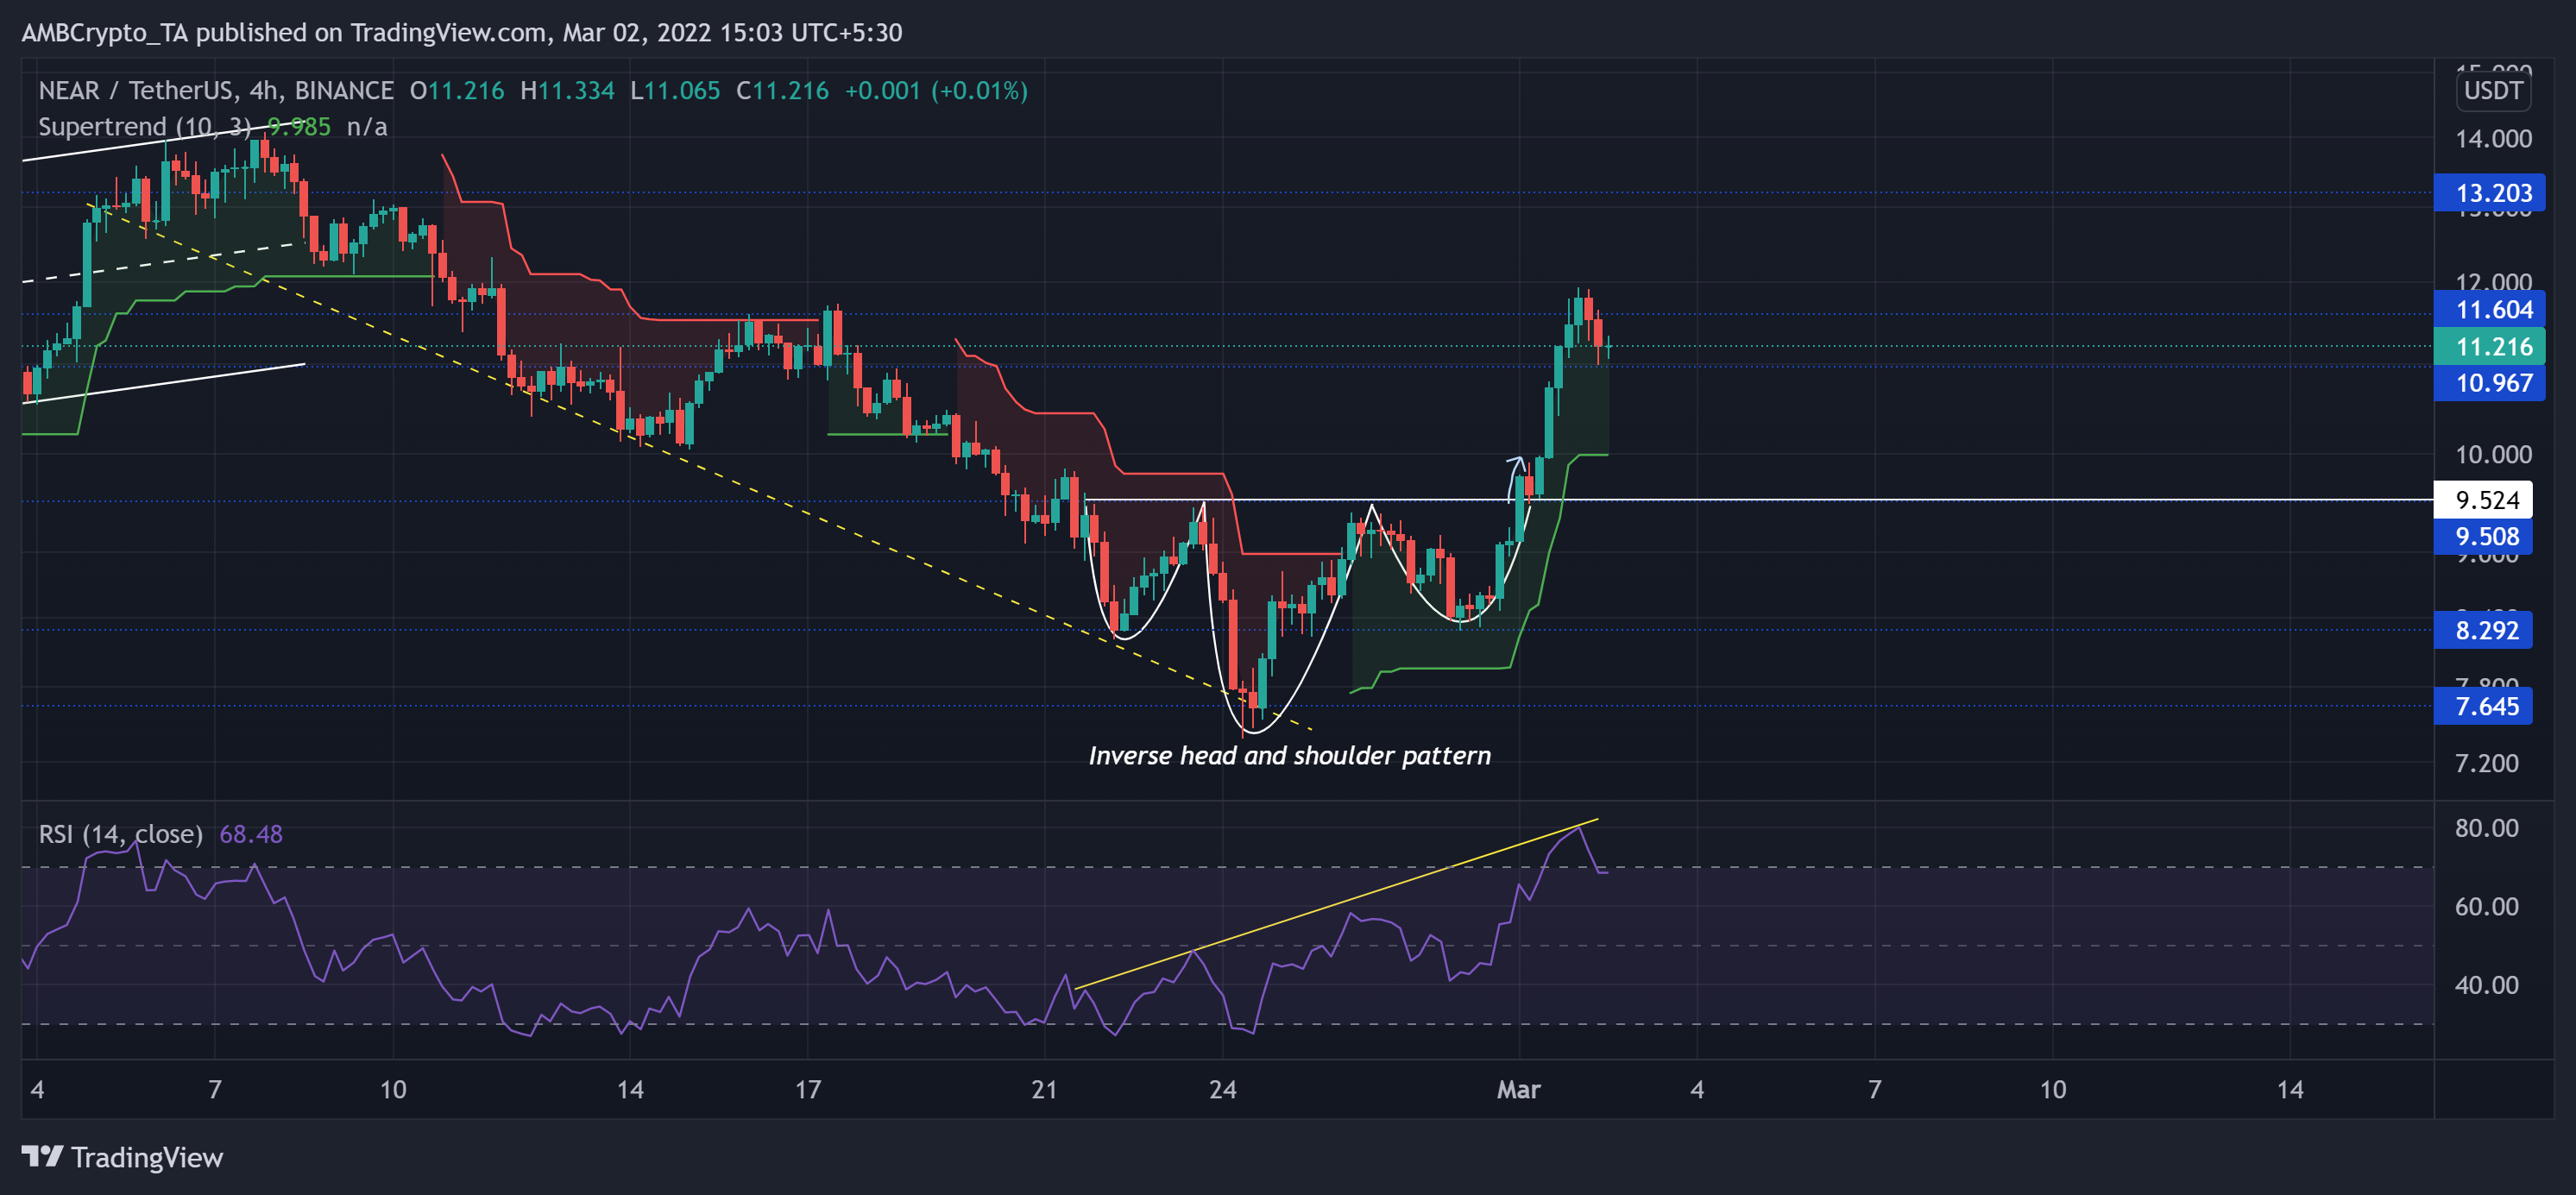
Since its ATH, NEAR lost more than half of its value and plunged toward its 11-week low on 24 February. Moreover, it lost its crucial $10.9-level resistance (now support).
After a steep patterned breakdown, NEAR adhered to its trendline support while diving towards the $7.9-mark. Over the past few days, it witnessed an inverse head and shoulder on its 4-hour chart. The 1 March breakout candlestick confirmed the pattern propelled gains as the alt tested the $11-resistance.
At press time, the NEAR traded at $11.2. The RSI saw exponential growth as it touched its record high on 2 March. It now seemed to show slowing signs from its overbought region. Furthermore, the Supertrend continued to support the buying tendencies in the near term.