Ethereum: Why ‘to buy or not to buy’ is not the question to ask

Disclaimer: The findings of the following analysis are the sole opinions of the writer and should not be considered investment advice
Some people will tell you it isn’t a question at all and buying Ethereum is always a good idea. Other people prefer to wait for opportunities and look to price charts to guide their investment decisions. These decisions have been unclear in recent weeks – Bitcoin appeared to have dropped strongly as fear swept through the market when Russia decided to invade Ukraine.
Since then, the prices have crept higher on the charts. Ethereum has also seen demand arrive, but has it been enough to flip the trend to bullish?
ETH- 12 hour chart

In order to flip the longer-term market structure to bullish, ETH has to climb above the $3290 and $3411-levels and flip them to support. These levels are the previous lower highs on ETH’s downtrend from early December.
Over the past month, Ethereum has recovered from a drop to the $2200-area, tested $3200, and faced heavy selling pressure. It dropped below the support at $2800 and bounced from the $2360 region. This volatility can dissuade risk-averse investors from buying the asset just yet.
At the time of writing, ETH had just broken above $2800 strongly. And, it is likely that the price would revisit this level in search of demand before its next move upwards. The $2550-area could also be visited in the days to come.
Overall, it is a slightly encouraging sign that ETH has formed higher lows ($2240 and $2360) in the past month. Even so, the local highs at $3290 and $3411 need to be broken.
Rationale
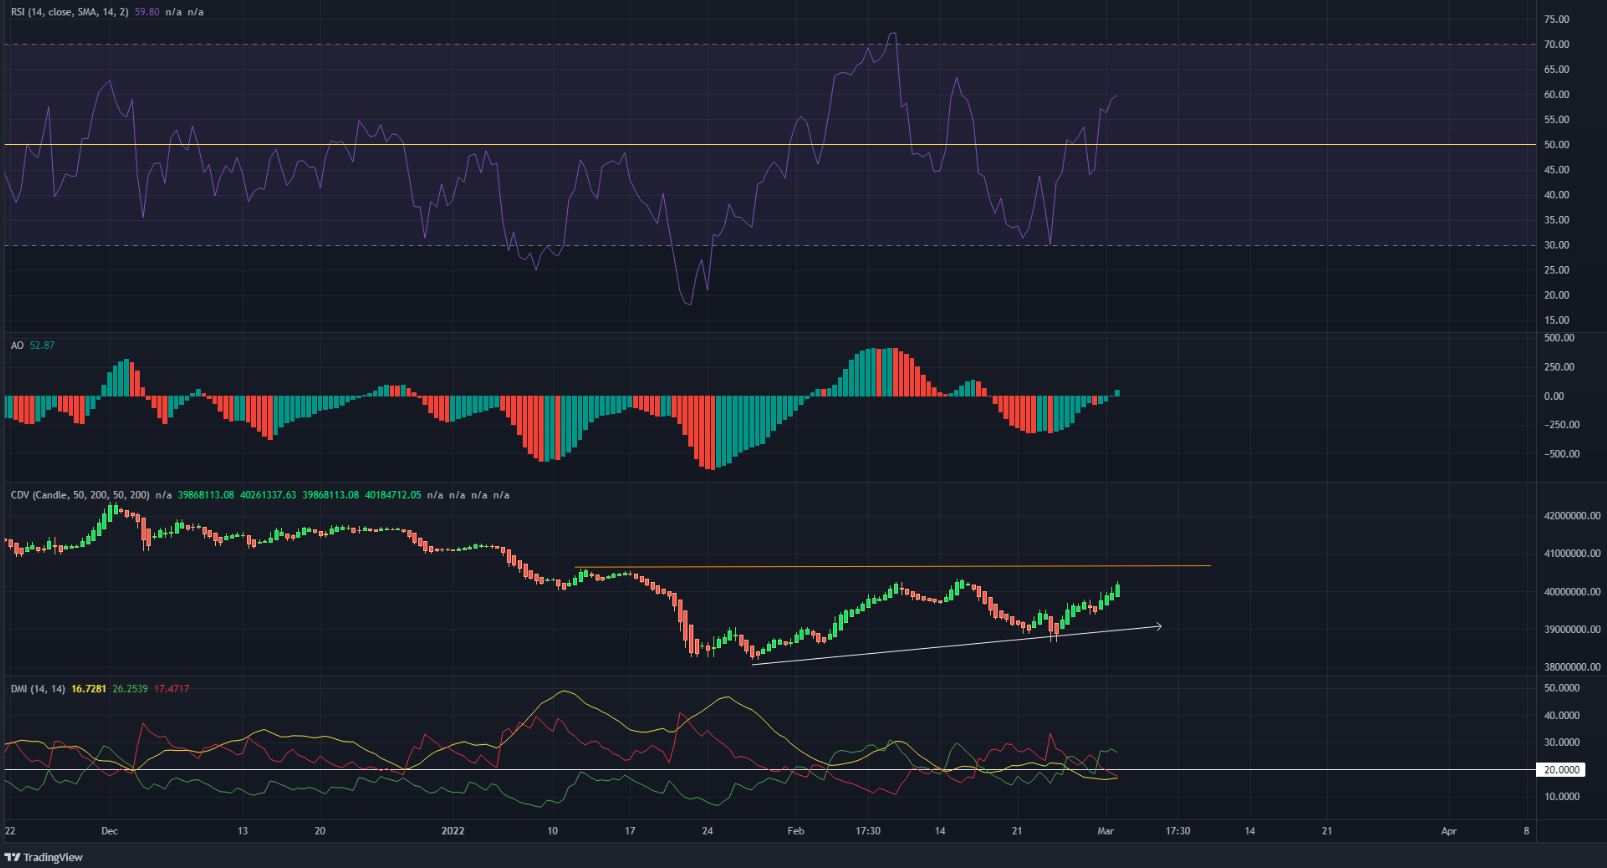
The RSI climbed above neutral 50 and stood at 59.8, at press time. This seemed to be a reflection of strong bullish momentum over the past few days. Yet, it was not a sign of a change in trend. The Awesome Oscillator also poked above the zero line to show a possible shift in momentum towards bullish.
The CDV formed higher lows on the chart, just like the price, but far more buying volume would be needed to drive a convincing rally north. The Directional Movement Index pictured a strong bearish trend in the third week of February. That apart, the past month did not see a sustainable strong trend. At the time of writing, the ADX (yellow) remained below 20 too.
Conclusion
The indicators showed signs that demand was present, but not overwhelming. The price charts showed two levels that ETH needs to flip to support- $3290 and $3411. Long-term buyers can wait for this scenario to play out. Risk-loving buyers can also place ETH buy orders at $2800 and $2550.