
Ethereum – Institutions scoop up $946M, but watch THIS metric for a shakeout!

Crypto.com Coin and BitTorrent flashed signs of exhaustion from record levels. Cosmos’ bulls maintained the price above $21.4 support. Lastly, EGLD moved within a descending triangle but an upwards breakout over the coming sessions would invalidate the pattern.
Crypto.com Coin [CRO]
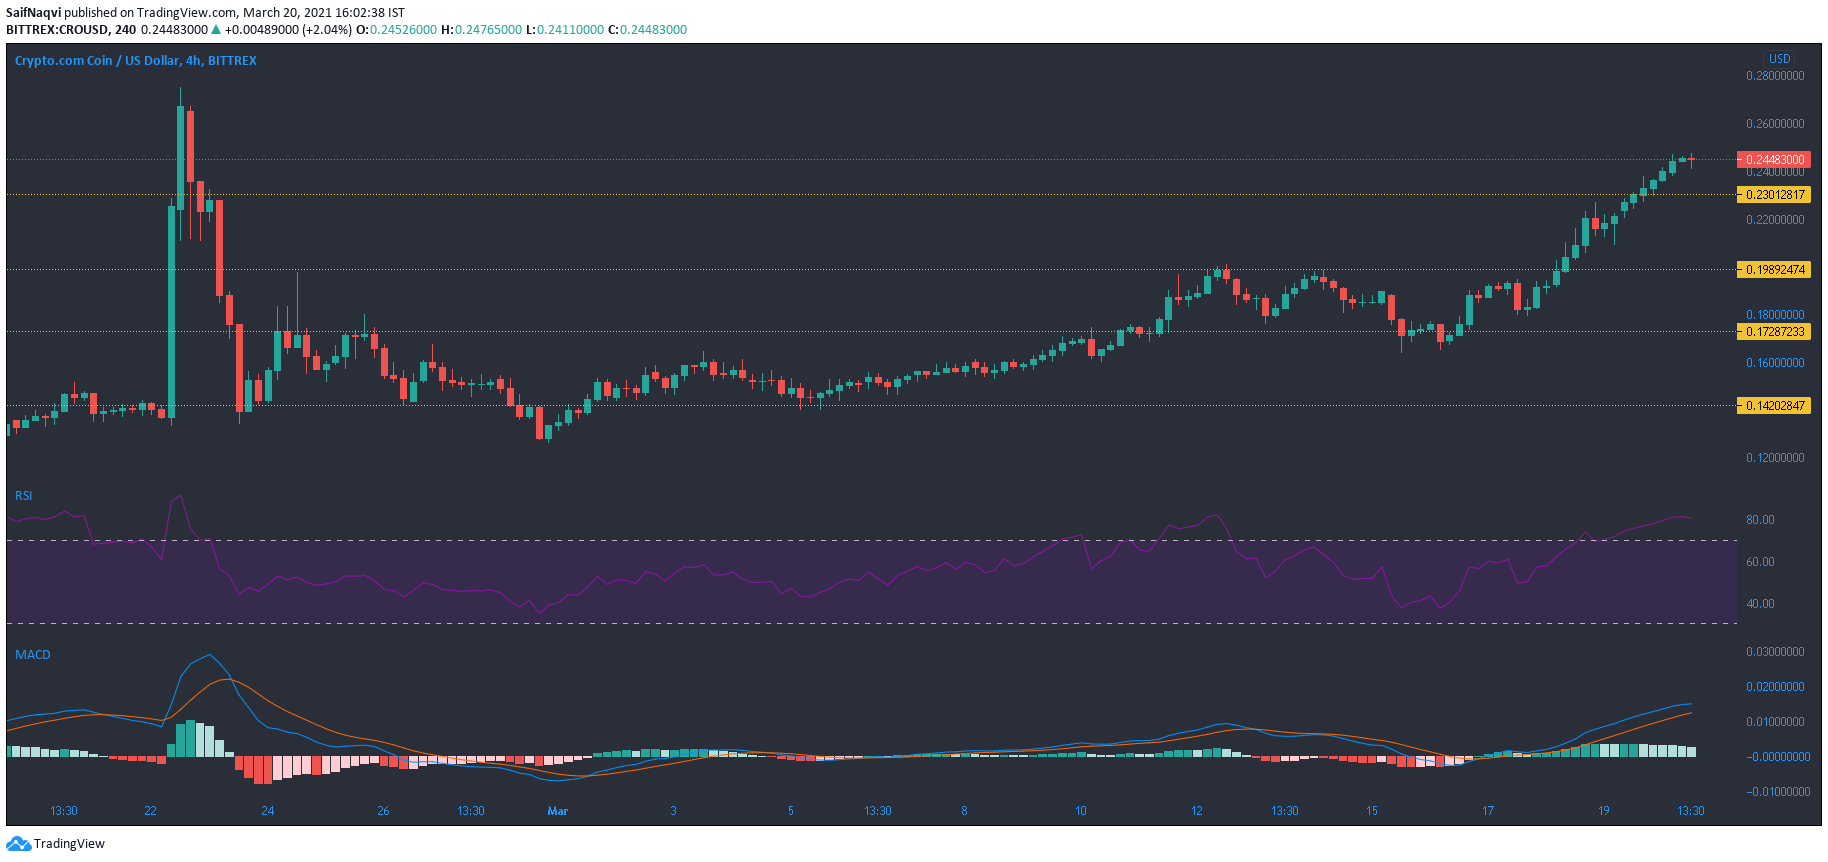
Source: CRO/USD, TradingView
Gains in the last seven days amounted to nearly 35% as Crypto.com Coin made a steady recovery towards record levels. Successive green candlesticks on the 4-hour chart showed strong bullish sentiment in the market. However, the appearance of a bearish spinning top, which usually indicates a reversal, added some skepticism in the mix.
Moreover, the RSI showed an oversaturation of buyers in the market and a sharp move below the upper region would reflect in CRO’s price as well. The MACD’s histogram also noted weakening bullish momentum, even though the fast-moving line was above the Signal line. In the event of a pullback, support levels reside at $0.23 and $0.198.
Cosmos [ATOM]

Source: ATOM/USD, TradingView
Even though Cosmos saw choppy movement below $24.3 resistance, the price remained above a strong support level of $21.4. The aforementioned support mark was an important level to maintain for the bulls after they regained lost territory for the first time since the broader market pullback in late-February.
The RSI spiked in the overbought zone as ATOM eyed a move above $24.5 resistance, but reversed trajectory as the price stabilized on the 4-hour timeframe. The next target for the bulls resided at $26.29-resistance. The MACD line moved below the Signal line and reflected bearish sentiment in the market. A fall below the press time support would highlight the next defense at $19.8.
BitTorrent [BTT]
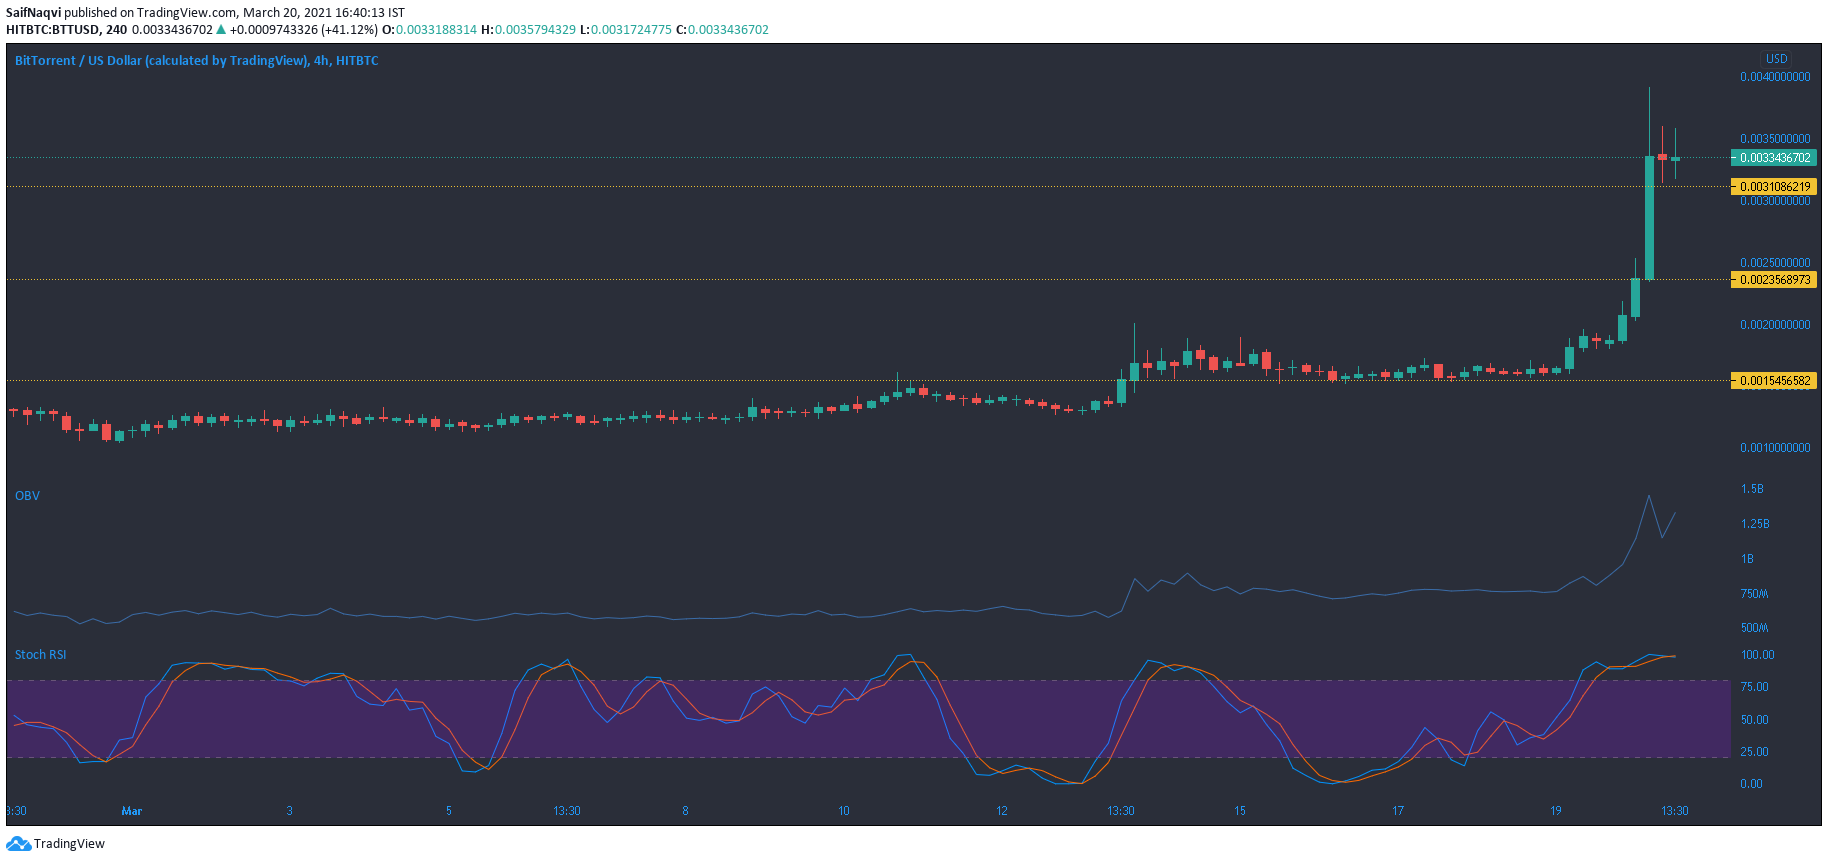
Source: BTT/USD, TradingView
The last 24 hours saw BitTorrent jump by nearly 90% on the back of strong buying activity and healthy volumes. The OBV registered a spike, dipped slightly, and pointed north once again as buying pressure drove the price to its newest ATH. Trading volumes clocked in at nearly $5 Billion, up by 367% compared to yesterday.
However, the Stochastic RSI did point towards a pullback after a bearish crossover in the overbought region. Spinning top candlesticks were also indicative of a trend reversal for BTT. The bulls must be weary of avoiding a sharp sell off in the coming sessions, a scenario that was already witnessed when the last ATH was snapped during early-February.
Elrond [ELGD]
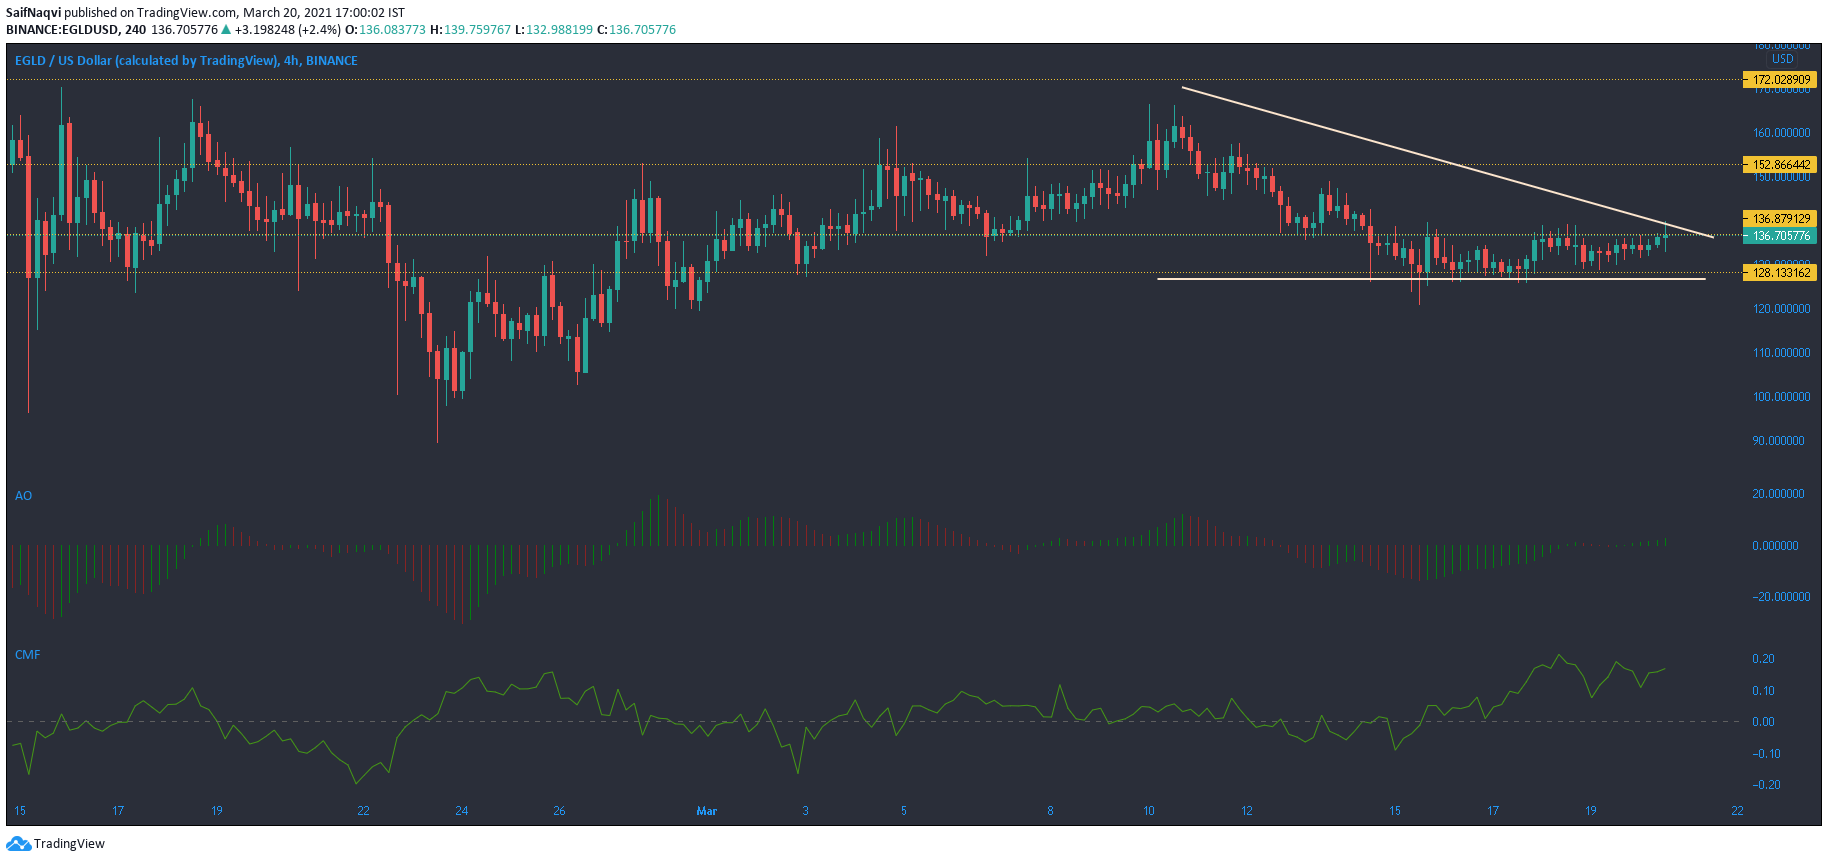
Source: EGLD/USD, TradingView
A descending triangle emerged on Elrond’s 4-hour chart after the price formed lower highs since climbing above the $160-mark, while the lows remained largely steady at $128.1 support.
The Awesome Oscillator was bullish-neutral, while the the CMF stayed well above the half-way mark and showed strong capital inflows towards the cryptocurrency. A rise above the upper trendline would present the next target at $152.8 resistance. Conversely, a breakdown from this pattern would likely see EGLD move towards the $100-support.


