Crypto.com Coin, IOTA, Sushiswap Price Analysis: 13 March

CRO attempted to recapture the 38.2% Fibonacci retracement level on the back of positive indicators. IOTA moved within a horizontal channel, while SUSHI showed signs of exhaustion from record levels.
Crypto.com Coin [CRO]
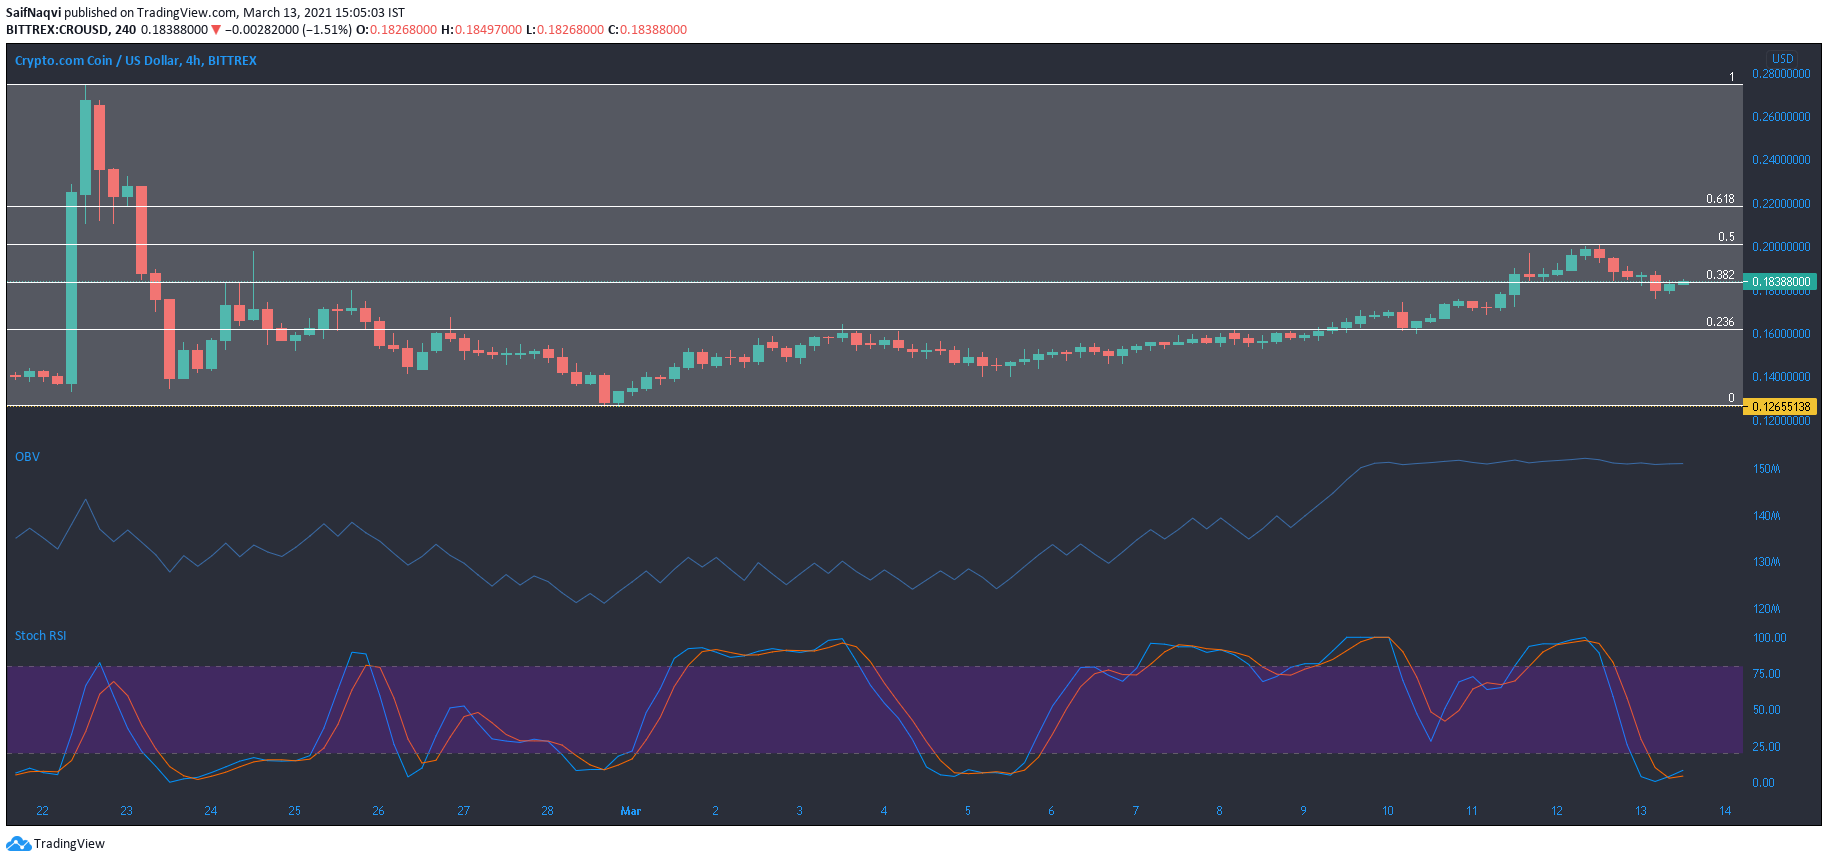
Crypto.com Coin fell by 7% in the last 24 hours and slipped below the 38.2% Fibonacci level. However, the OBV reflected healthy buying pressure as the bulls attempted to regain some lost ground. The Stochastic RSI showed a bullish crossover in the oversold region and backed a favorable short-term outcome.
A move above the 50% Fibonacci level would require a sharp pickup in trading volumes, which were minimal at the time of writing. On the other hand, the presence of buyers in the market should counter a move below the 23.6% Fibonacci level.
IOTA
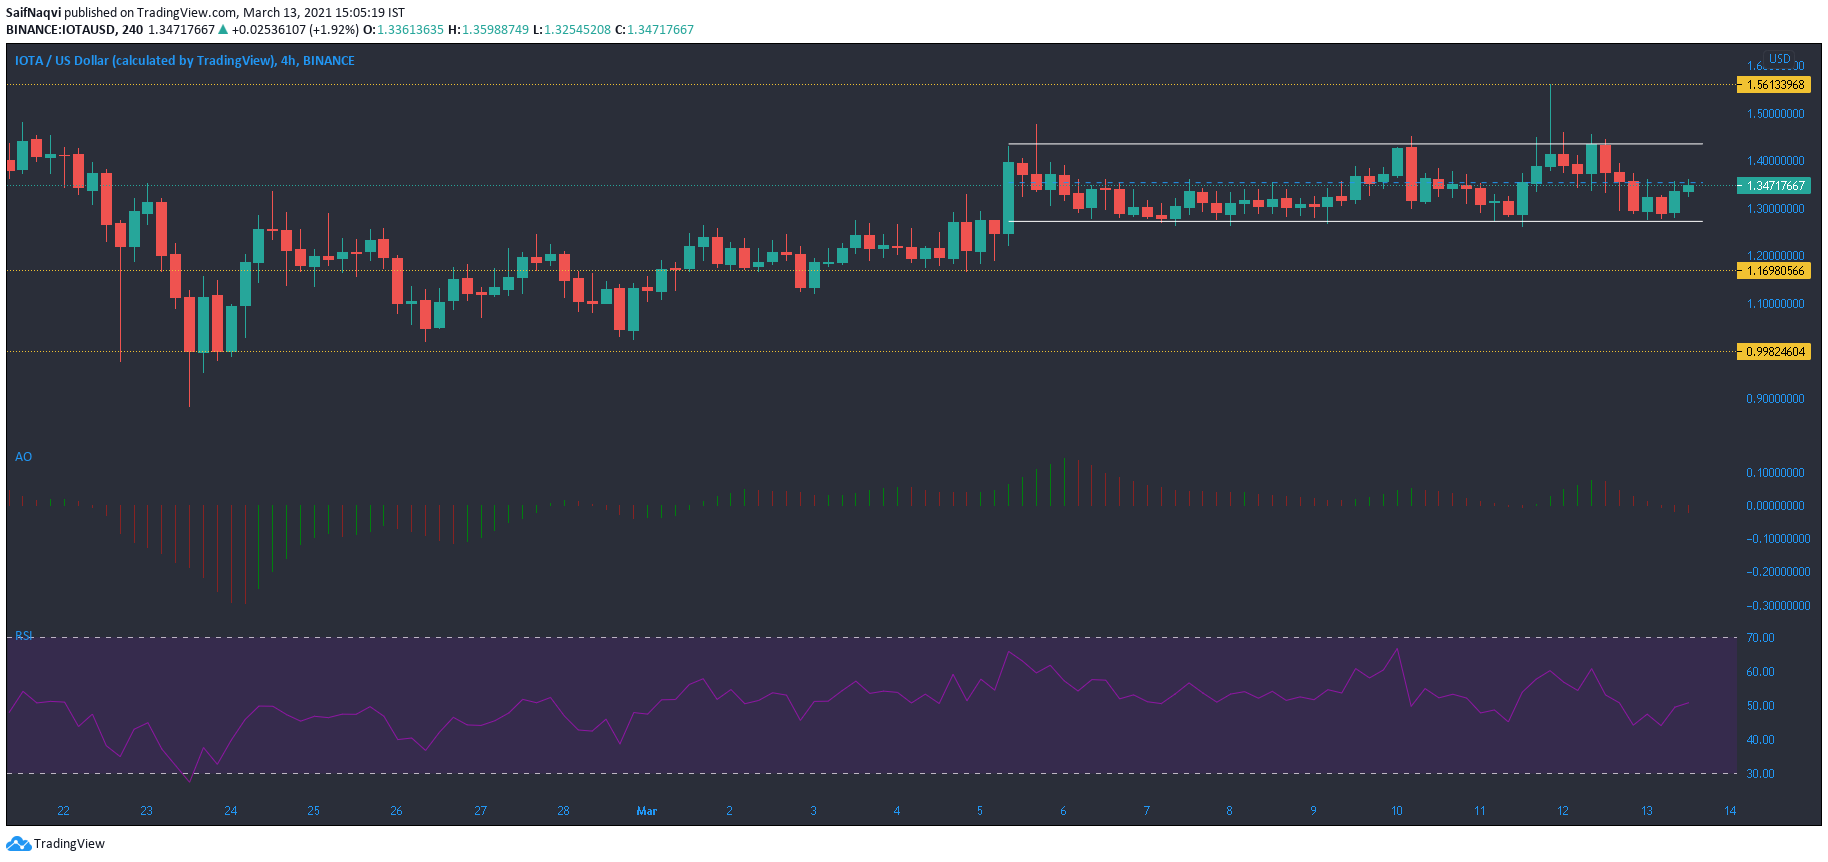
Gains in the last 30 days now amounted to over 14% as IOTA picked up its recovery from slightly under the $1 mark and climbed steadily on the charts. However, the range $1.43-$1.23 presented a horizontal channel for IOTA, a region where the price has traded for over a week now.
The Awesome Oscillator showed the back and forth shift of momentum as the price oscillated between the upper and lower trendline. Momentum sided once again with the sellers at the time of writing. The RSI floated around the 50-mark and showed a balanced market. A spike in the 24-hour trading volumes could offer some insight with regards to a breakout in either direction.
Sushiswap [SUSHI]
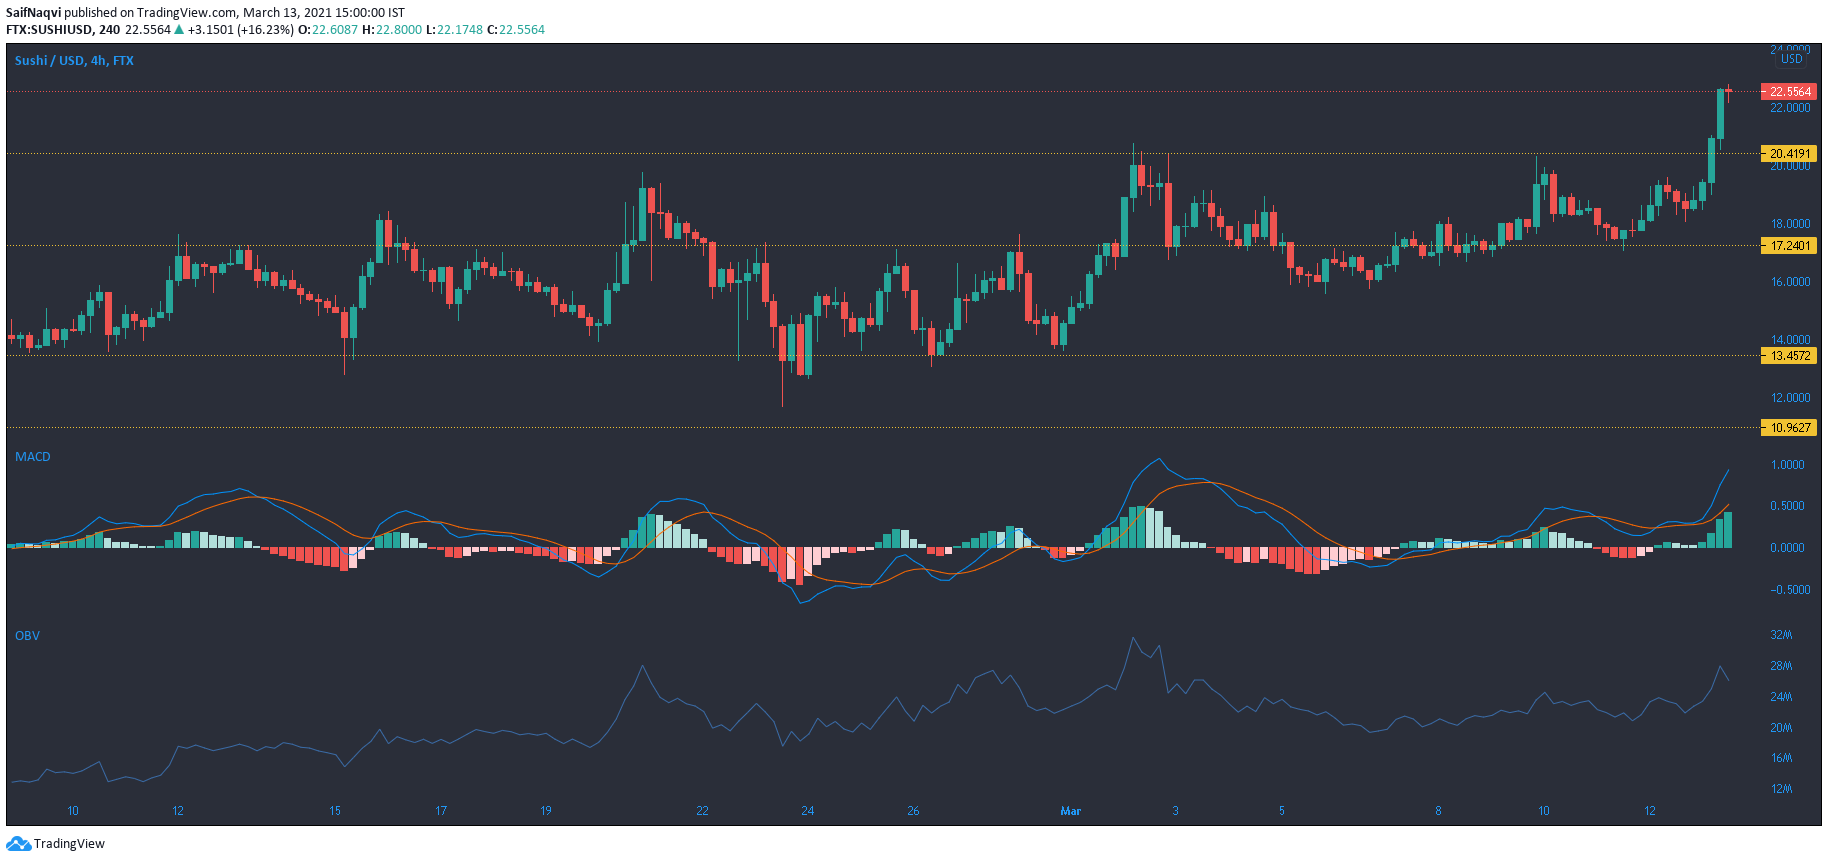
Successive long green-bodied candlesticks on Sushiswap’s 4-hour charts reflected the bullish sentiment prevalent in the market as the price broke north of $20.41 resistance and traded at record levels. The MACD line rose well above the Signal line, while the histogram noted rising bullish momentum. The gains were also backed by an uptick in the 24-hour trading volumes, which clocked in at $1.7 billion at press time.
The optimism was cut down by the appearance of a doji candlestick in the last session of trade. The doji is generally associated with a reversal and shows indecision in the market. The OBV also fell and indicated a dip in buying pressure. A minor pullback could be cushioned at the immediate support mark. Any move lower could threaten the next support level at $17.2.