Crypto.com Coin, Monero, Hedera Hashgraph Price Analysis: 11 April

Crypto.com Coin faced selling pressure at $0.23 but also had support in the $0.19-$0.2 region. Monero was in a strong uptrend and could break past $300, while Hedera Hashgraph would need to flip $0.4 to support to sway market participants’ sentiment toward bullish.
Crypto.com Coin [CRO]

Source: CRO/USDT on TradingView
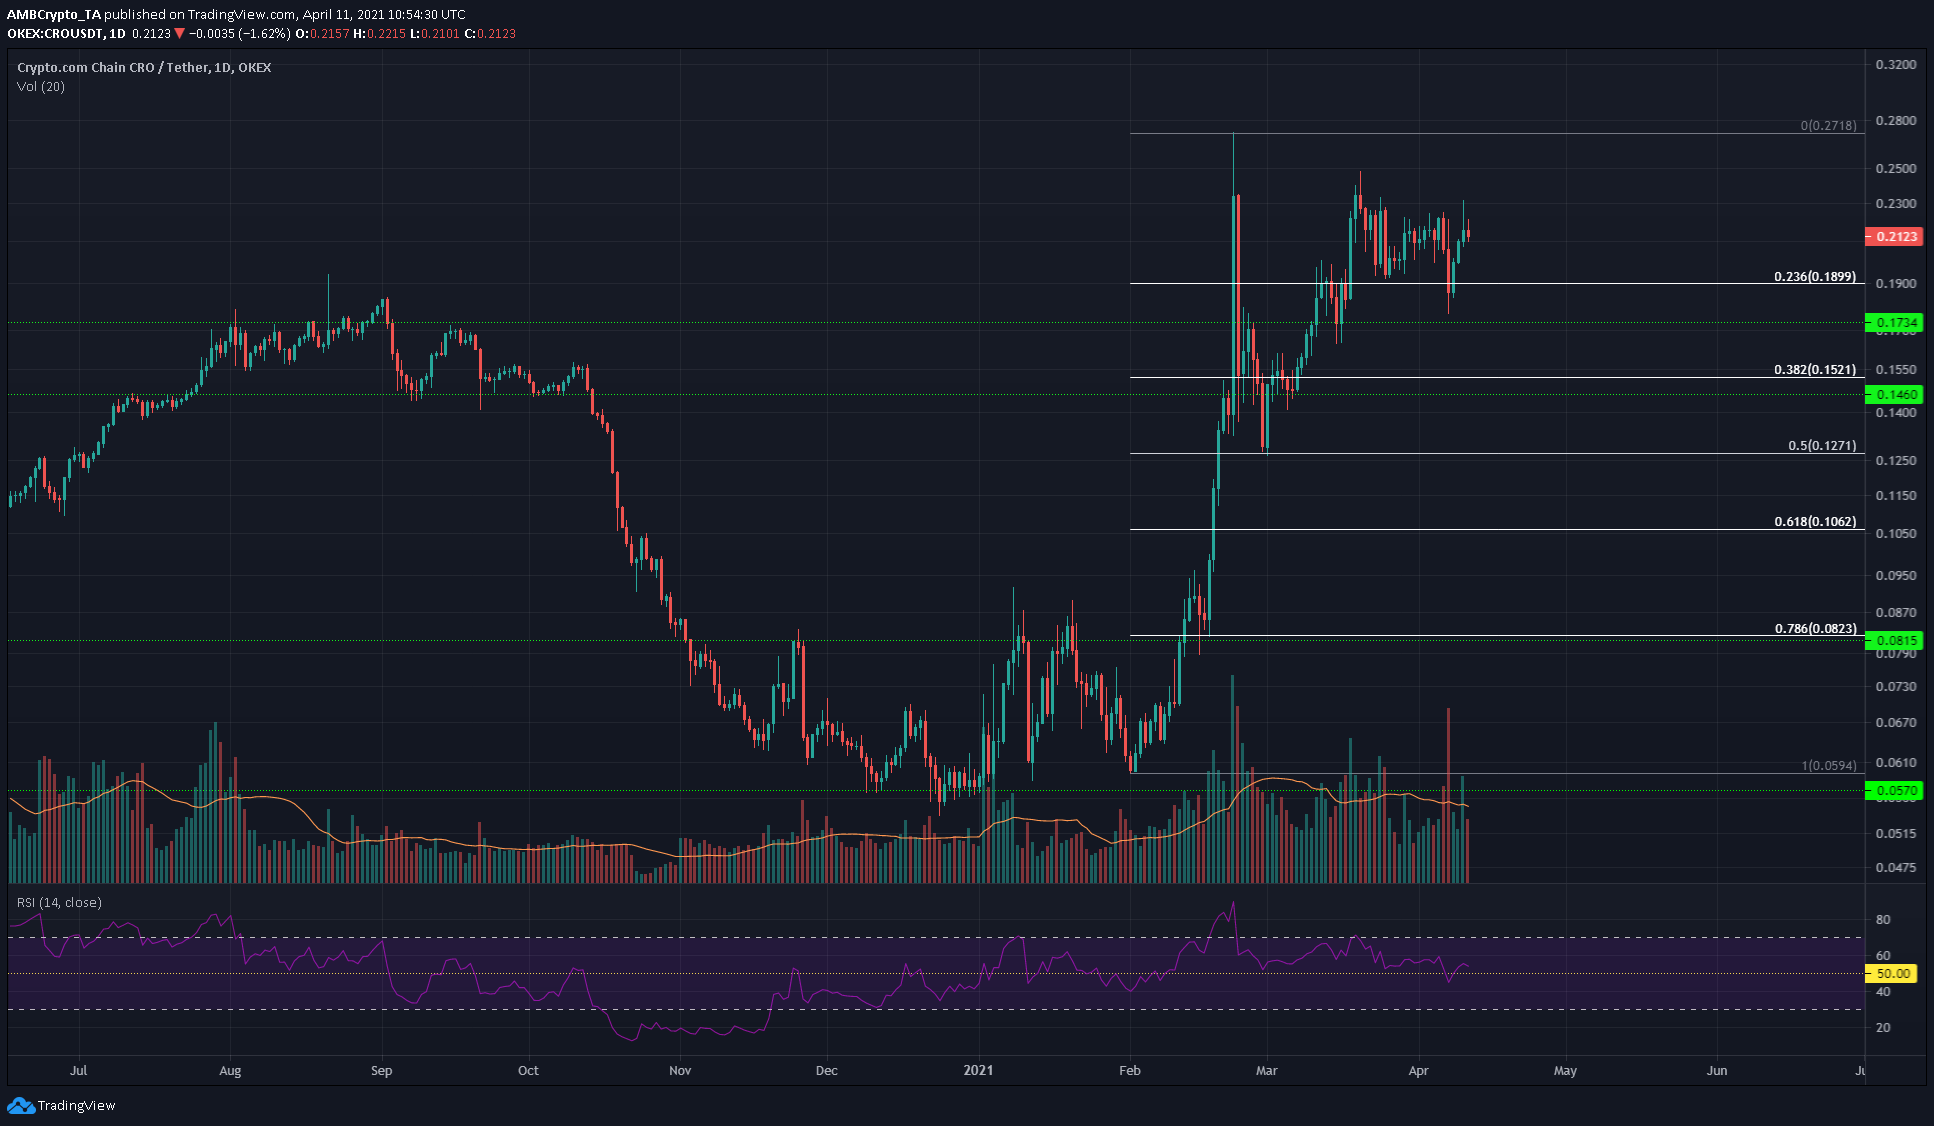
The daily timeframe was chosen to show where CRO was six months ago, and how it has recovered in the past two months. CRO slid from $0.1521 to $0.059 from October to December, and in February, climbed above the $0.08 mark to establish it as support and climb higher. This move saw CRO climb to $0.27 and it was trading at $0.21 at the time of writing.
The RSI was falling over the past few weeks and was oscillating about neutral 50 to show that momentum in either direction was not present. Trading volume has been consistently high, and a breakout past $0.23 could see another leg upward for CRO.
Monero [XMR]

Source: XMR/USDT on TradingView
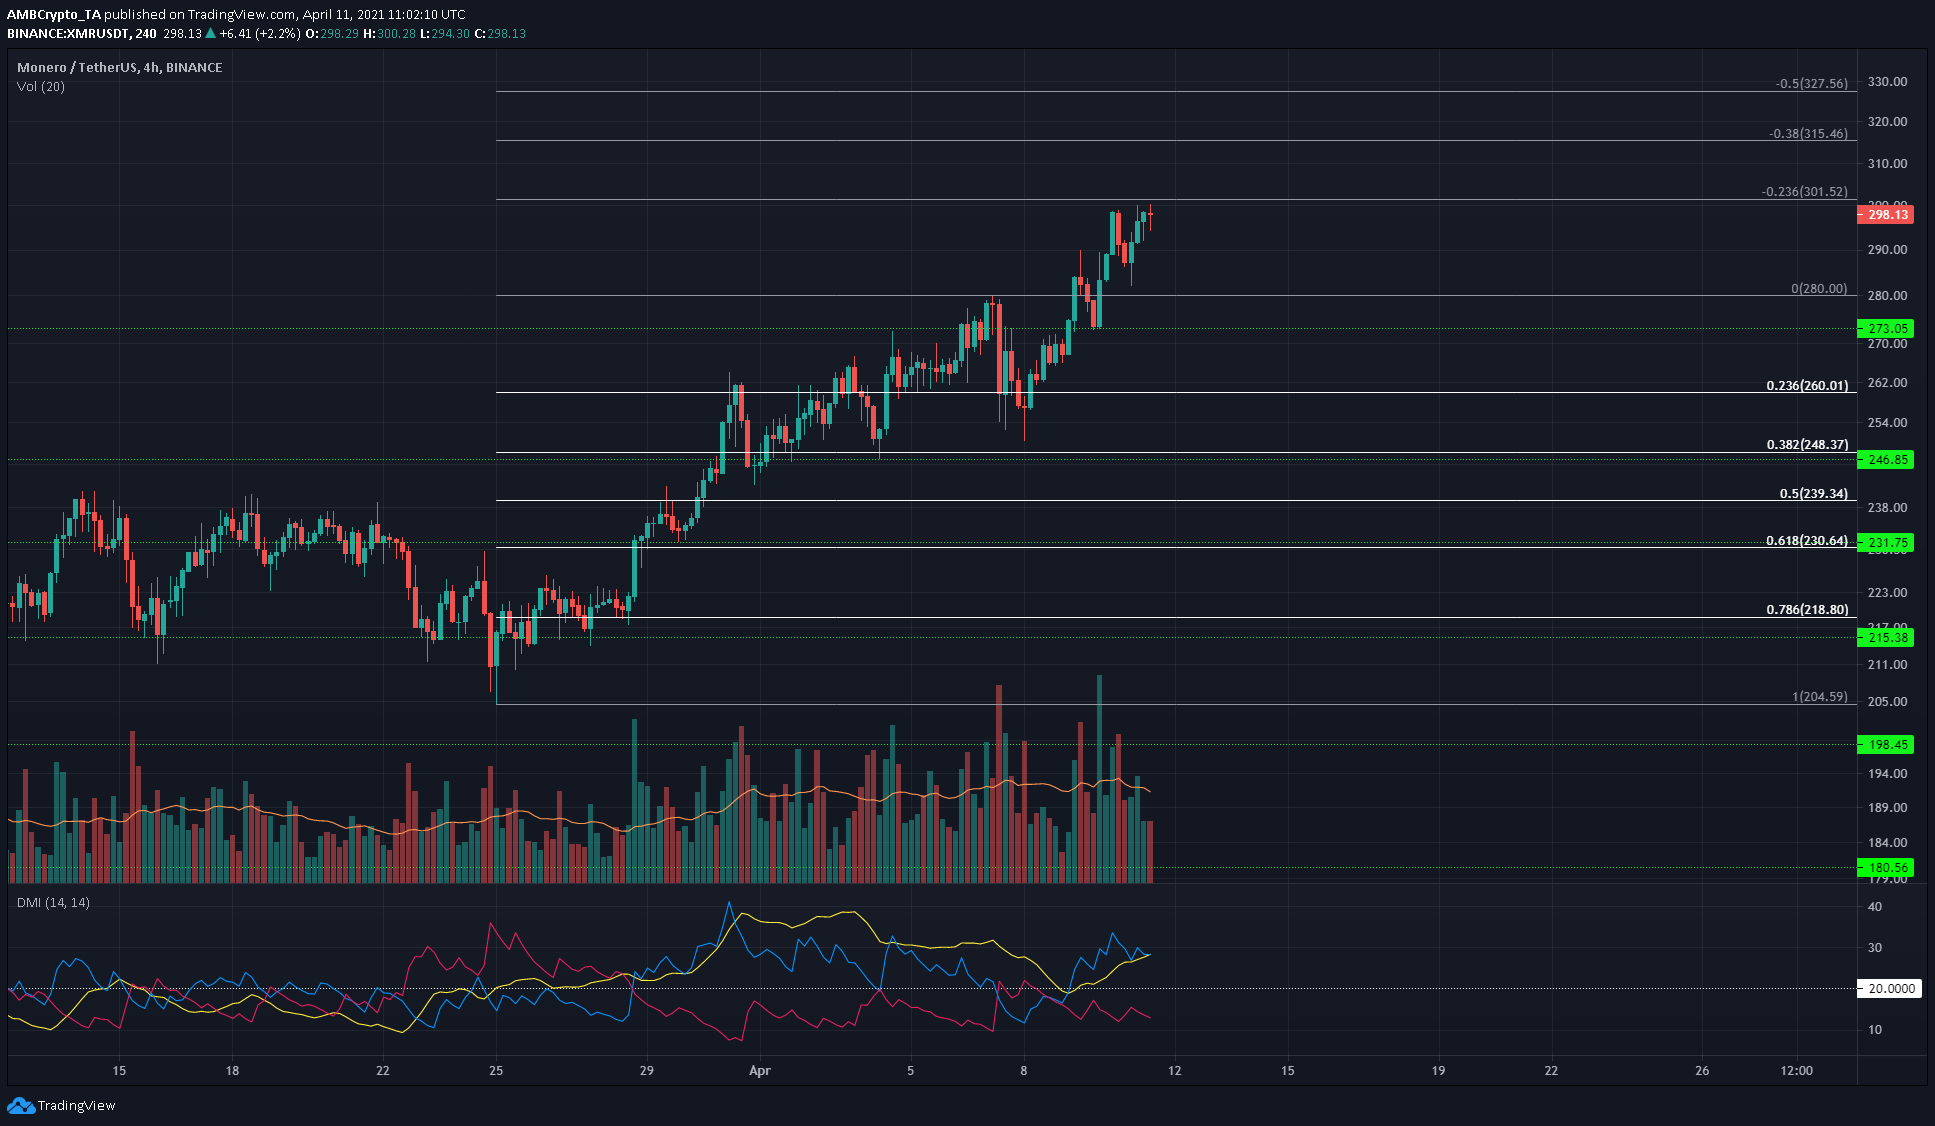
Monero is another coin in a strong uptrend. It flipped the $230 from resistance to support in the past two weeks and has surged to $300 since. $230 was significant resistance that had rebuffed XMR for nearly the whole of March.
The DMI confirmed the strong uptrend, with both the ADX (yellow) and +DI (blue) above the 20 value. Some Fibonacci extension level targets are plotted as well. A climb past the psychological $300 could see XMR surge quickly to $330.
Hedera Hashgraph [HBAR]

Source: HBAR/USDT on TradingView
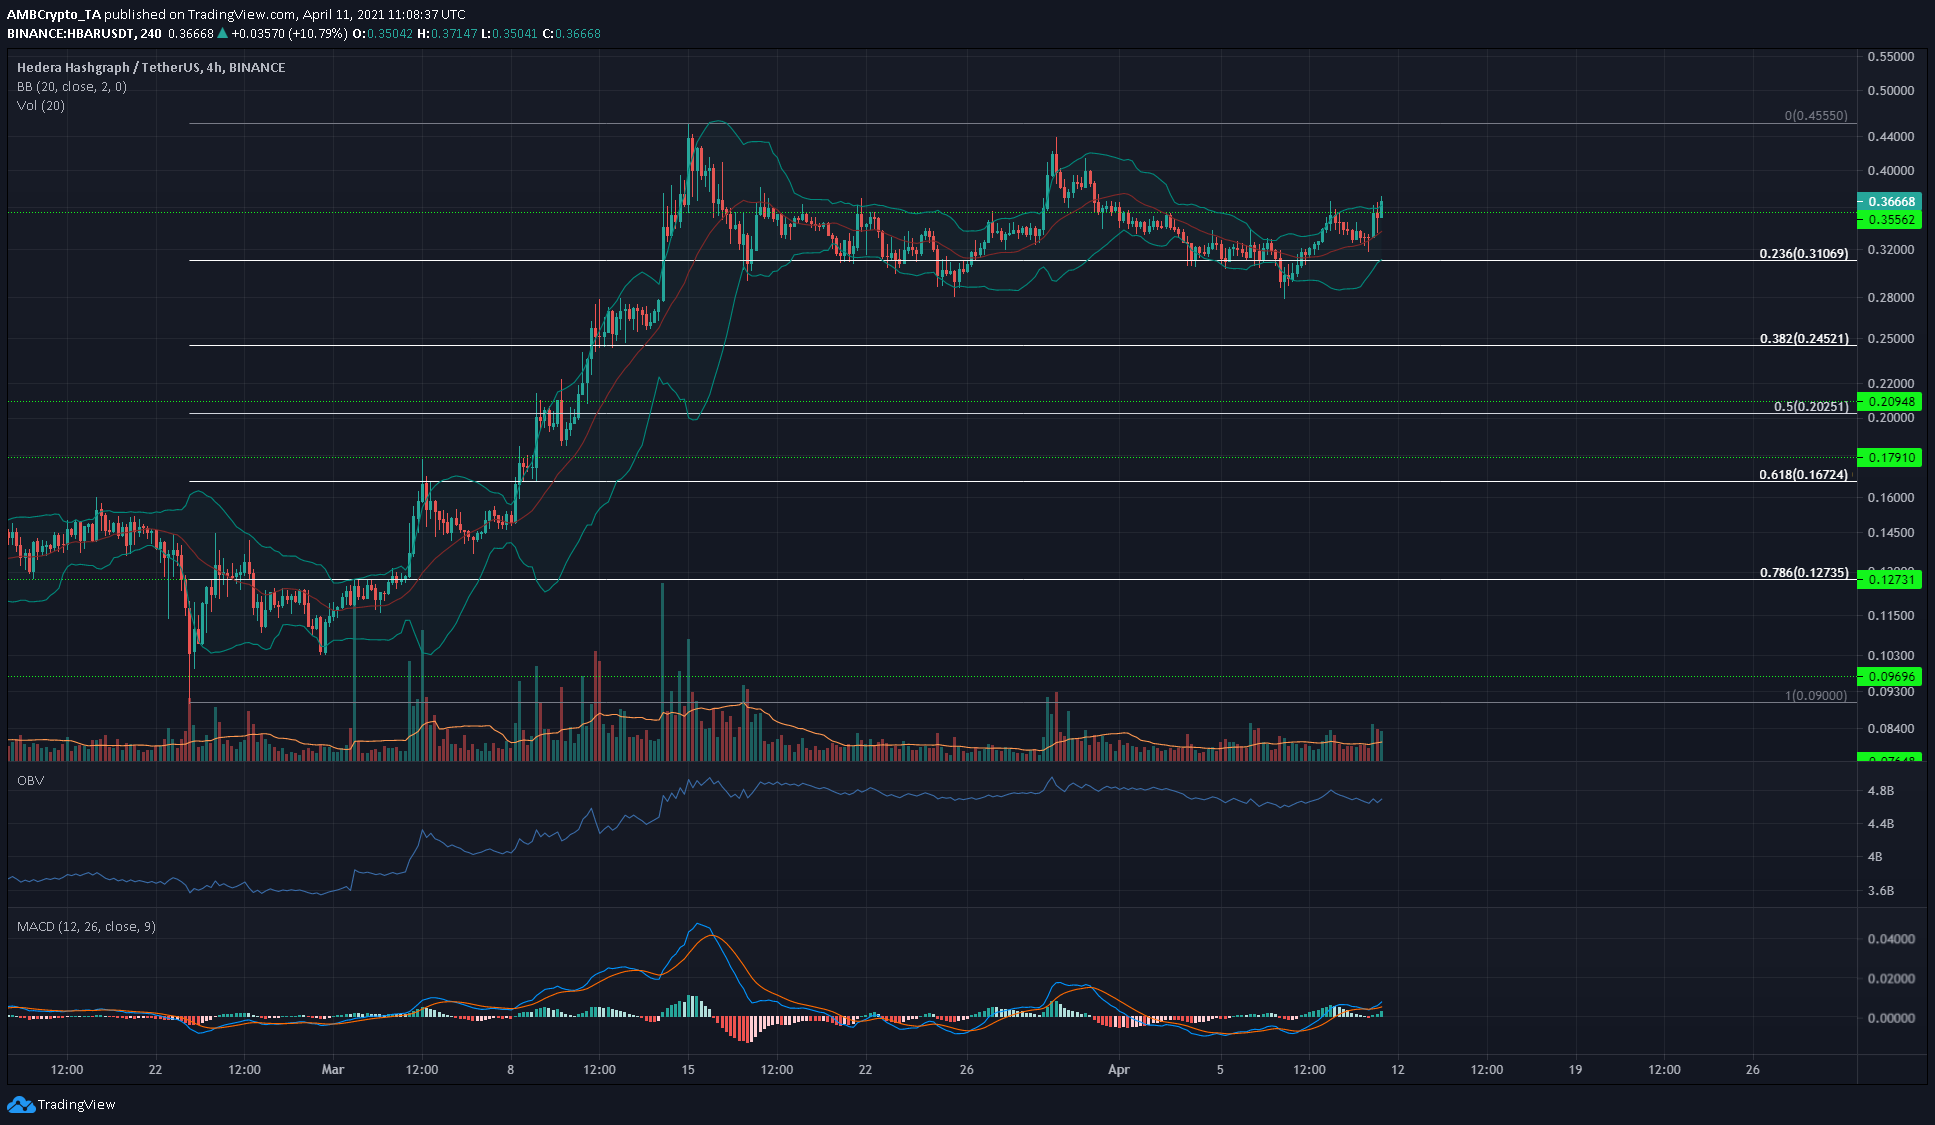
HBAR was in a phase of consolidation. The OBV showed that there was an equilibrium between buyers and sellers for nearly four weeks now, and this has not yet been broken by a wave of buyers or sellers yet.
The Bollinger band did show some volatility for HBAR as the price moved from $0.28 to $0.4, representing a 40% rise in value. However, in comparison to HBAR’s move from $0.1 to $0.45 in early March (+350%) this volatility appears subdued.
The MACD moved above the zero line and the MACD line began to rise quickly and this could be an early sign of a move to $0.4 in motion.


![Cardano [ADA] price prediction - 8% rally next, but here's why you should be careful!](https://ambcrypto.com/wp-content/uploads/2025/07/ADA-price-prediction-Featured-400x240.webp)