Decentraland, SAND, Axie Infinity price Analysis: 16 January

It may be early to assert a solid trend reversal until the bulls claw back to reclaim their lost supports. They still needed to infuse funds on increased volumes to bolster a promising rally.
MANA formed an ascending triangle but could not back it up with an increased OBV. On the other hand, SAND and Axie Infinity seemed to slow down their recovery as they entered into a low volatility phase.
Decentraland (MANA)
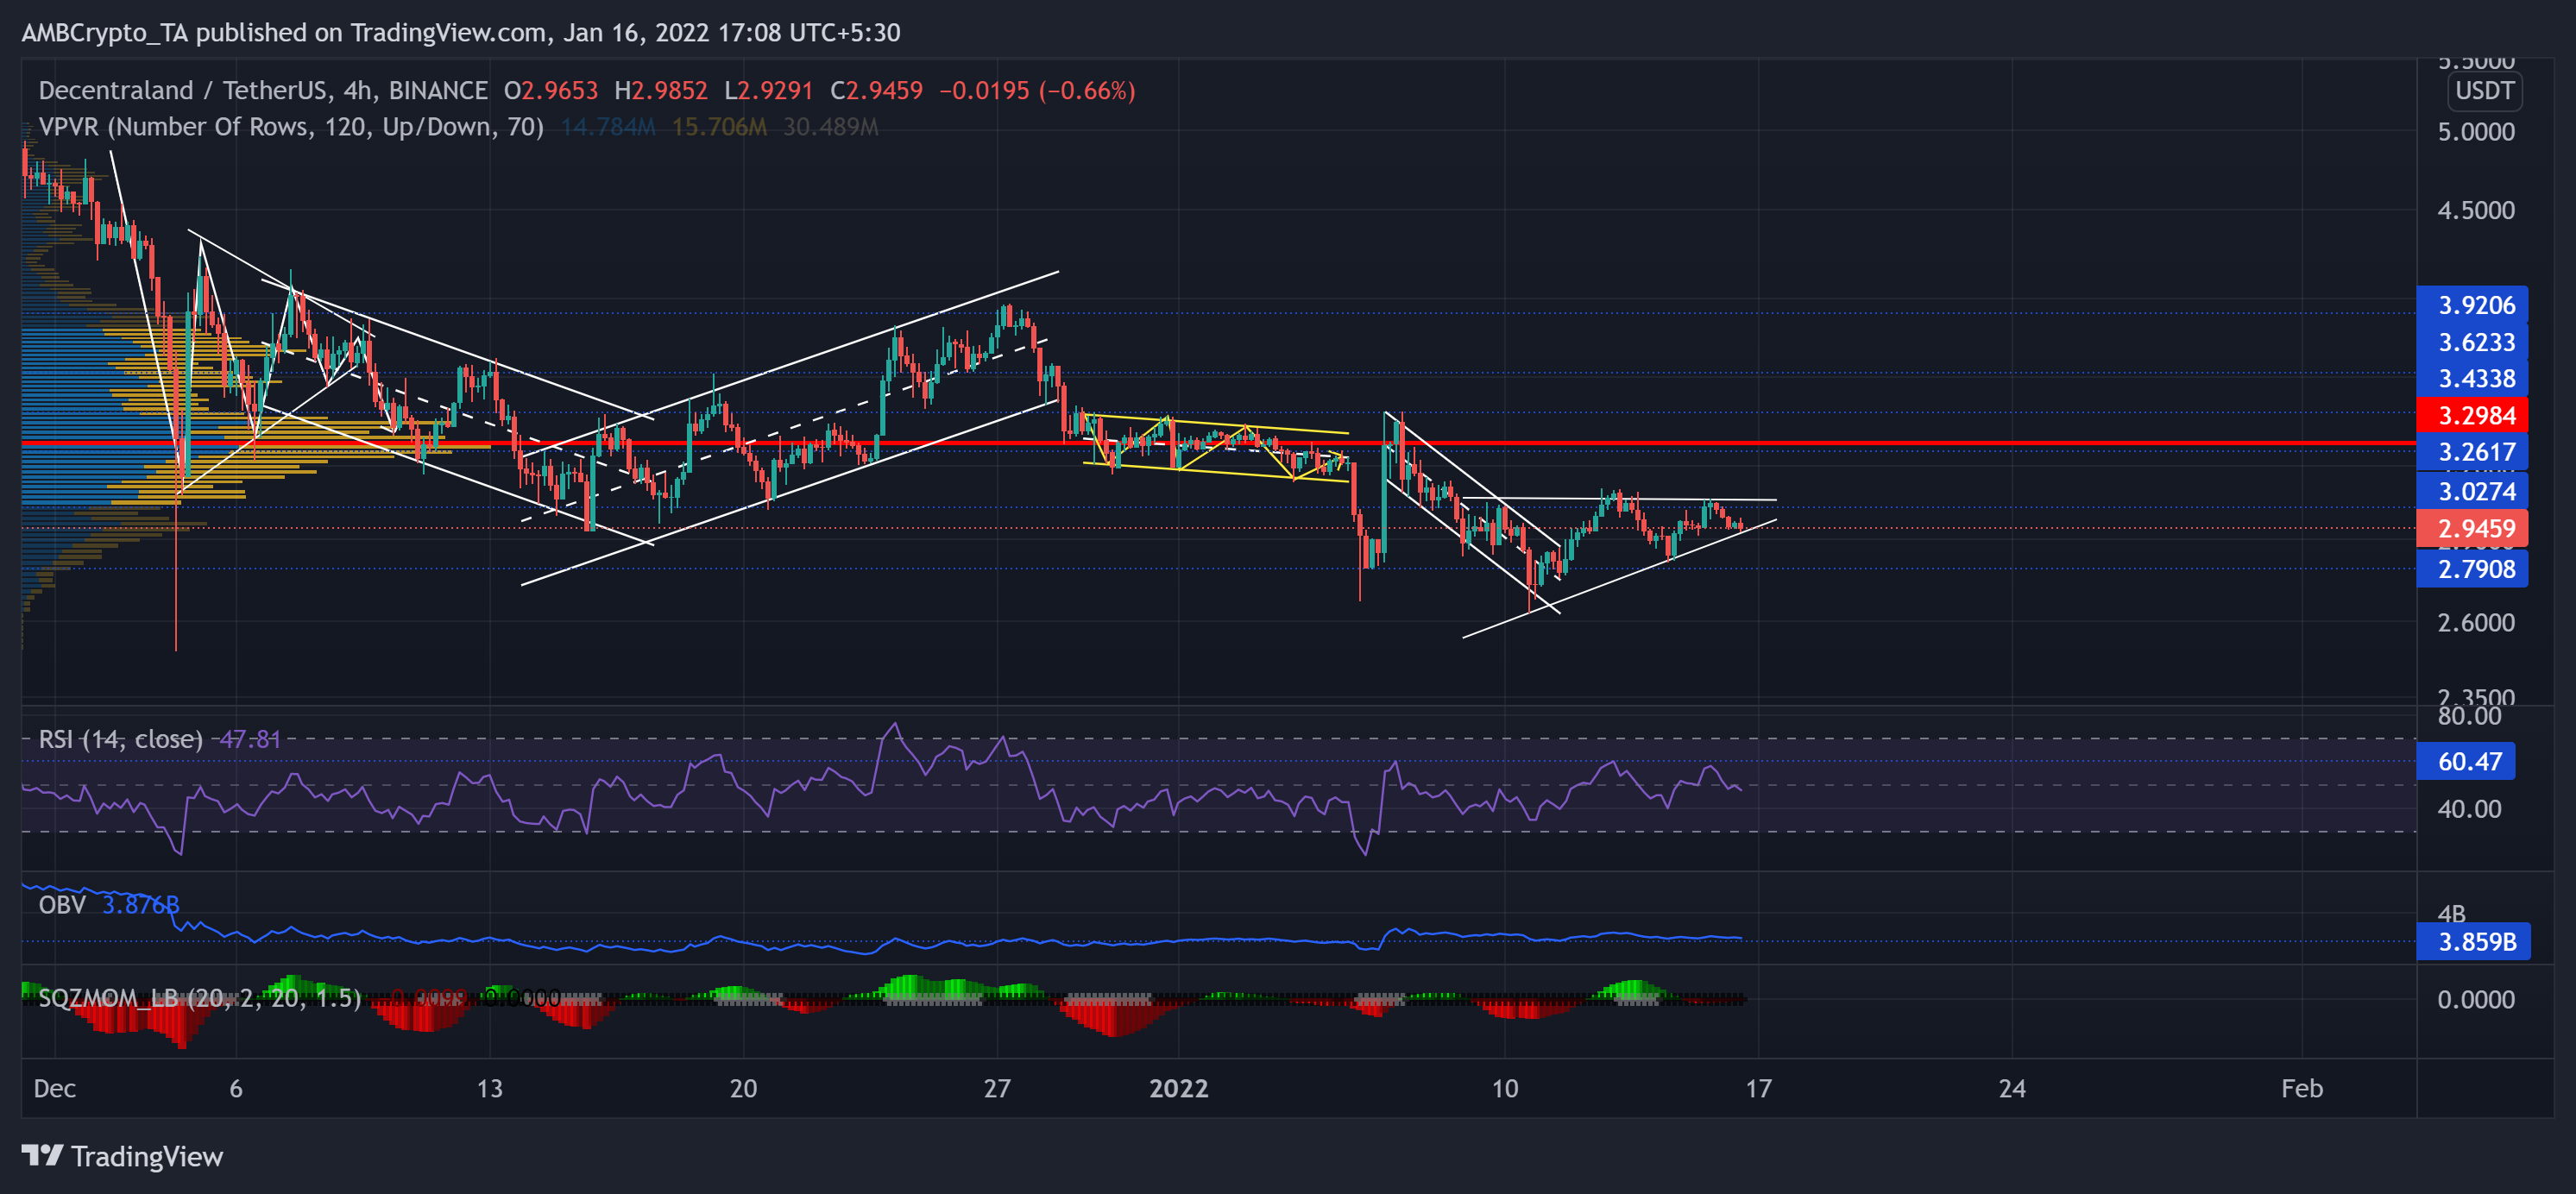
On its 4-hour chart, the alt saw a breakdown from the down-channel (yellow) after testing the Point of Control (red). Thus, it steeply plunged until the $2.7-mark two-month support in a down-channel (white).
Then, after poking its five-week low on 10 January, the alt marked higher troughs while maintaining the $3.02-mark peak. Hence, forming an ascending triangle on its 4-hour chart. Now, the immediate testing grounds stood at the lower trendline (white).
At press time, MANA traded at $2.9459. The RSI tested the 60-mark once again before a sharp dip below the midline. At the time of writing, it skewed towards neutrality. Besides, the OBV did not mark a corresponding spike, hinting at a weak revival attempt. Also, the Squeeze Momentum indicated a low volatility phase in the near term.
The Sandbox (SAND)
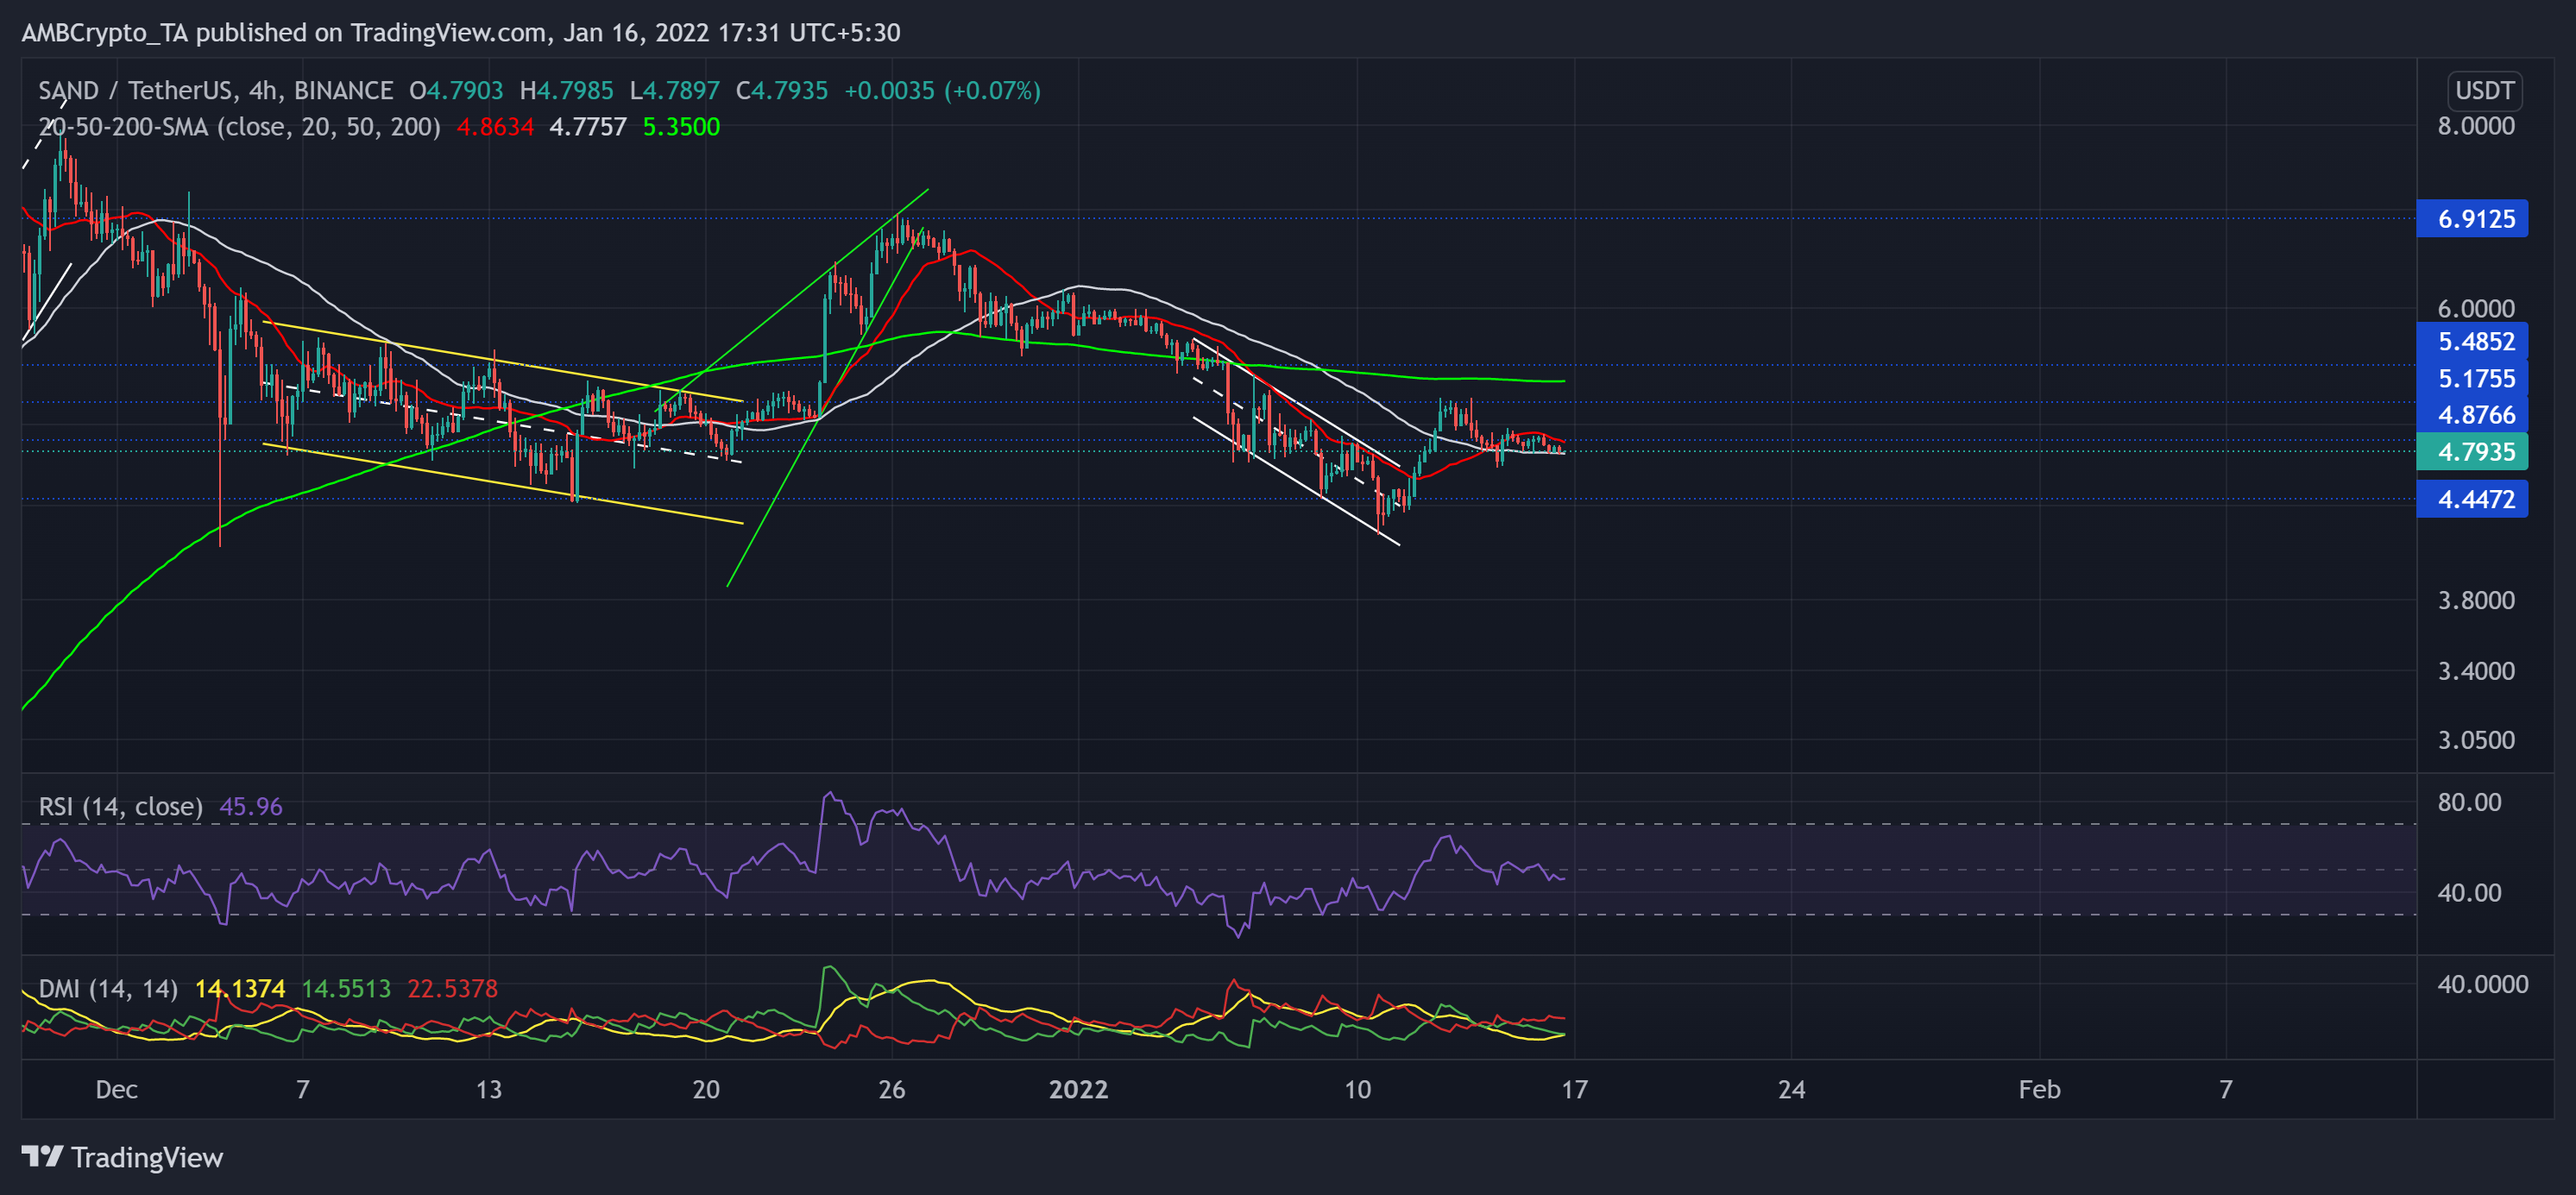
SAND bulls could not defend the $6.03-mark as support after the alt saw an expected rising wedge (green) breakout on its 4-hour chart. It saw a 39.64% retracement (from 26 December high) until it poked its six-week low on 10 January.
During the recovery phase, the 22.8% jump (from 10 January) halted at the $5.17-mark. Any further pullout would find support near the $4.44-mark. The 20-SMA (red) acted as an excellent resistance for the past day as the bulls struggled to counter it.
At press time, the alt traded at $4.7935. The RSI was at the 46-mark and stood weak near the equilibrium for the past three days. It displayed a slight bearish bias. While the DMI hinted at a bearish preference, the ADX displayed a weak directional trend for SAND.
Axie Infinity (AXS)

The Ethereum-powered gaming crypto noted a 6.53% gain on its charts in the last 24 hours. Since striking its ATH on 6 November, AXS steadily declined as it lost $121.1 and the $161.5-mark range.
The 5 January sell-off led AXS to lose its three-month support (now resistance) at $79.4-level. With the recent down-channel (white) breakout, the alt reclaimed 23.3% of its value from (from 10 January) and jumped above its 20-50 SMA.
At press time, AXS traded 51.7% below its ATH at $79.33. The RSI saw a solid upturn but took a dip from the overbought region and showed slowing signs. Also, the DMI lines exhibited an inclination for buyers, but the ADX was weak. This reading indicated a substantially weak directional trend for the alt.