Tron, Cosmos, Fantom Price Analysis: 16 January

While the broader market refrained from high volatility in the past 24-hours, Cosmos and Fantom eyed to retest their ATH level. Their near-term technicals chose the buyers. But both their CMFs could barely cross the equilibrium.
Similarly, Tron saw overbought readings on the Bolinger bands and saw a near-term pullback.
Tron (TRX)
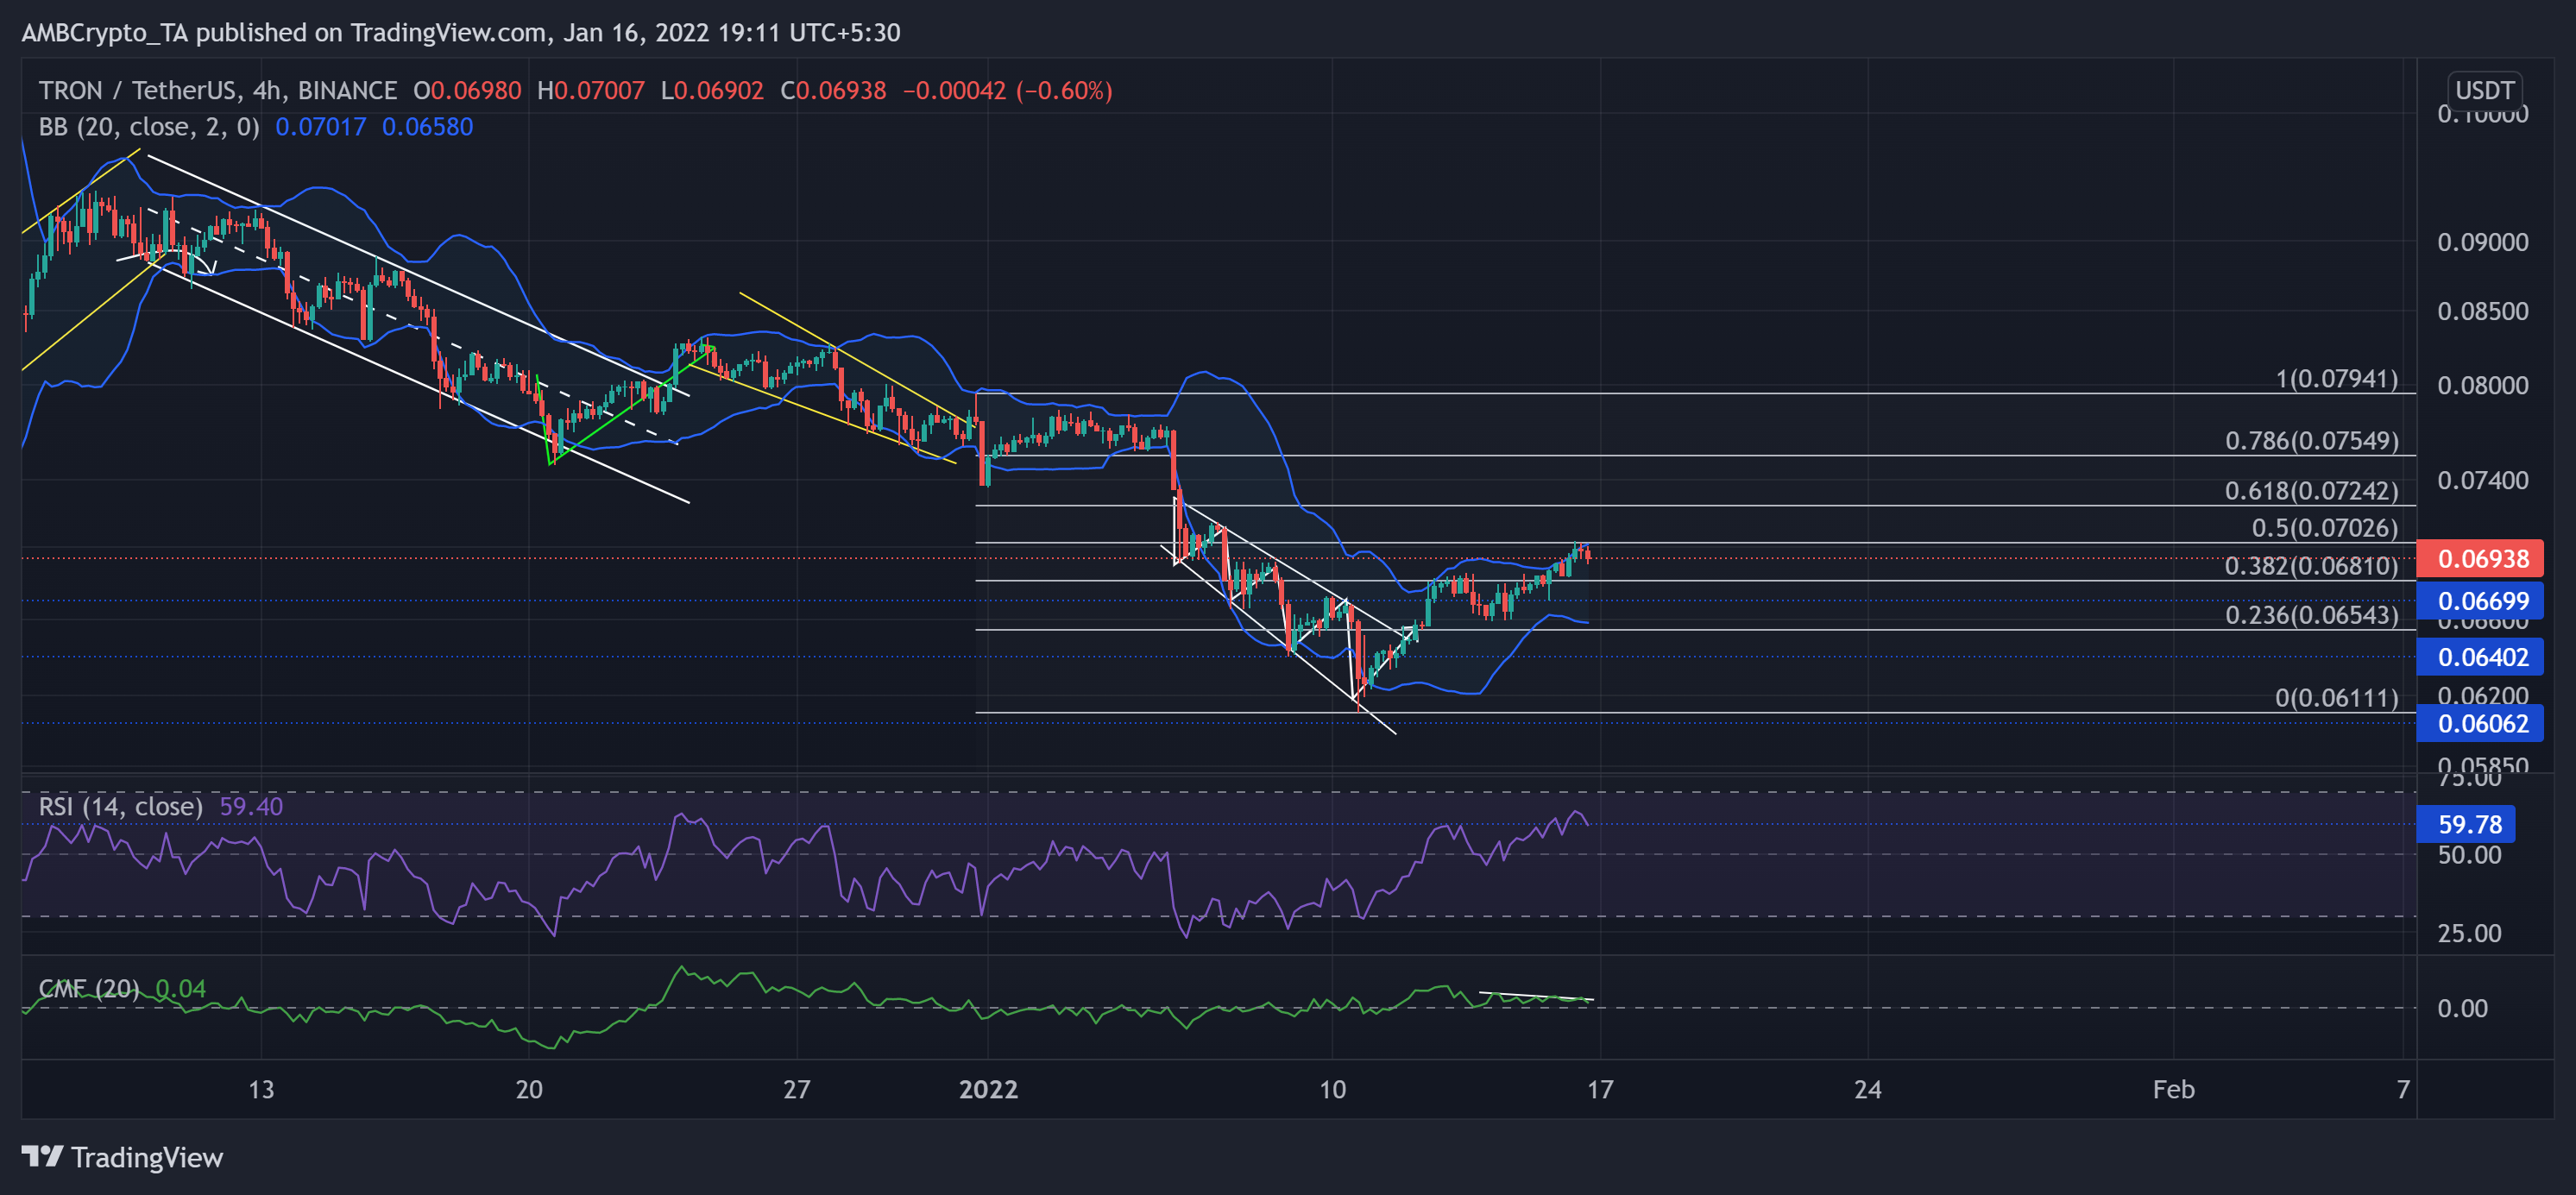
The buyers finally stepped in and initiated a patterned breakout after TRX poked its five-month low on 10 January. Since then, the alt grew by nearly 13.9% and found near-term resistance at the 38.2%, 50% Fibonacci level.
Now, the immediate resistance stood near the upper band of the Bollinger Bands. Although the bulls reclaimed the vital $0.0669-mark support, the CMF did not mark higher peaks and wavered near the zero-line. This reading meant the buying pressure could not correspond to the price increase.
At press time, TRX traded at $0.06938. After breaking out from the midline, the RSI finally crossed the 59-mark. But at the time of writing, it seemed to lose its vigor.
Cosmos (ATOM)
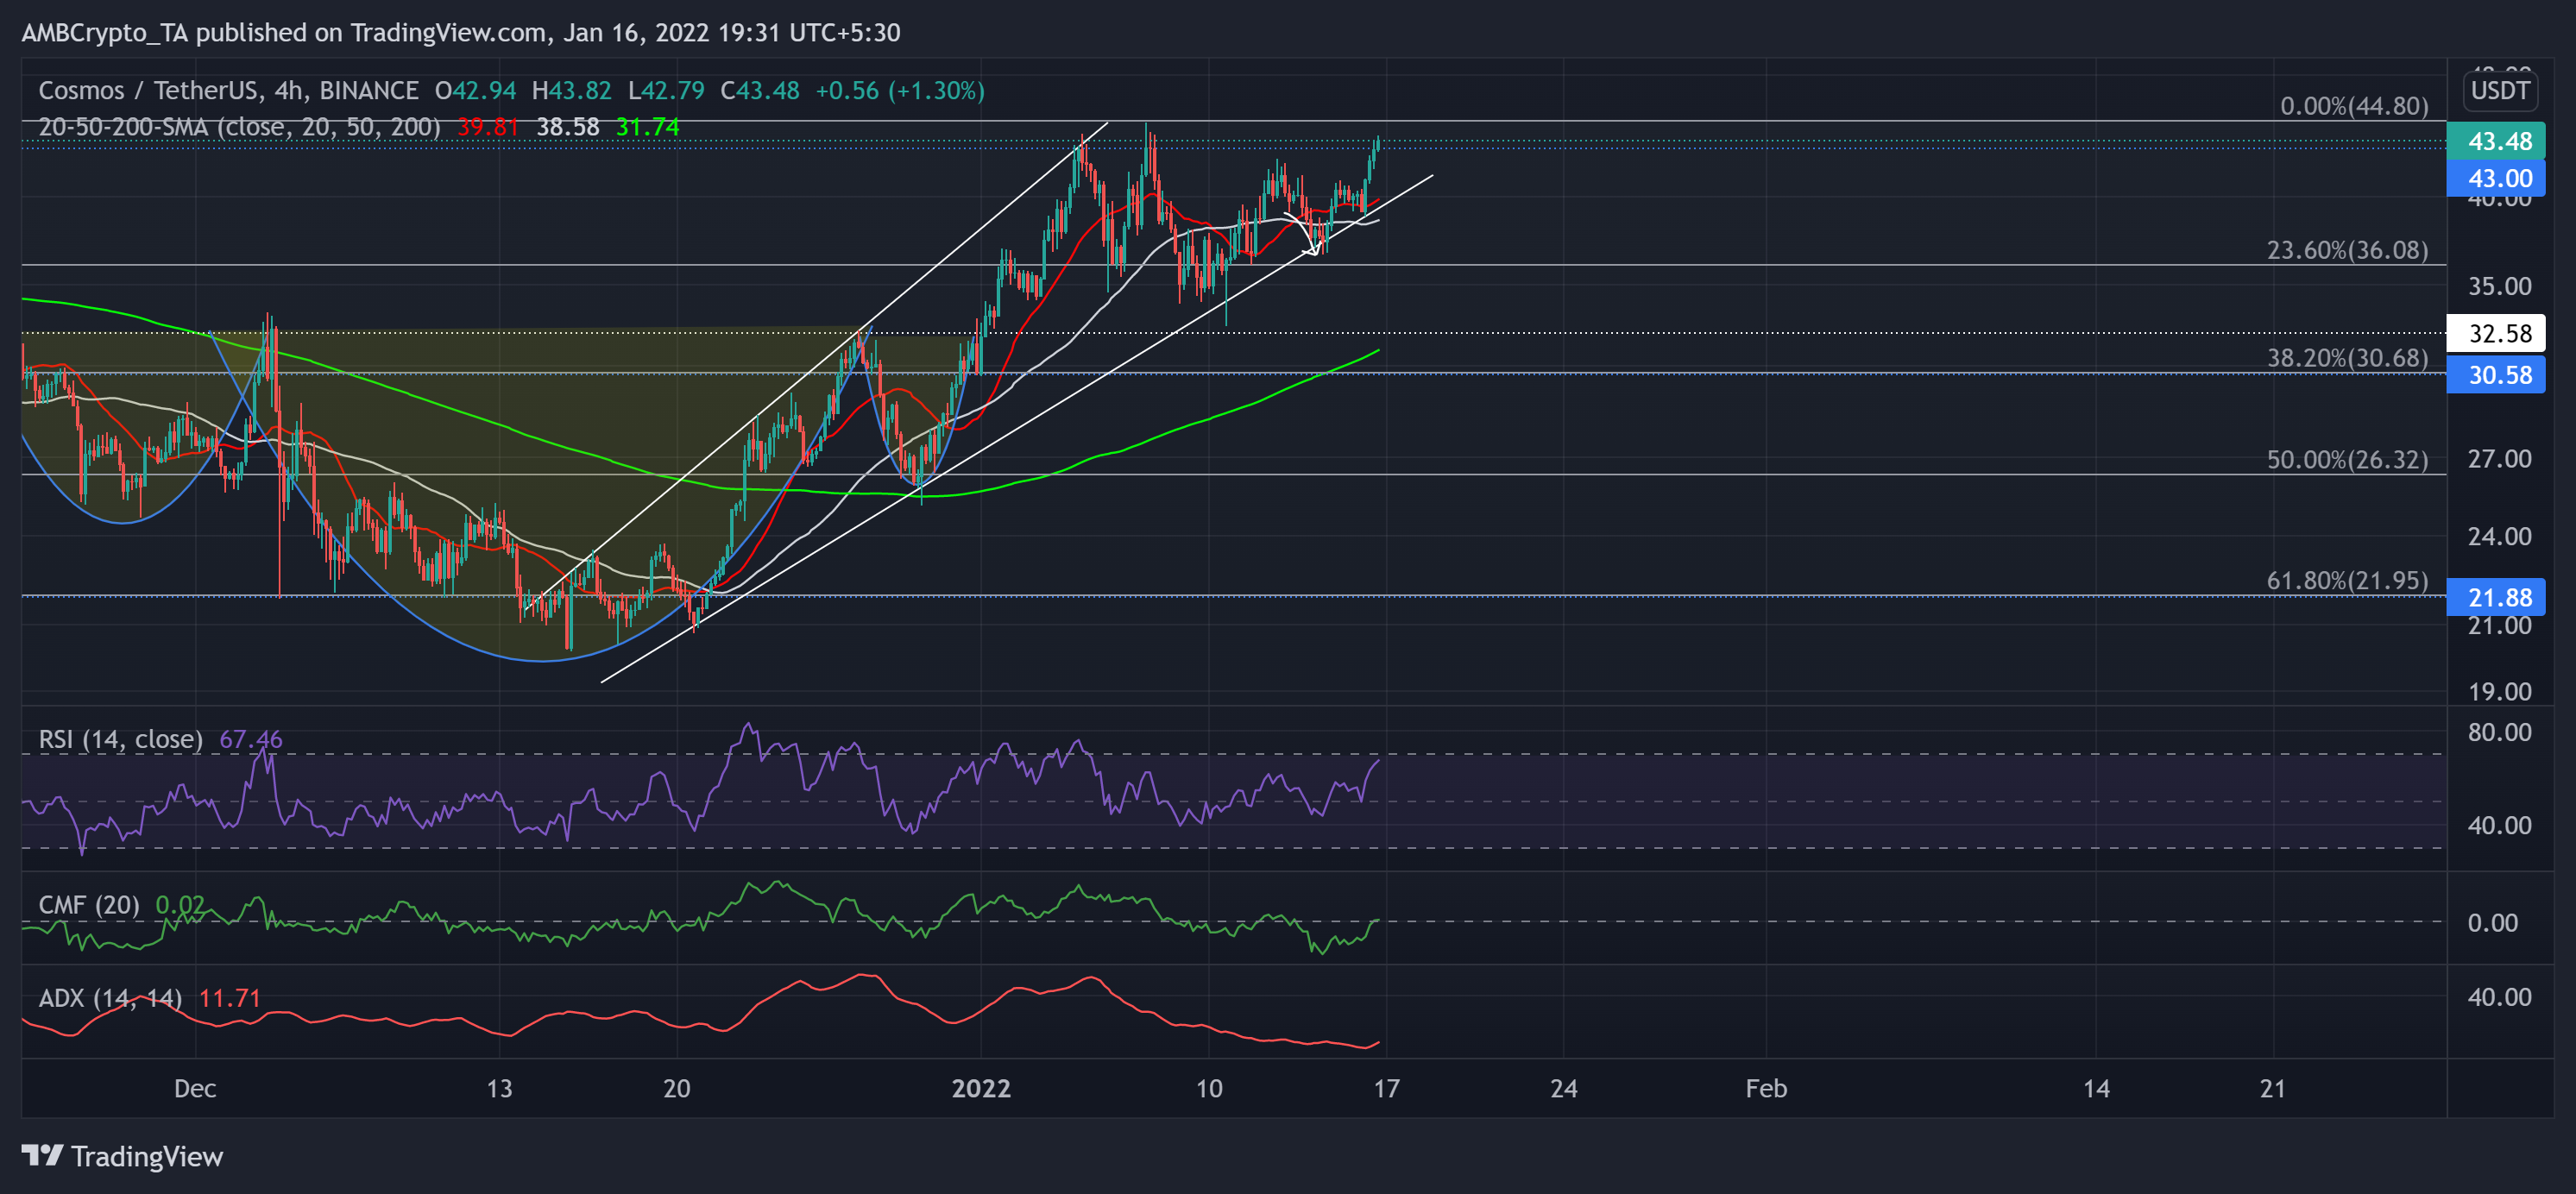
After retesting the $32.5-support for over seven weeks, the bulls finally initiated a sustained inverse head and shoulder breakout on 1 January.
The alt jumped by over 35% (from 1 January) and poked its 15-week high on 7 January. This incline helped ATOM reclaim its long-term 23.6% Fibonacci support at the $36-mark.
The alt formed an ascending broadening wedge (reversal pattern, white) on its 4-hour chart over the past month. Now, as the 20-SMA (red) crossed its 50-200 SMA, ATOM depicted an increasing buying influence.
At press time, ATOM traded only 2.6% below its ATH at $43.48. The RSI flashed a bullish bias by consistently marking higher peaks. It now aimed to retest the overbought region. Interestingly, the CMF barely crossed the zero-line, indicating inadequate money flow. To top it up, the ADX displayed a weak directional trend.
Fantom (FTM)
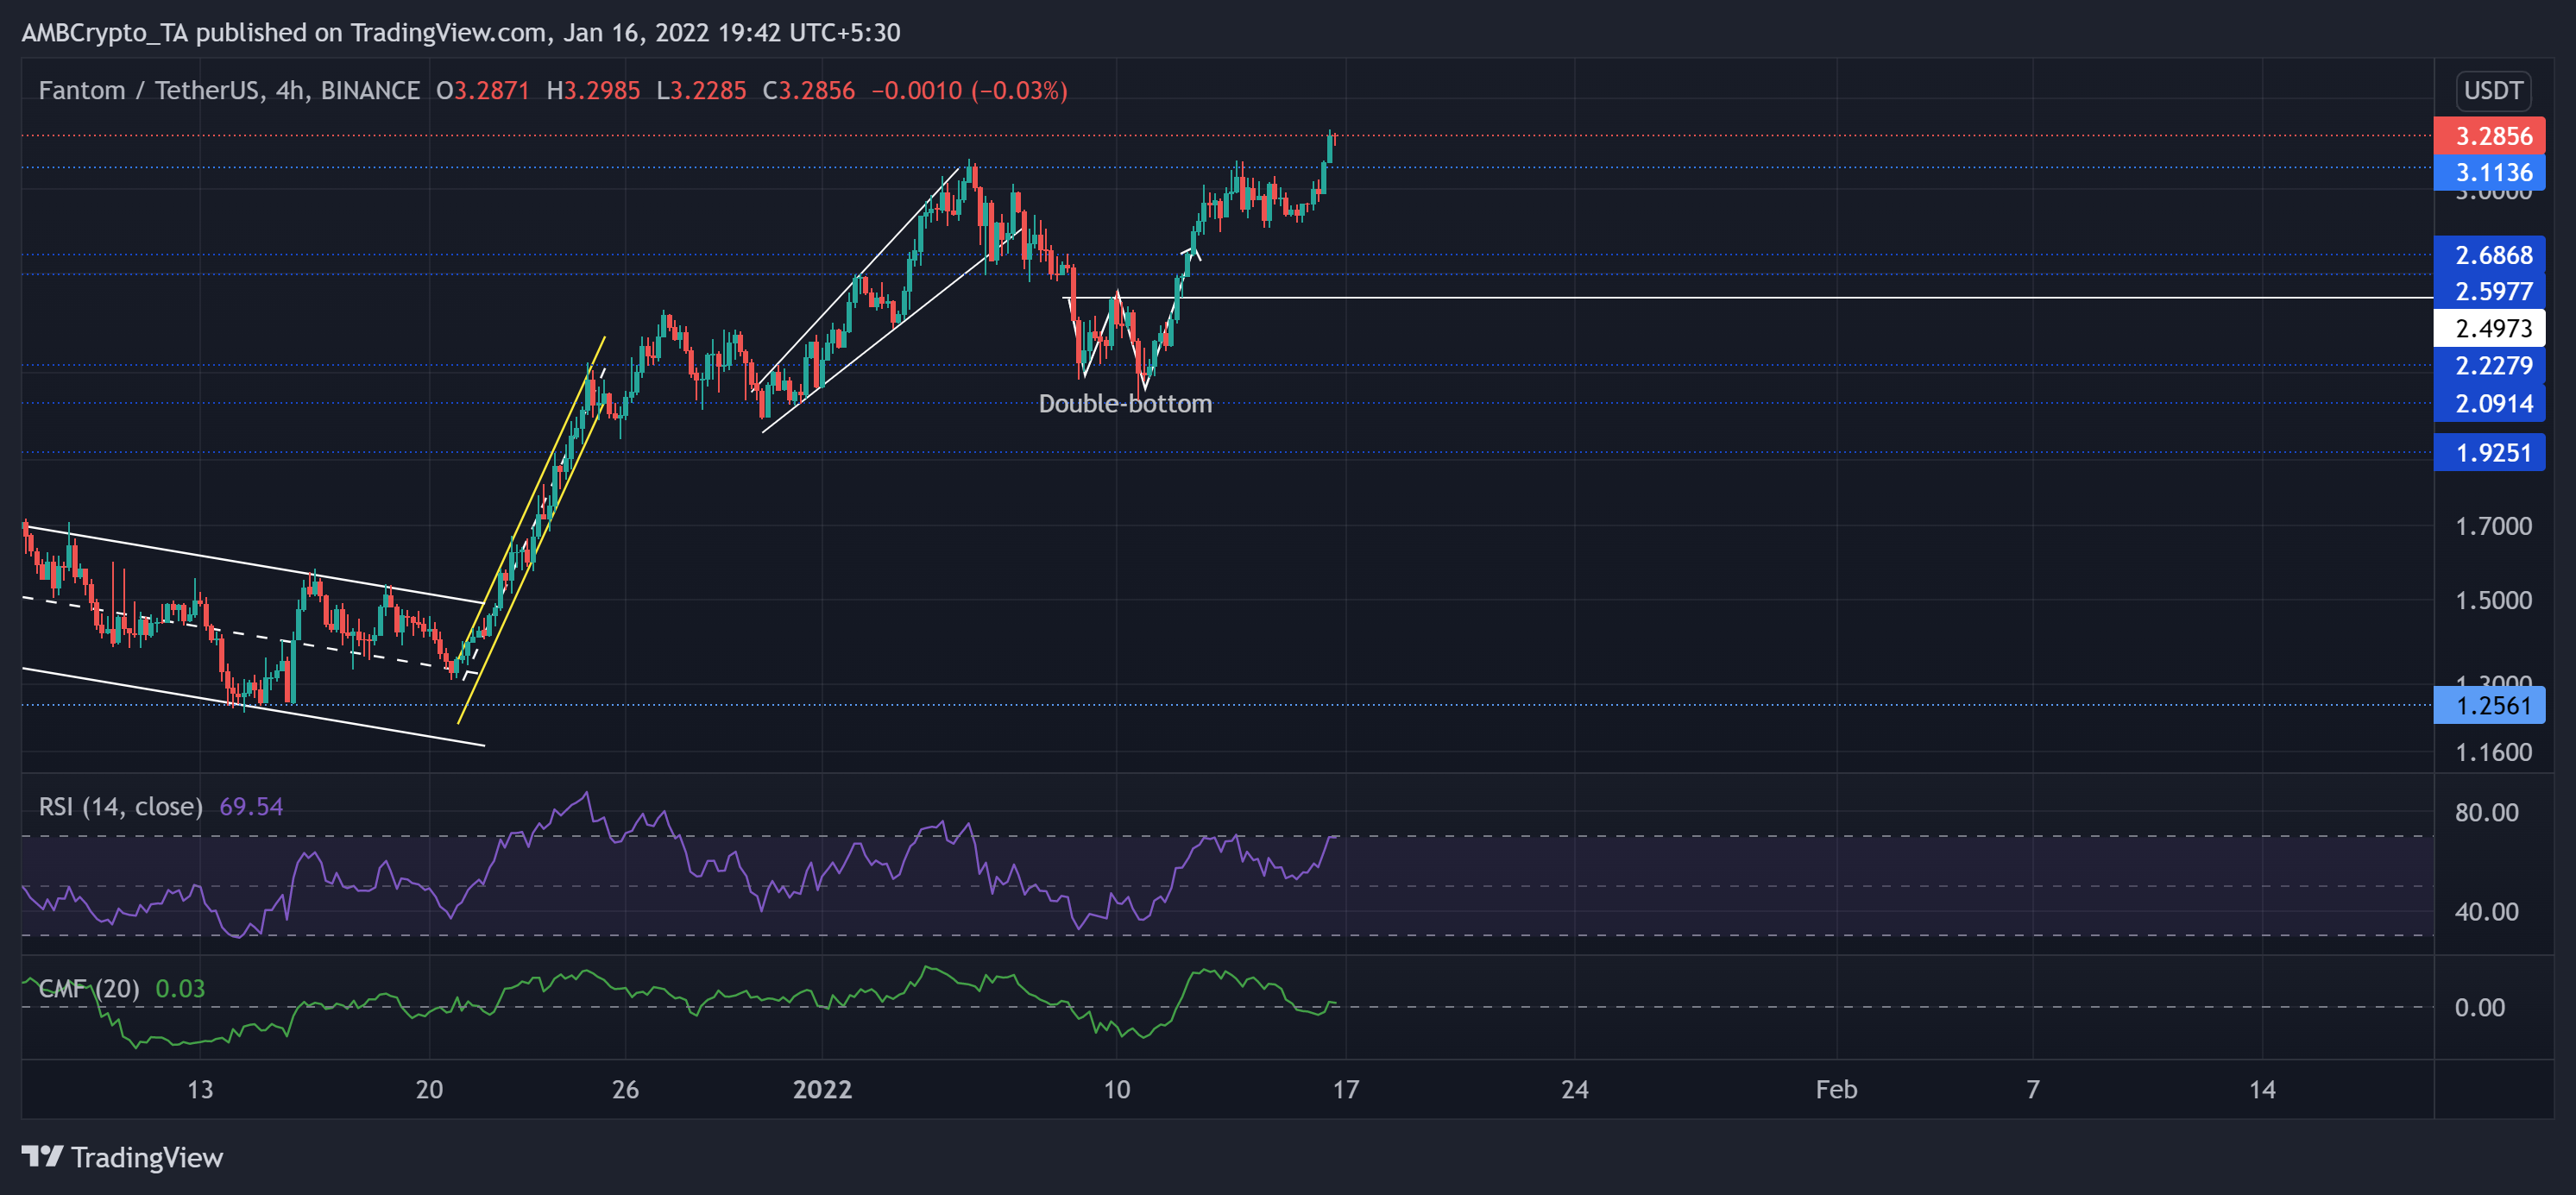
The ascending broadening wedge (white) saw a break down after FTM poked its two-month high on 5 January. Since then, the alt lost nearly 34.1% of its value to find testing grounds at the $2.22-mark.
From here, it recovered more than the value it lost after forming a classic double-bottom on its 4-hour chart. FTM gained a staggering 57.12% ROI from the 10 January low until press time.
At press time, FTM traded at $3.2856. The RSI surged by over 18 points over the past day moved near the overbought region. It displayed sideways tendencies before a possible reversal. Similar to ATOM, the CMF barely crossed the zero-line.