Decentraland: This pattern can influence MANA’s short-term movements

After Decentraland [MANA] plunged from the $1.9-level, the sellers have kept a strong check on all the buying rallies over the last month. A string of lower peaks chalked out a long-term trendline resistance (white, dashed). This line has reaffirmed MANA’s long-term trend in the favor of sellers.
With a descending triangle cropping up on the 4-hour timeframe, any close below the $1.03-support would position the alt for a near-term setback. At press time, MANA traded at $1.0259, down by 9.01% in the last 24 hours.
MANA 4-hour Chart
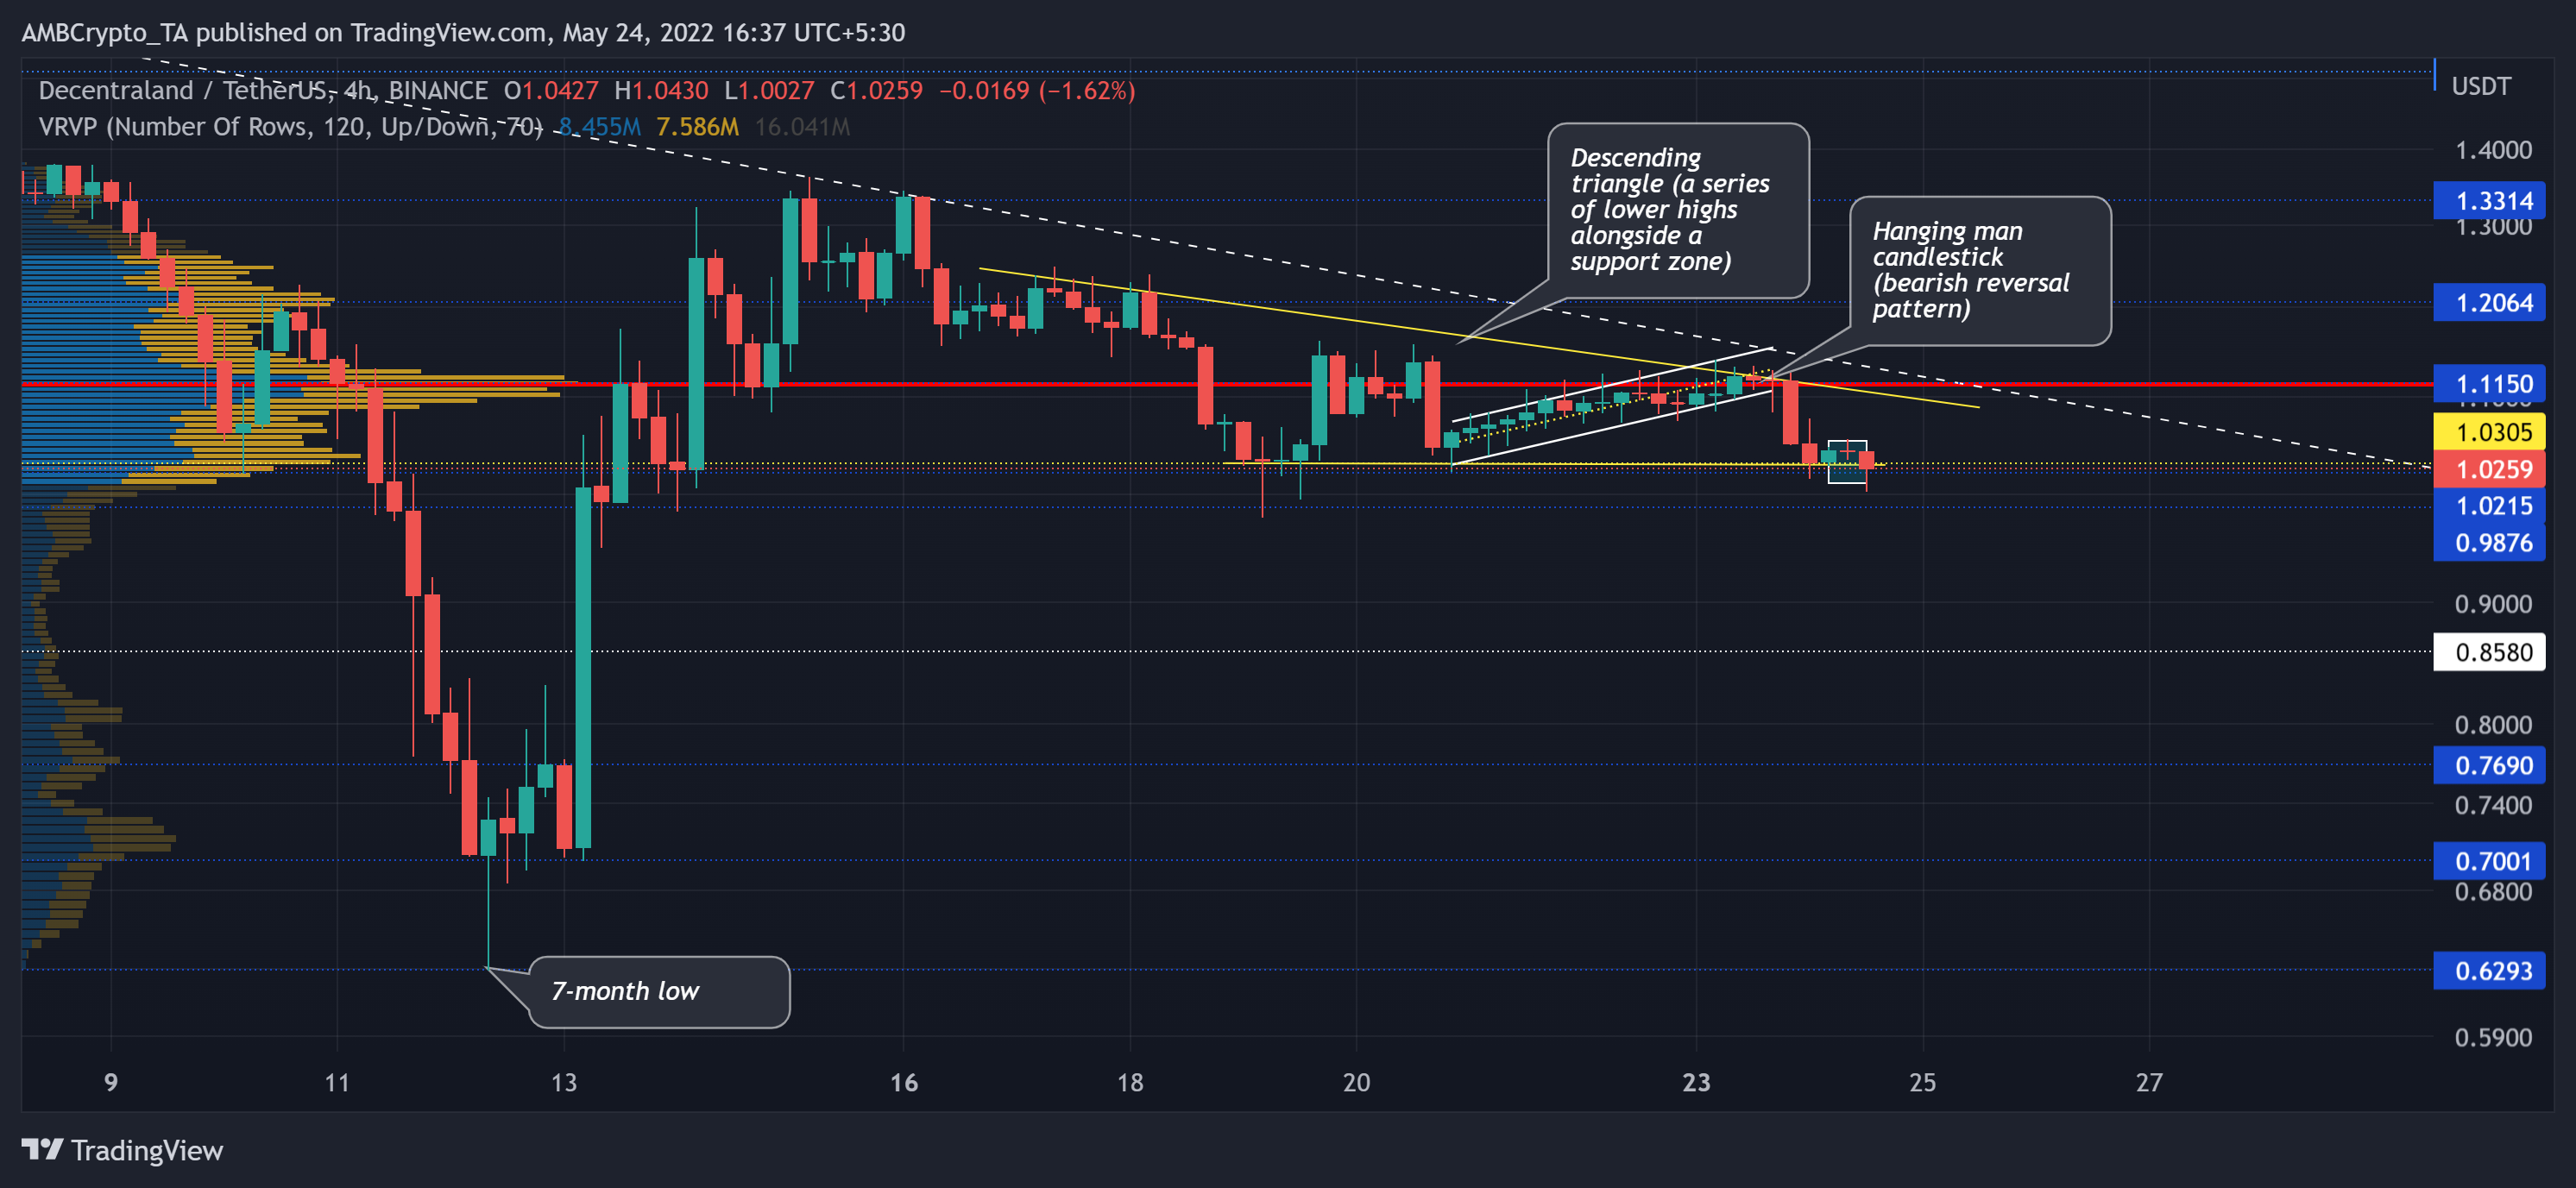
After tumbling from the $2-zone, the selling pressure started to mount up on the $1.9-level. As a result, the sellers quickly imposed a downhill rally all the way toward the $0.6-$0.7 range. The altcoin took a dive to poke its seven-month low on 12 May.
While the bulls did propel a strong buying rally, the month-long trendline resistance shunned the bullish pressure. This descent saw an expected plateau phase near its Point of Control (POC, red). Now, with a series of lower highs hitting the $1.03-mark support, the sellers have yet again depicted their superior strength.
Should the current candlestick close below the $1.03-level, it would affirm an Evening star candlestick pattern and could spiral to short-term losses. If the bulls hold on to their grounds at the $1.02-level, MANA could see a continued tight phase near its POC. However, losing the $1.02-mark could invite an undesired steep drop toward the $0.8-level.
Rationale
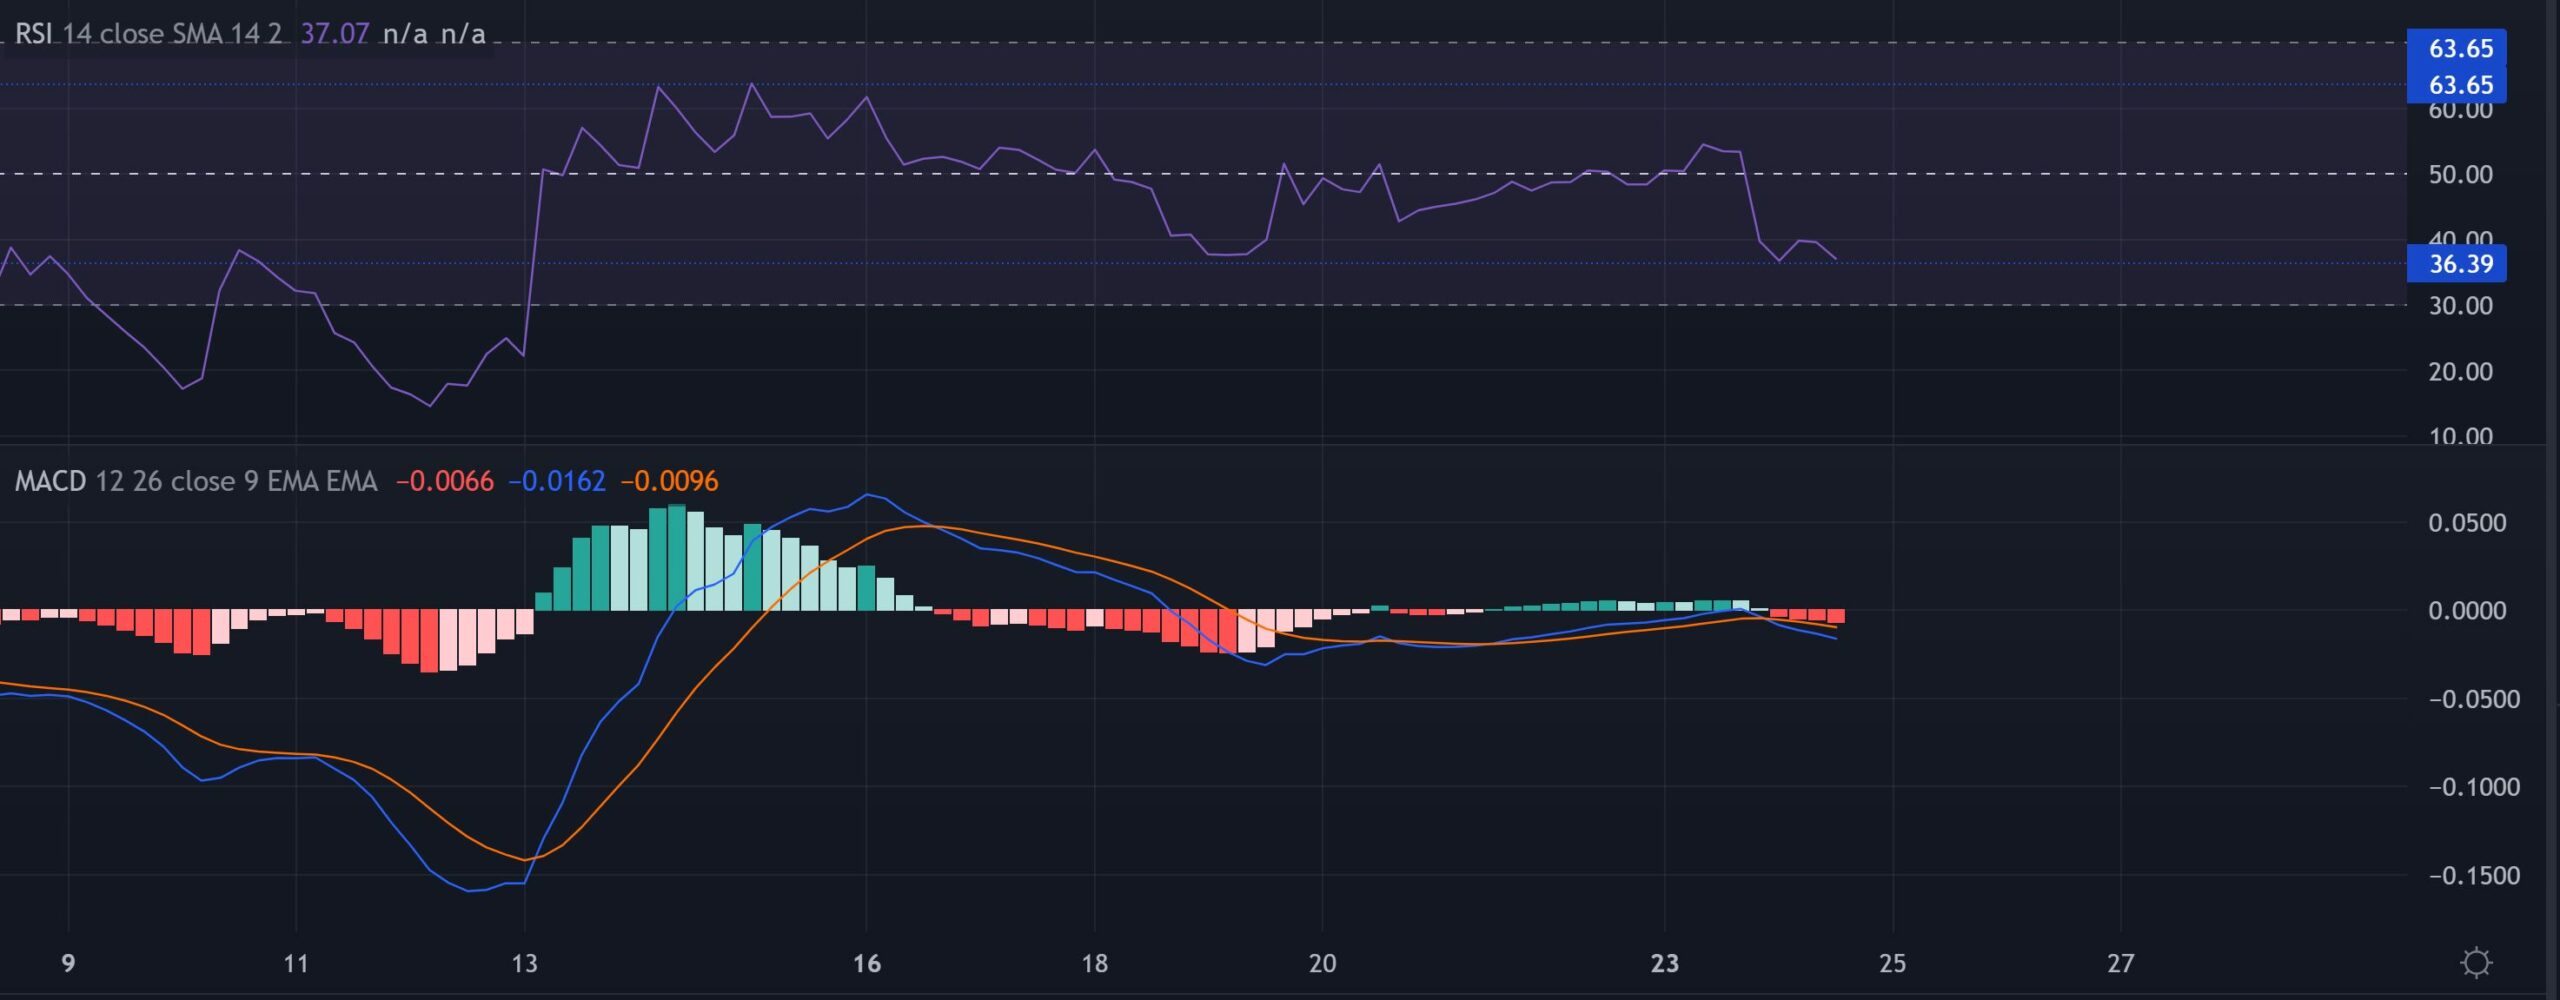
The Relative Strength Index failed to sustain itself above the mid-line while testing the 36-mark support. An inability of the buyers to ensure this level could give the bears more edge in the near-term price movements.
With MACD lines taking on a bearish crossover on 23 May, their south-looking tendencies seemed to reignite some selling pressure.
Conclusion
In light of a descending triangle setup alongside the chances of evening star candlesticks, MANA could see a near-term reversal. A fall below the $1.02 zone could provoke further sell-offs. If the bulls step in to defend this zone, the alt could see an extended compression near its POC.
At last, the alt shares a whopping 90% 30-day correlation with Bitcoin. So, keeping a watch on the king coin’s movement would be useful to make a profitable bet.