Decoding Binance Coin’s [BNB] last 7-days’ highlights for traders
![Decoding Binance Coin's [BNB] last 7-days' highlights for traders](https://ambcrypto.com/wp-content/uploads/2023/01/BNB-2.png)
- BNB’s weekly report mentioned all the updated statistics of the network.
- Metrics remained in BNB’s favor but the technical indicators favored the bears.
Binance Coin [BNB] recently published the latest edition of its weekly report, which highlighted all the major developments that happened in its ecosystem in the last seven days.
Not only there were new updates, but also the report mentioned the latest statistics about the network. For instance, during the last week, the average daily transactions were 2.62 million. Reportedly, in the last seven days, weekly and daily average users were 2.48 million and 761k, respectively.
Another week of wordwide events and exciting announcements from BNB Chain! 🌎
Highlights:
🔸Joepegs NFT Marketplace Launches on BNB Chain
🔸BNB Chain Ecosystem Explorer Campaign
🔸BNB Chain and Infiom – Founders Academy
🔸Compete in BNB Chain's Game Jamhttps://t.co/gjbz6QvM4a— BNB Chain (@BNBCHAIN) January 29, 2023
Is your portfolio green? Check the BNB Profit Calculator
A cheerful week, indeed
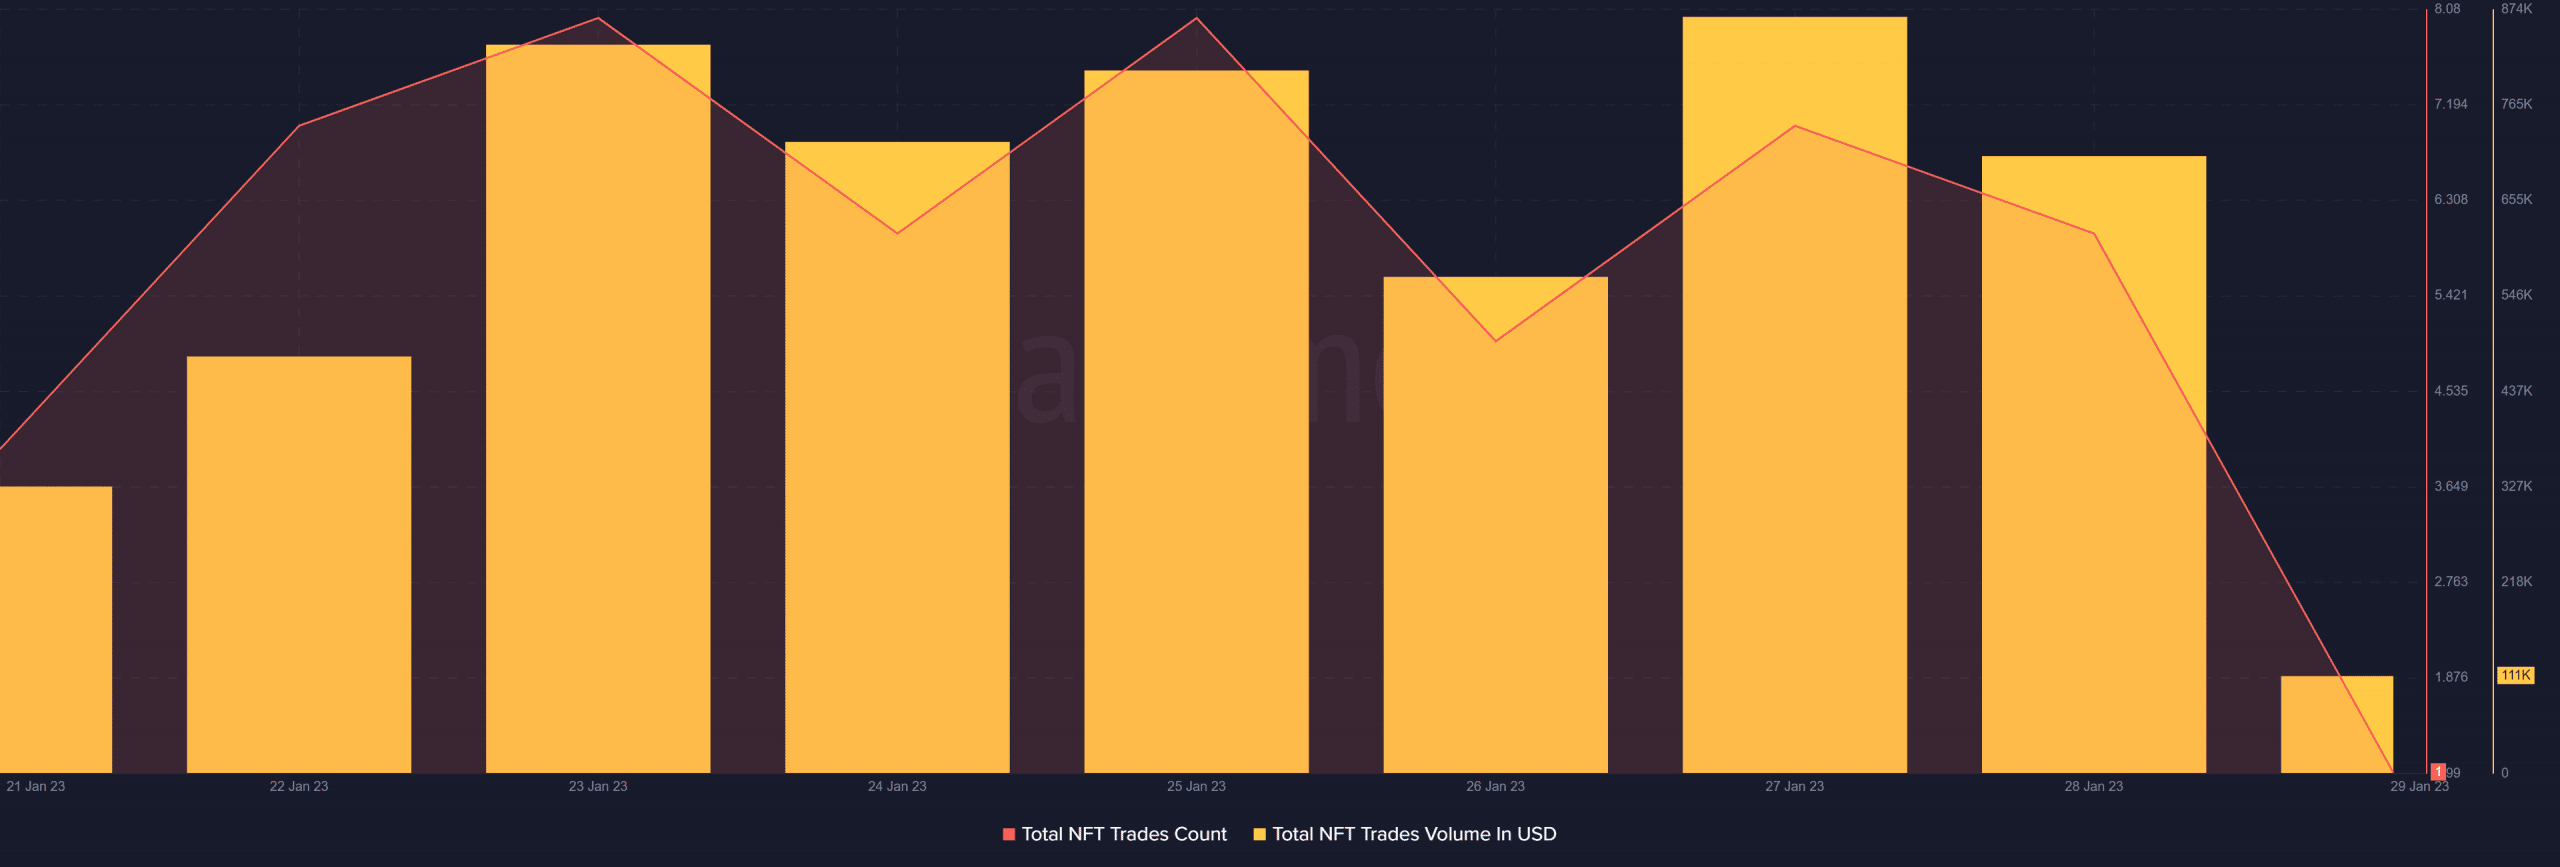
Apart from these, the blog also mentioned that Joespegs NFT marketplace launched on BNB. This was a positive update, as it would help BNB further grow its NFT ecosystem.
Interestingly, Santiment’s chart revealed that BNB’s NFT space did witness growth in the last seven days. The total NFT trade counts and NFT trade volume in USD increased over the week.
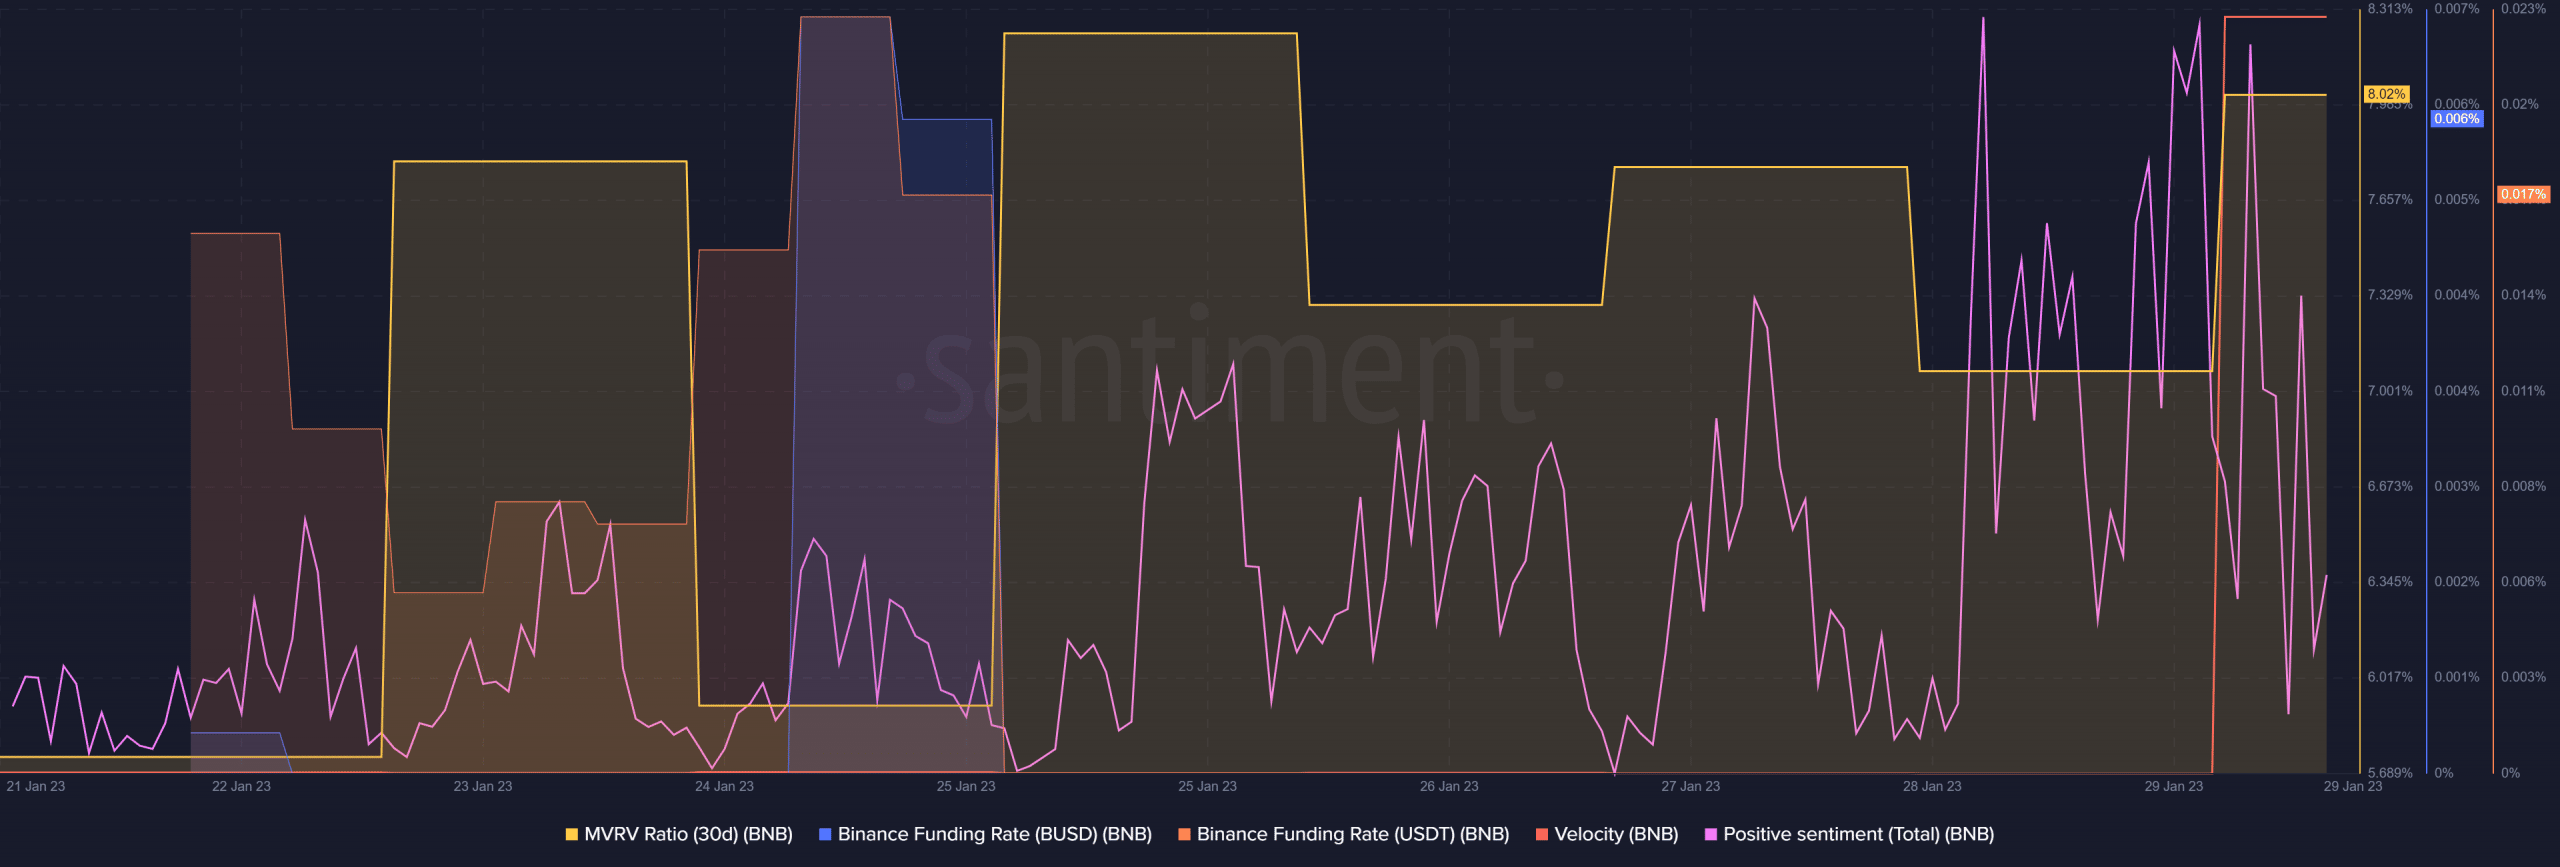
BNB’s performance on the metrics front also remained in the investors’ favor. For example, the coin’s MVRV Ratio registered an uptick, which was bullish.
Positive sentiments around BNB went up during the last few days, reflecting investors’ faith in the coin.
Moreover, the alt’s funding rates spiked last week, which showed its demand in the futures market. Though BNB’s velocity remained low, it went up sharply on 29 January 2023.
How much are 1,10,100 BNBs worth today
Expectations must be checked
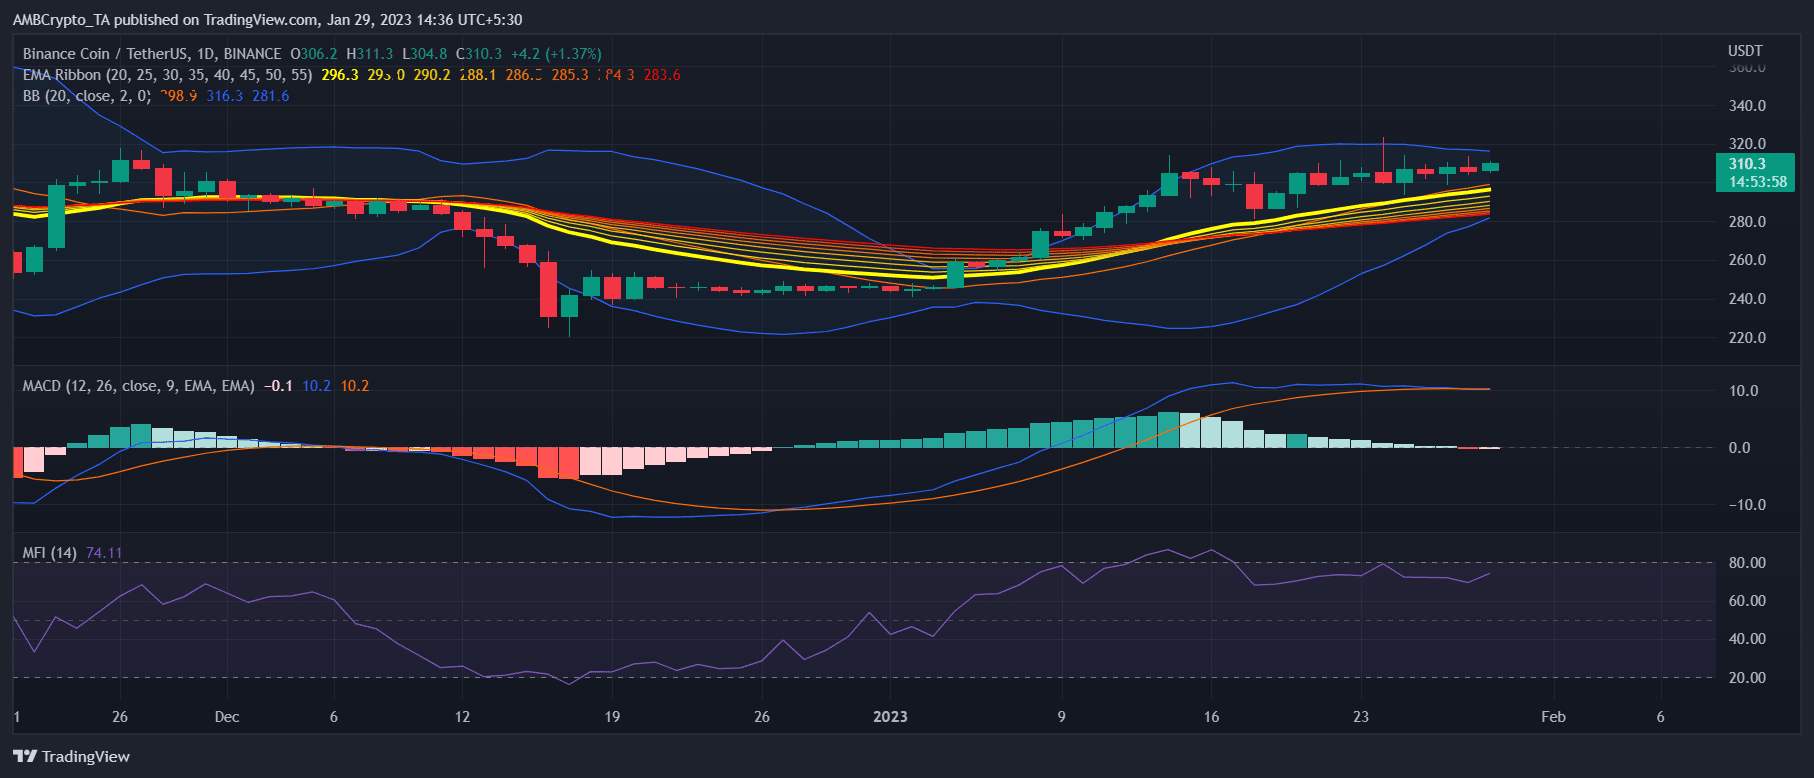
While the metrics were bullish, BNB’s daily chart revealed that the days might get harder soon. The Bollinger Bands pointed out that BNB’s price was entering a squeezed zone, which decreases the chances of a northbound breakout.
The Relative Strength Index (RSI) was heading toward the overbought zone. Furthermore, the MACD revealed an ongoing tussle between the bulls and the bears.
And considering the aforementioned indicators, it was more likely for the bears to win. Nonetheless, the Exponential Moving Average (EMA) ribbon gave hope for a price pump, and according to its data, the bulls were still leading the market.