Decoding key reasons behind Bitcoin’s [BTC] January price rally
![Decoding key reasons behind Bitcoin's [BTC] January price rally](https://ambcrypto.com/wp-content/uploads/2023/01/kanchanara-rhm7H8X5J98-unsplash-e1674715197602.jpg)
- Identical BTC transactions on 5 January might have kickstarted the current rally.
- BTC flirts with the $23,000 region as it attempts to form a new support line.
Recently, the price of Bitcoin (BTC) rose, affecting the entire crypto market. The bulls’ swing started the current run that the coin is now seeing. According to recent reports of tracked transactions, there are indications that some bulls may have taken the initiative for the current surge with significant trades.
How much was transferred, and how has BTC performed thus far since the surge started?
Is your portfolio green? Check out the Bitcoin Profit Calculator
Whales load up BTC
When the year turned, Bitcoin (BTC), which had previously been in a downtrend, unexpectedly experienced a resurgence that sparked a rally. According to the BTC price chart, the rally started around 5 January and has been going up.
A closer examination of BTC transactions on 5 January may reveal more information about what caused the resurgence, according to recent reports from Santiment.
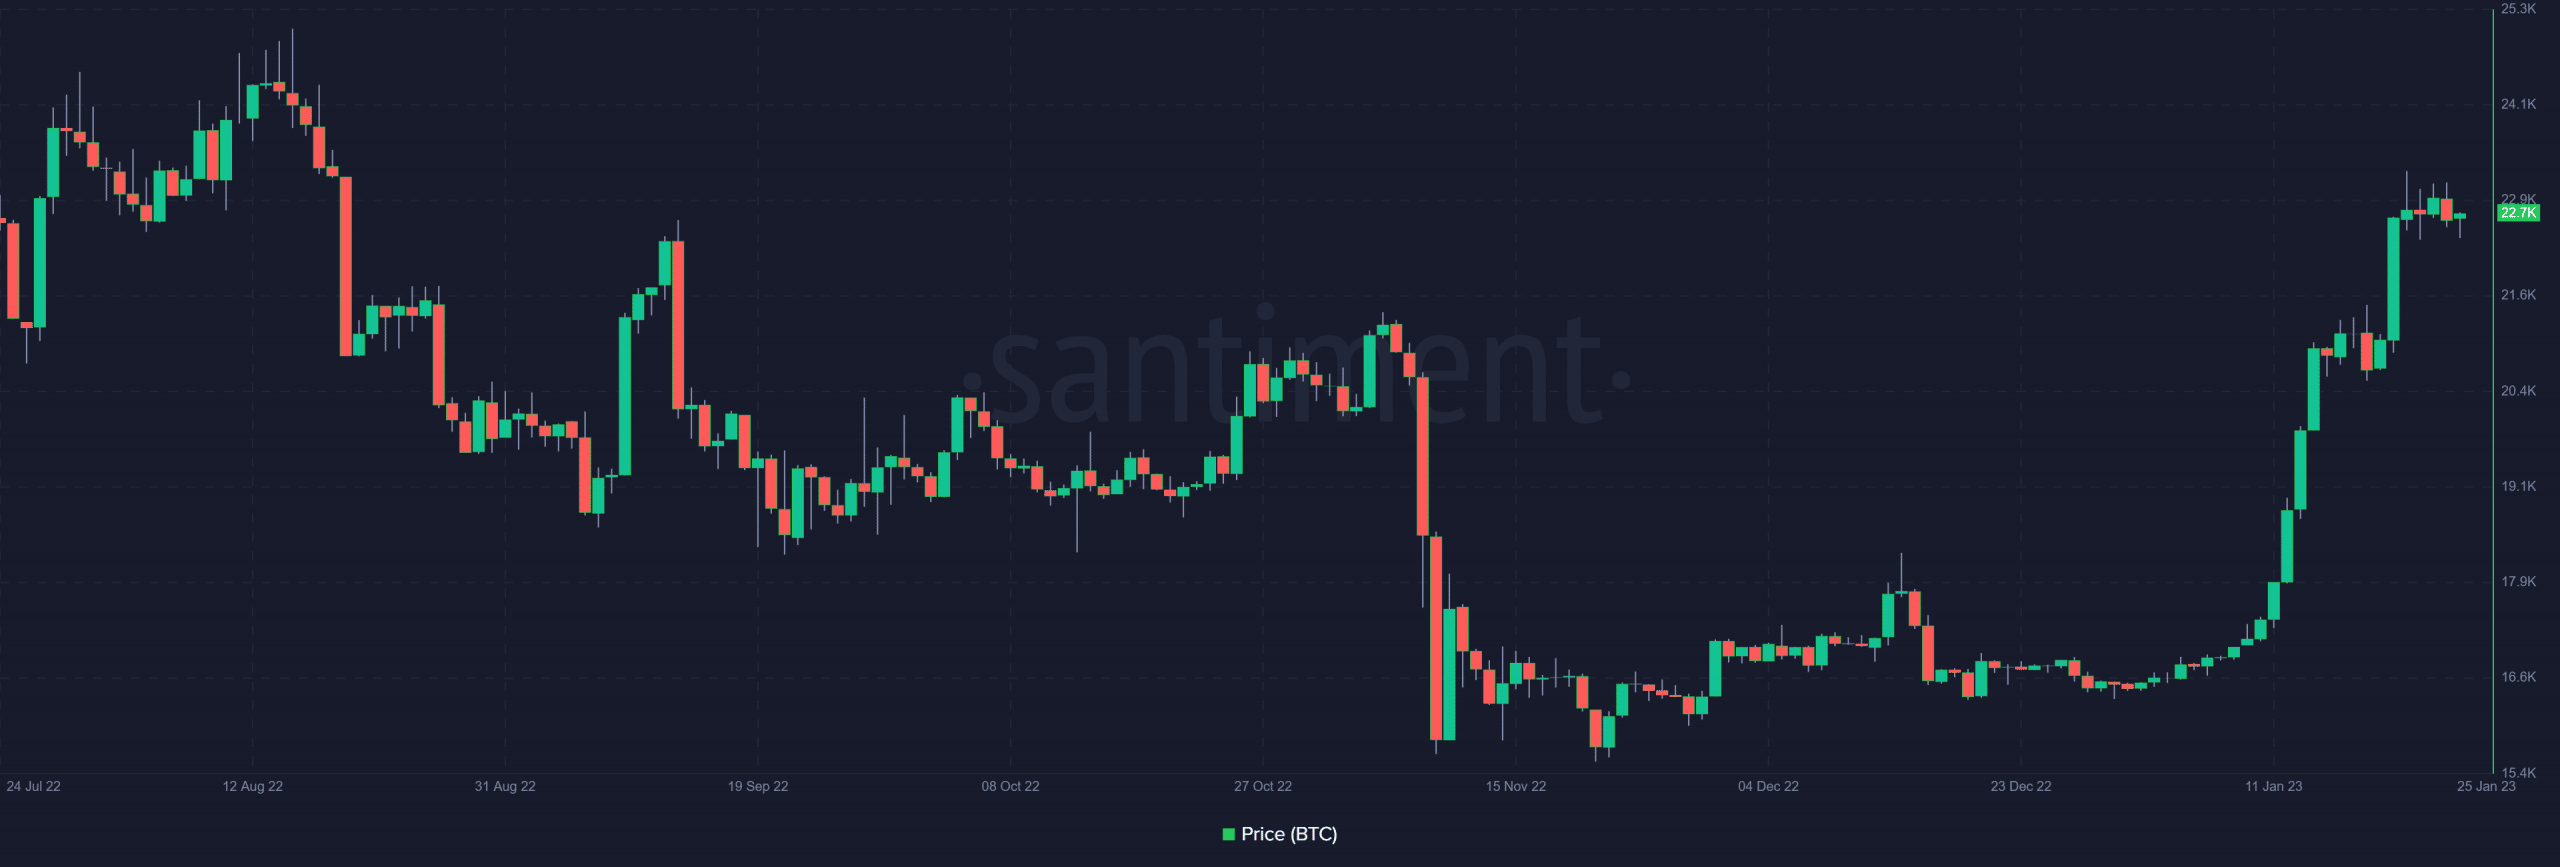
There had been whale movement in the BTC market before the surge, according to the transaction data from Santiment. However, several identical transactions were made, which is a key factor in the surge.
There were two transactions on 5 January, each totaling 15,477.92 BTC. That may have been a massive coincidence, but the price of BTC then began to rise.
BTC flirts with $23,000 and remains bullish
Bitcoin (BTC) circled the $23,000 area between 21 and 24 January. It is yet to really be able to break through the $22,000 area since it started its rally.
It was trading at a loss at the time of this writing, seemingly continuing the previous trading period’s pattern and bringing the loss to about 1.5%. BTC is attempting to create a support level near the $22,000 area despite the loss, which was little nonetheless.
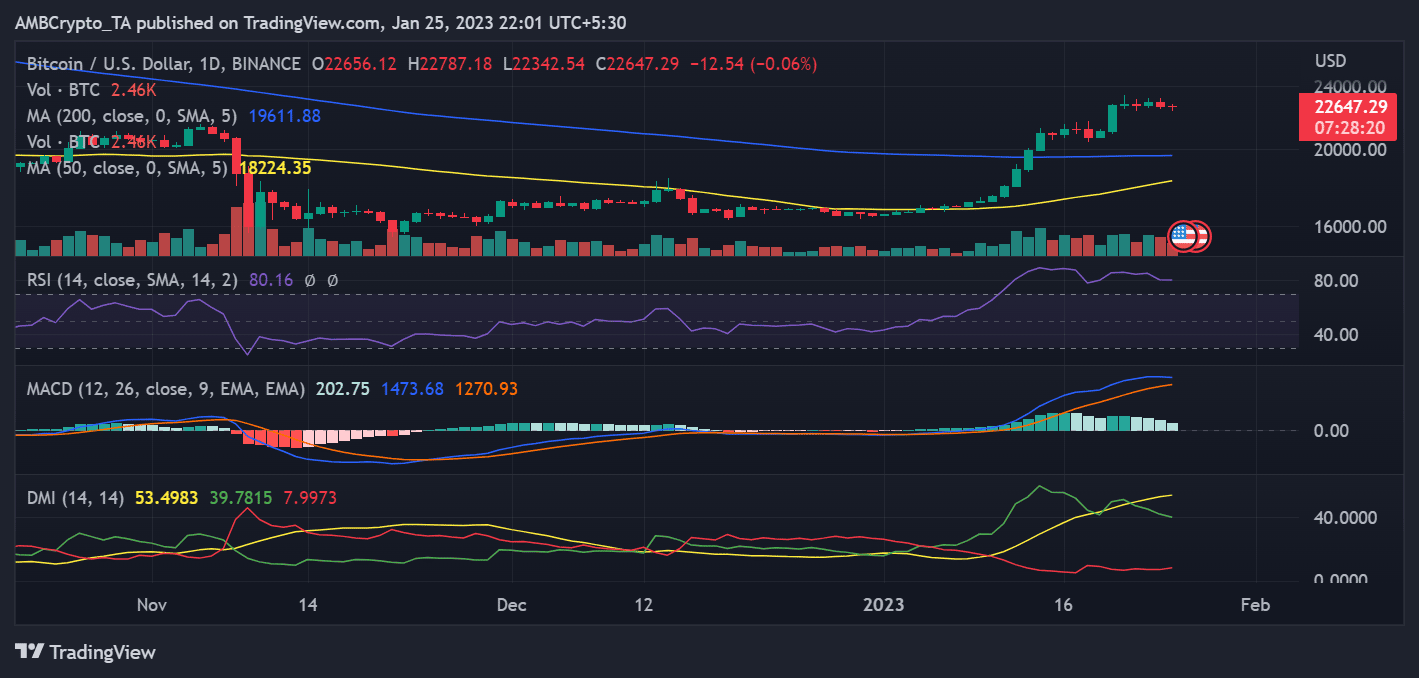
Another indication of a market correction is the position of BTC on the RSI. BTC continued strongly trending upward on the Relative Strength Index (RSI). The RSI’s position also demonstrated that it was firmly located in the oversold area. However, if a downturn were to start, the long Moving Average (blue line) might be its support.
How much are 1,10,100 BTCs worth today
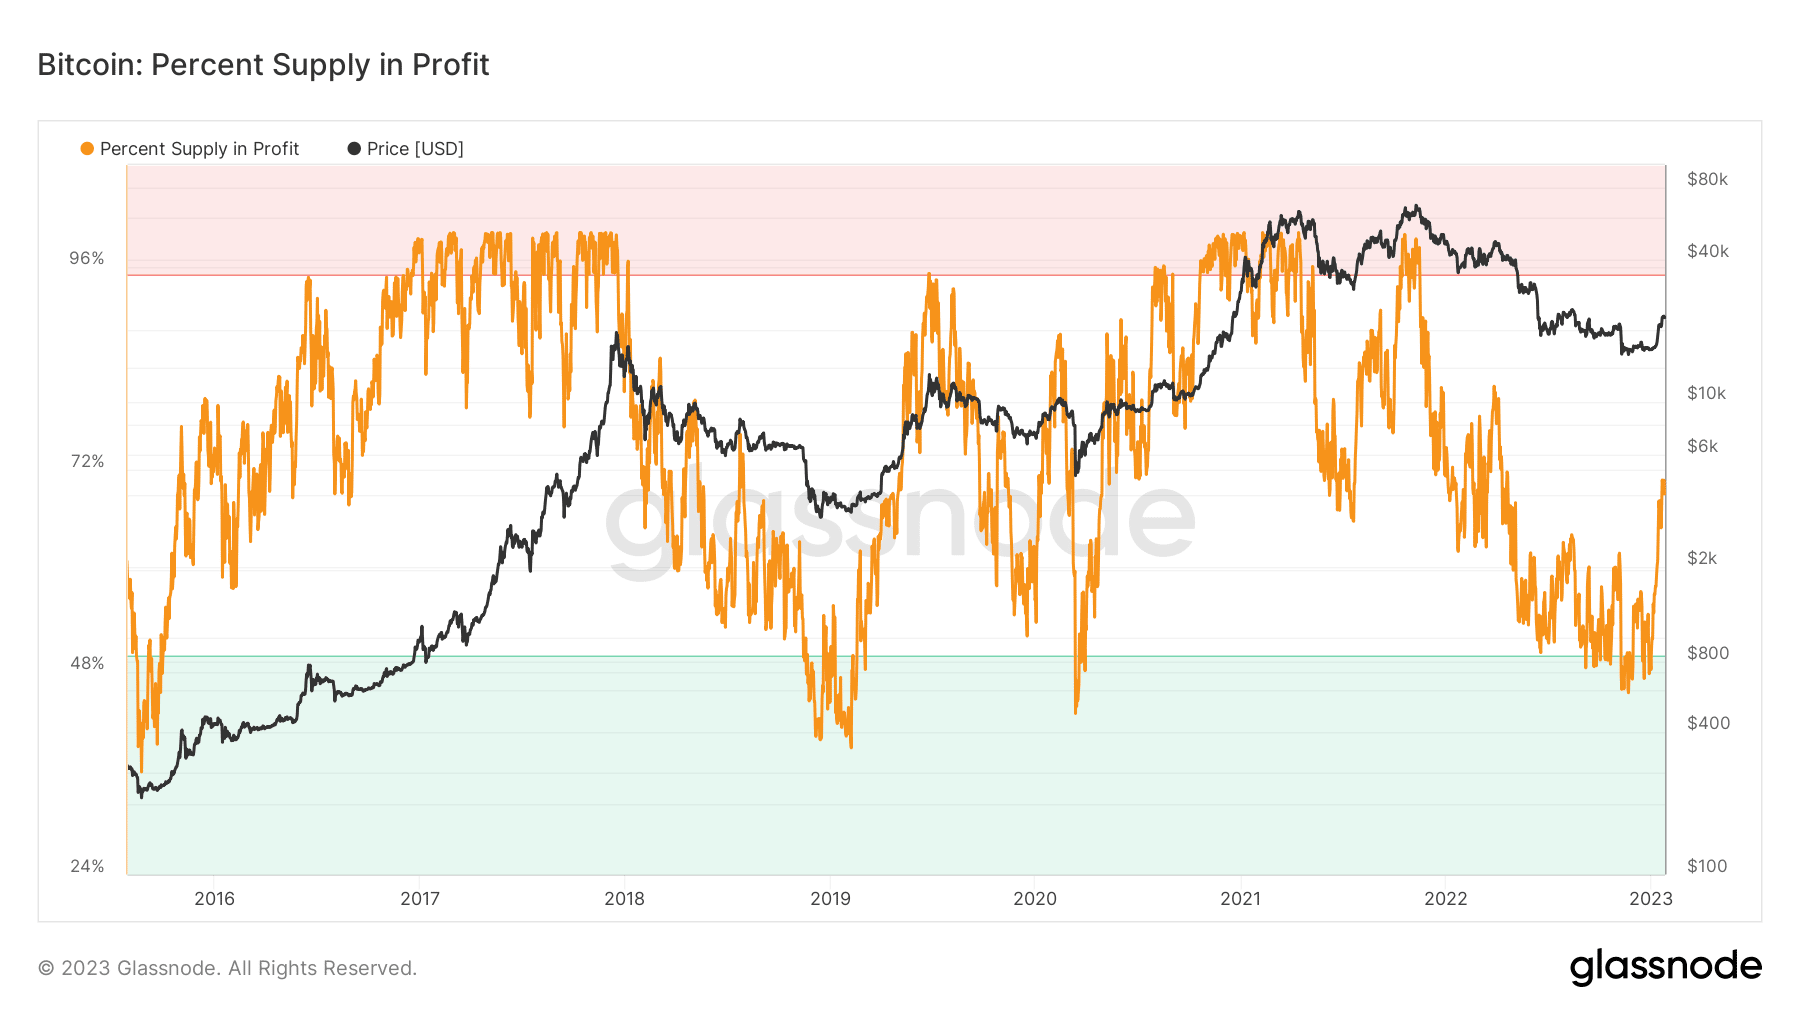
Percent supply in profit at 7-month high
The rise in BTC’s price has also affected the percent supply in profit. The Glassnode graph showed that the percentage of BTC supply that was in profit was over 70%. Upon a closer examination of the indicator, the current supply in the profit stage is the greatest it has been in more than seven months.