Decoding the metrics behind UNUS SED LEO [LEO] and its short-lived rally

It’s hard to resist a near-vertical rally, and especially when it comes from a top 20 cryptocurrency. Can such a trend last, or will it be gone with the wind? UNUS SED LEO [LEO] was one of those assets. Rising from around $4.89 to $5.10 in the space of the last day, the token certainly caught eyes – perhaps leading to its downfall?
The Circle of Life
At press time, LEO was roaring at $4.94 after rising by 0.99% in the last day but falling by 0.71% in the last week.
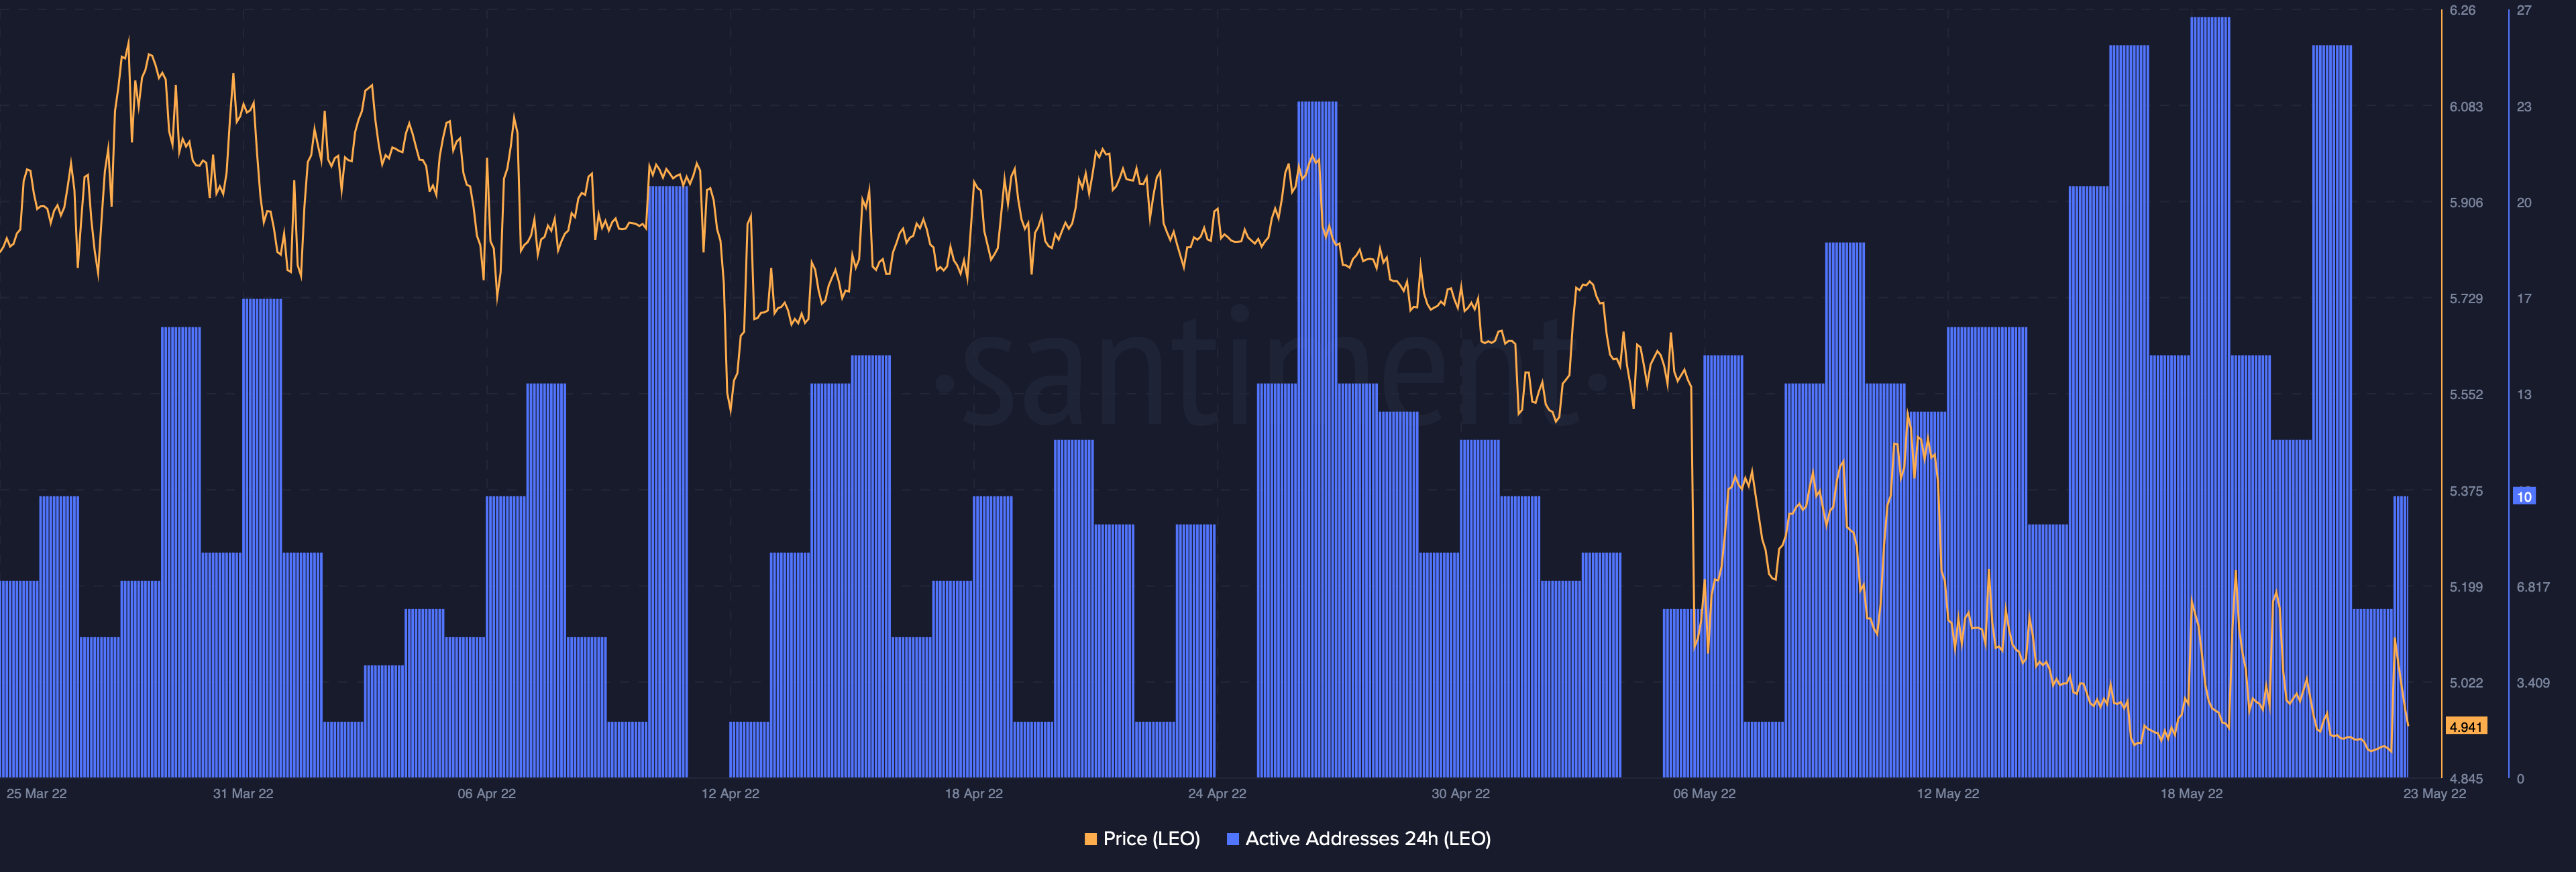
Apart from the rally, we can also see that 24-hour addresses for the asset rose in recent days – especially as the token fell in price. Considering that LEO is an exchange token, it makes sense that CEX users would buy the dip. This is a trend that could take shape again as LEO’s price falls once more.

Source: Santiment
Looking at the top holders’ table though, we can see that wallet address 0xc61b9bb3a7a0767e3179713f3a5c7a9aedce193c, listed as a CEX, was holding 96.97% of the total.
Leo Me Alone!
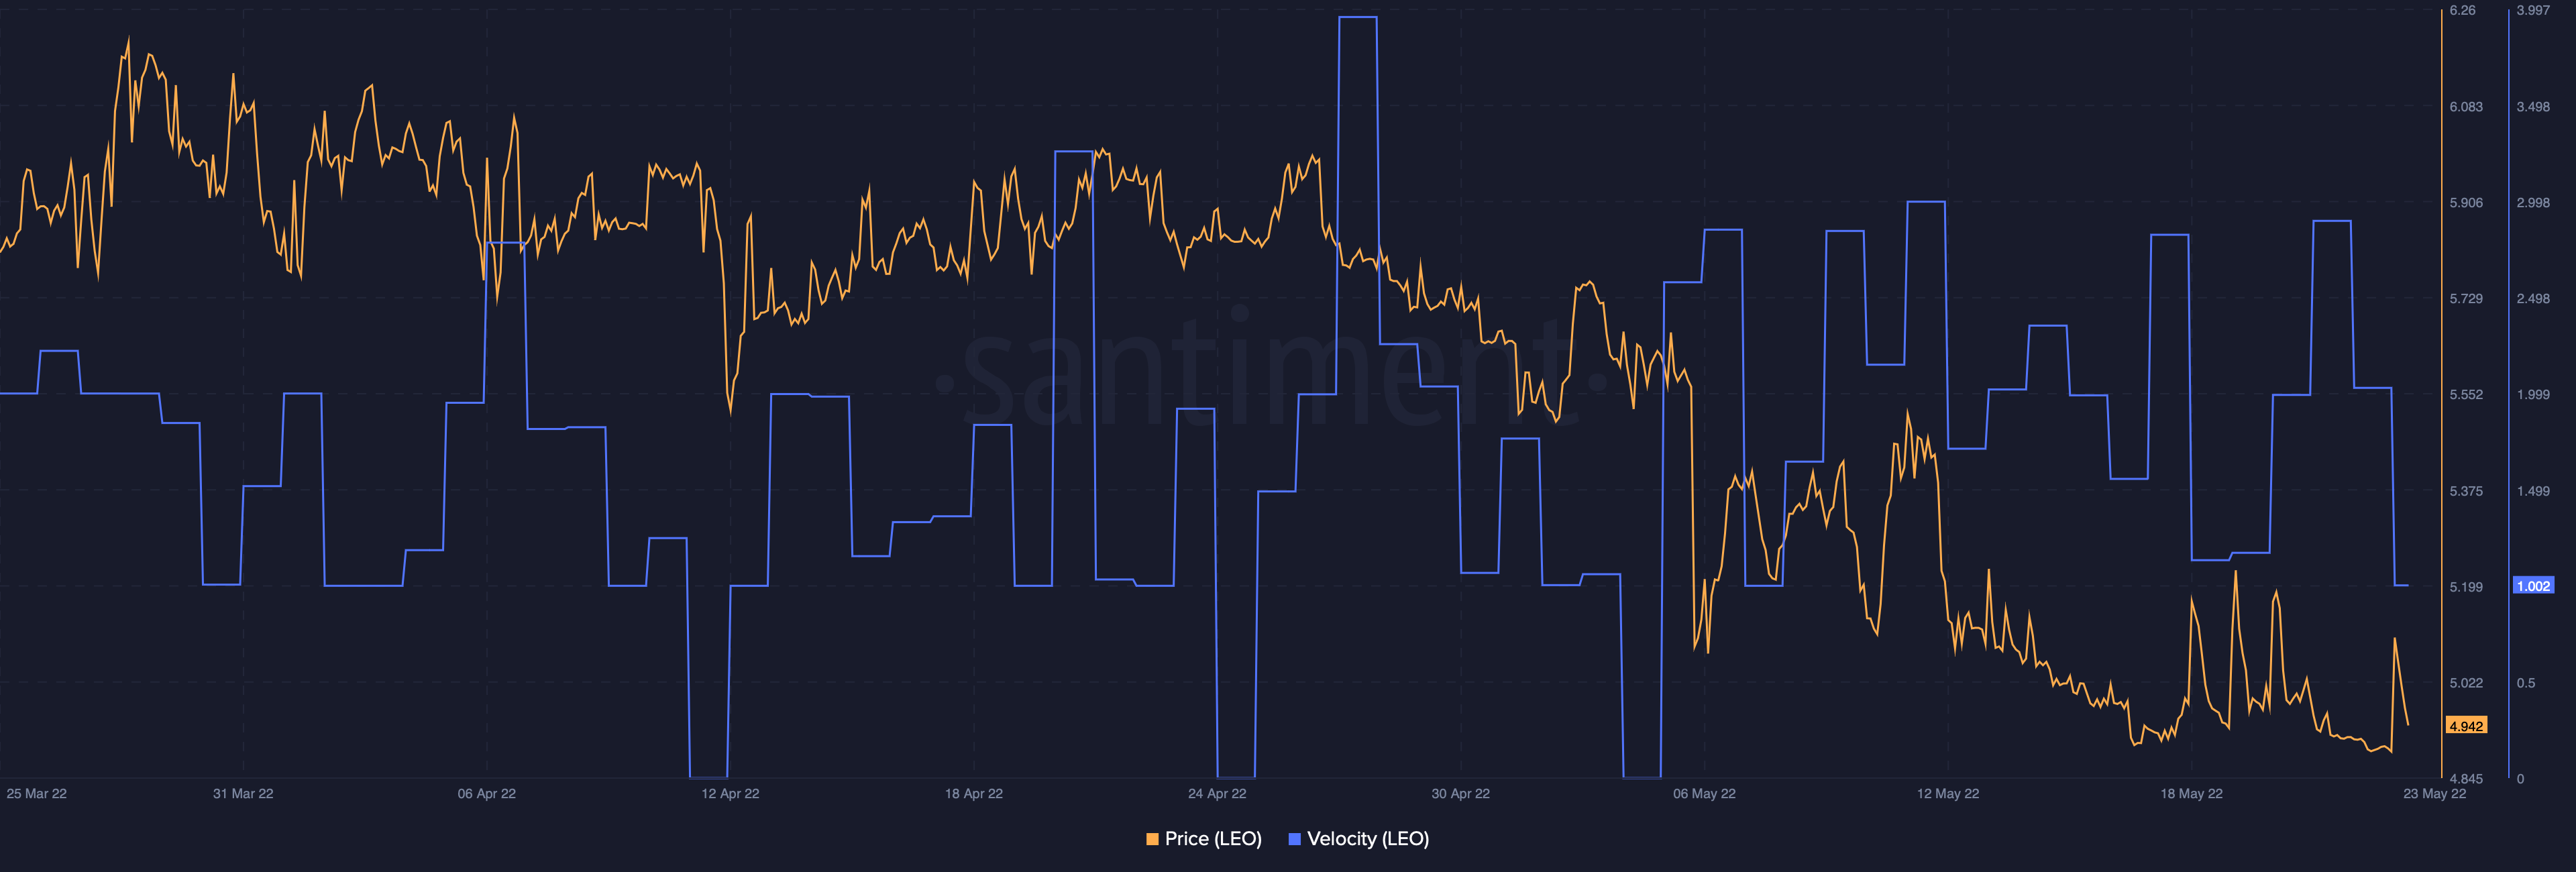
While you might think that users are actively moving their LEO tokens or scooping up some more, data from Santiment showed that the asset’s velocity had fallen. This means that fewer tokens were moving between addresses.

Source: Santiment
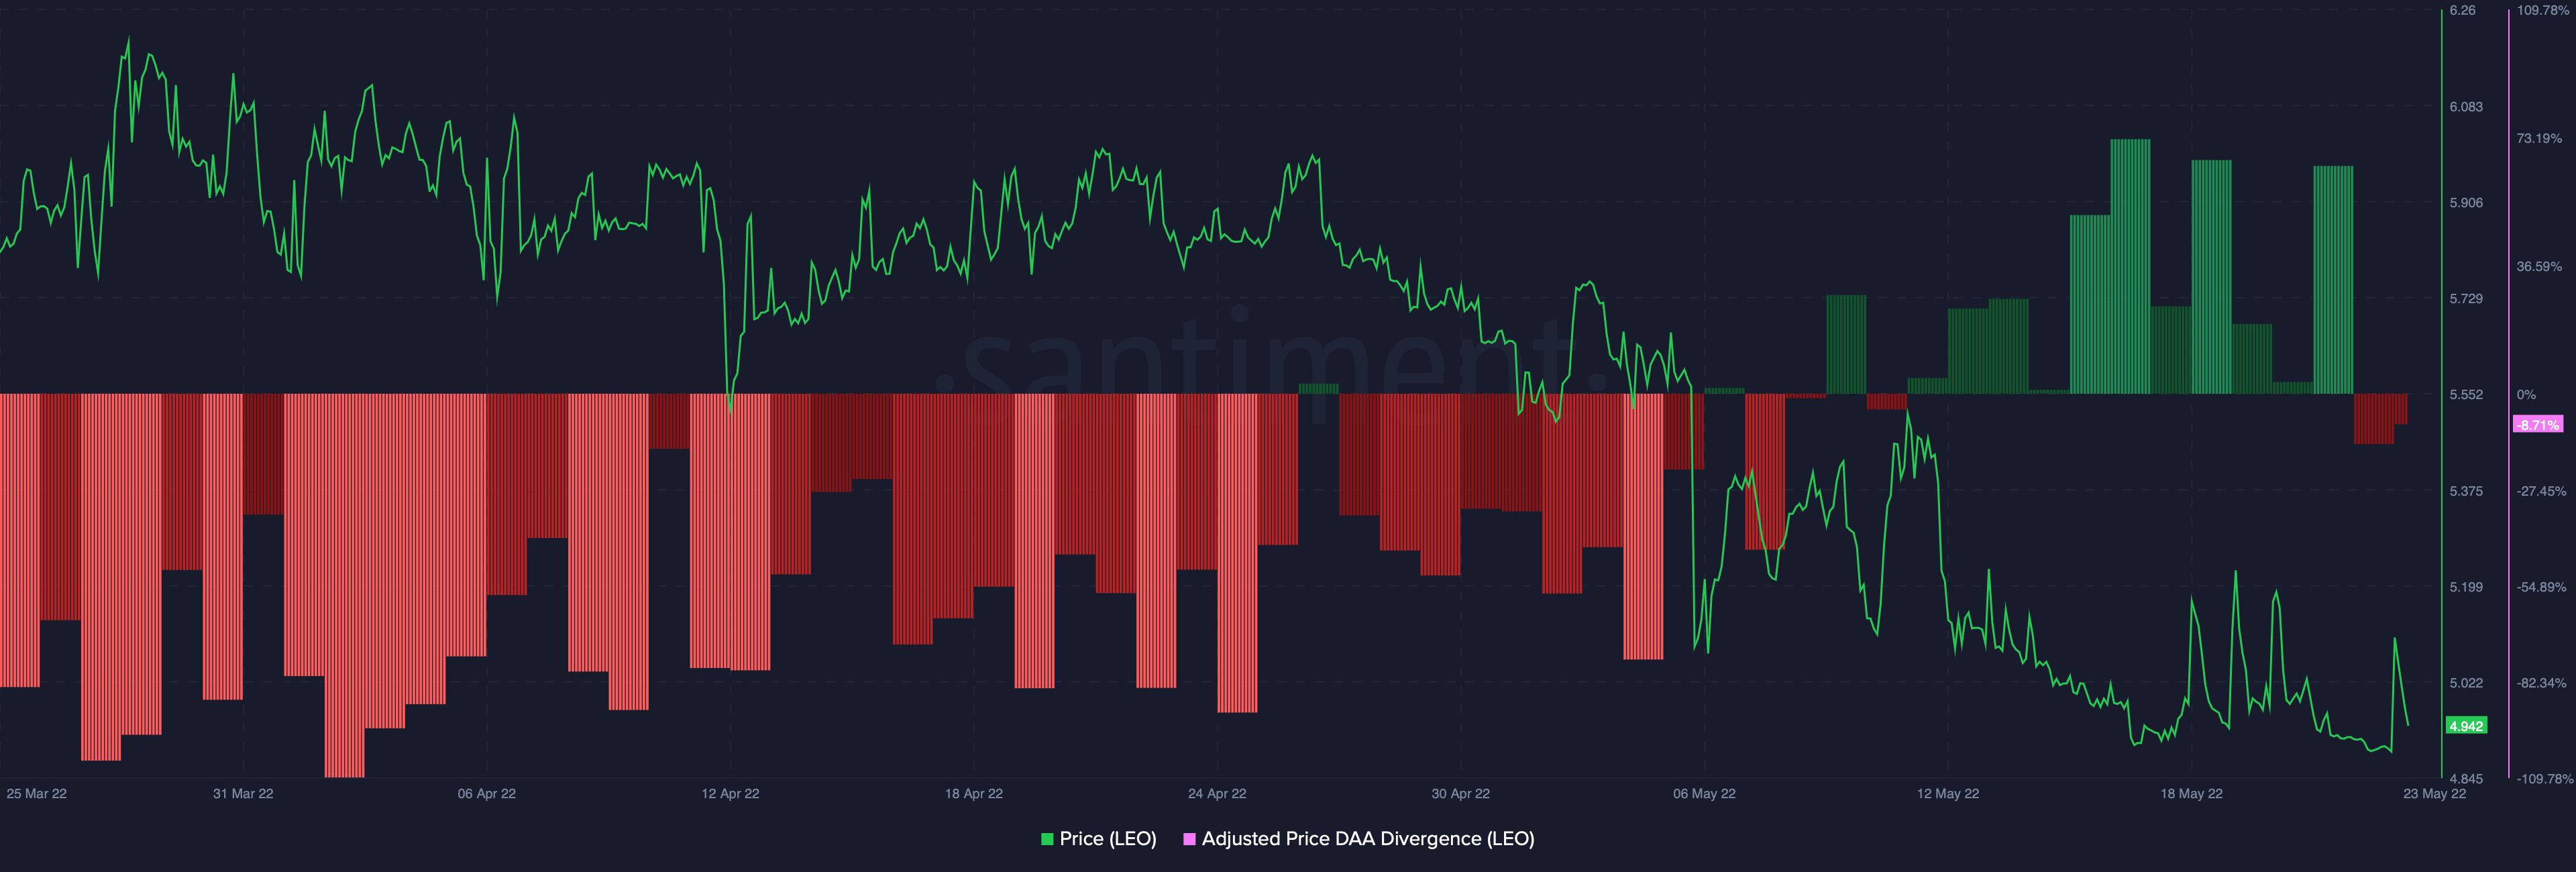
That being said, bulls should keep their eyes on one danger sign. Santiment data revealed that the Adjusted Price DAA Divergence Indicator was flashing red bars at press time. This means increased selling pressure on the asset could drive the price further downwards.

Source: Santiment
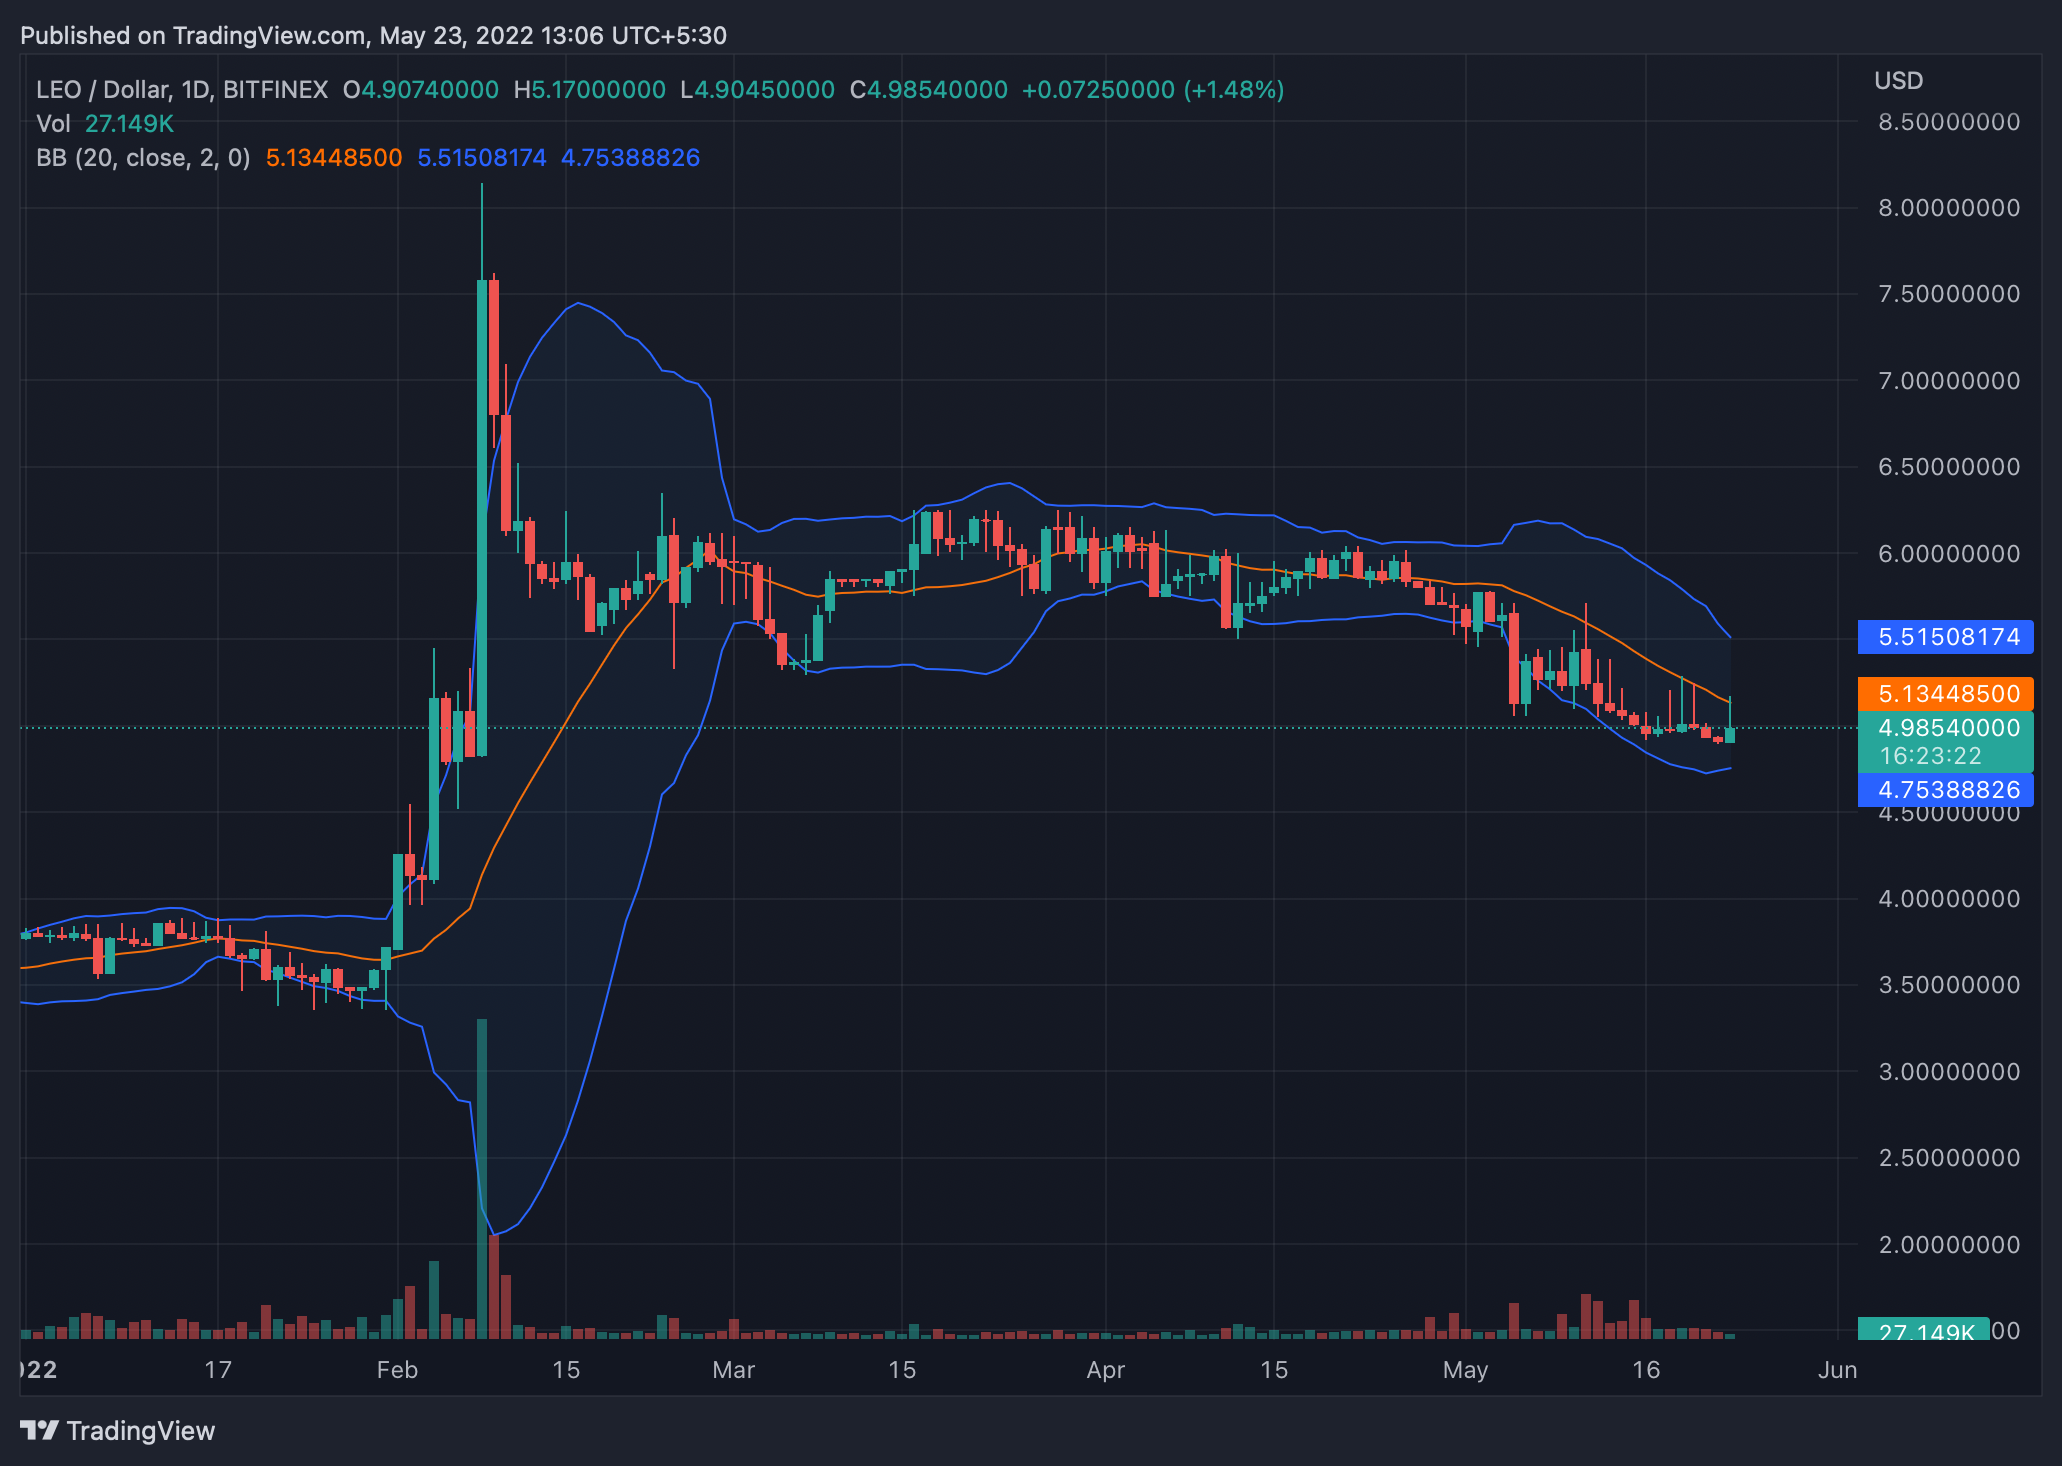
So what might be on the horizon for LEO? TradingView’s Bollinger Bands indicator showed that the bands were coming together. This signals that the volatility for the asset could be decreasing. However, investors should watch to see if LEO’s green candle lasts the day.


![Sei [SEI]](https://ambcrypto.com/wp-content/uploads/2025/06/Gladys-13-400x240.webp)