Decoding why it is dangerous to short HBAR, unless it is intraday scalp trade

Disclaimer: The information presented does not constitute financial, investment, trading, or other types of advice and is solely the writer’s opinion.
- The chances of an HBAR pullback are strong.
- This does not mean shorting the asset is a feasible idea.
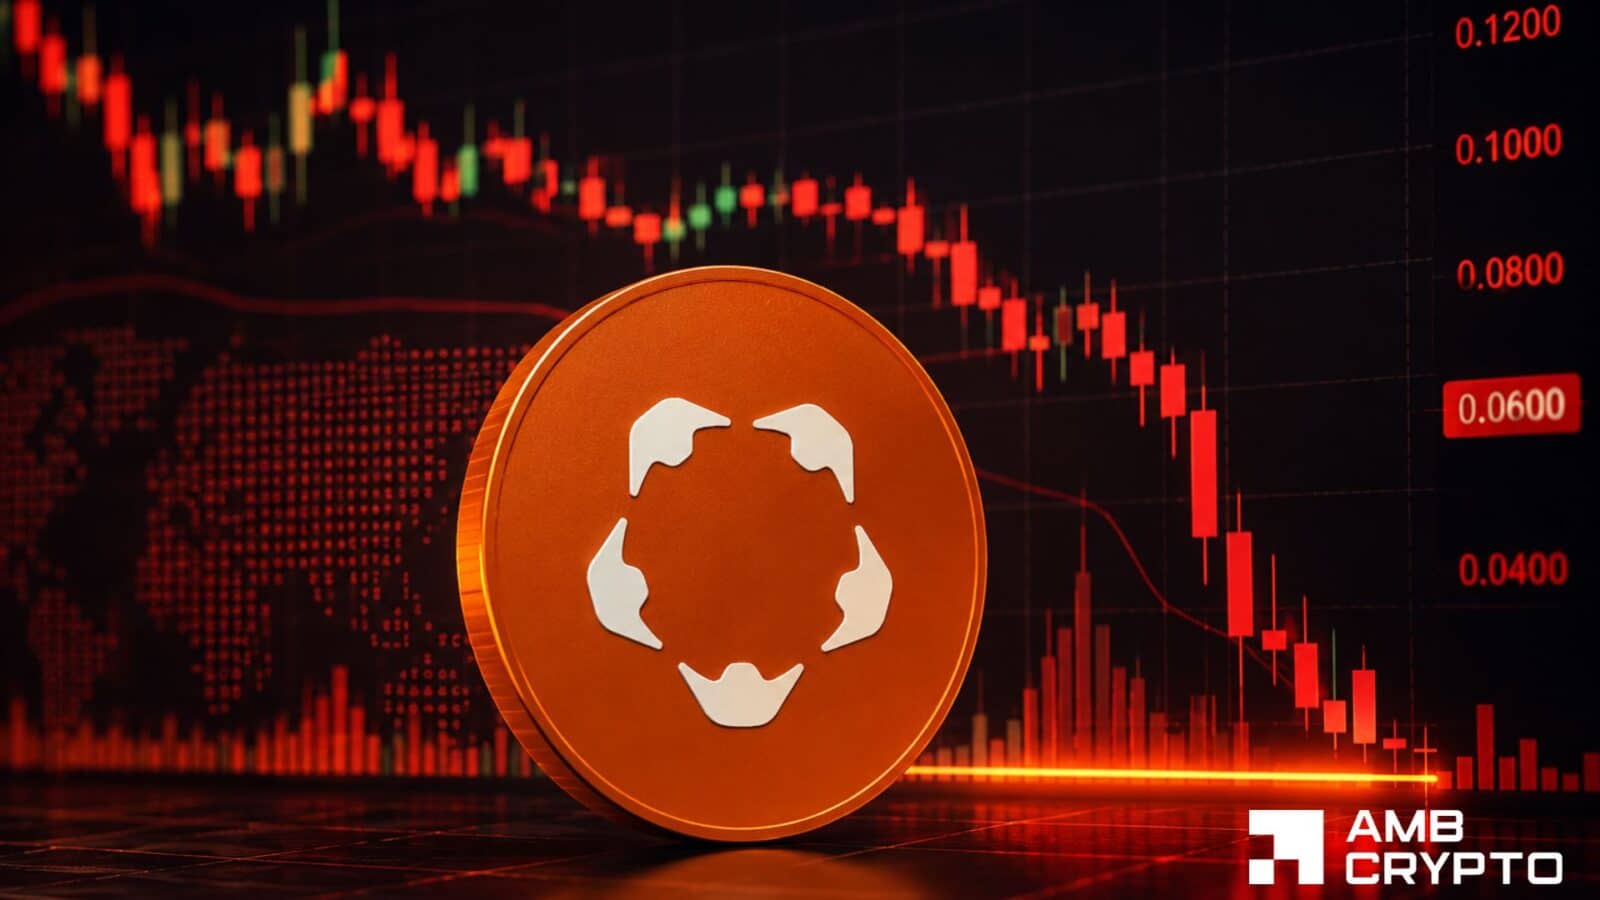
Hedera faced a 93.8% drawdown from its peak at $0.576 in November 2021 to its lows at $0.0356 in December 2022. Since reaching this low, the price has found steady demand. The rally of the past six weeks coincided with a run upward for Bitcoin, which fed capital and hope to the altcoin market.
Is your portfolio green? Check the Hedera Profit Calculator
It was unclear how much higher HBAR can go. $0.1 and $0.12 are levels to watch in the coming days. However, HBAR bulls can wait for a pullback to a region of interest instead of succumbing to FOMO.
Inefficiencies to fill for HBAR after three days of green
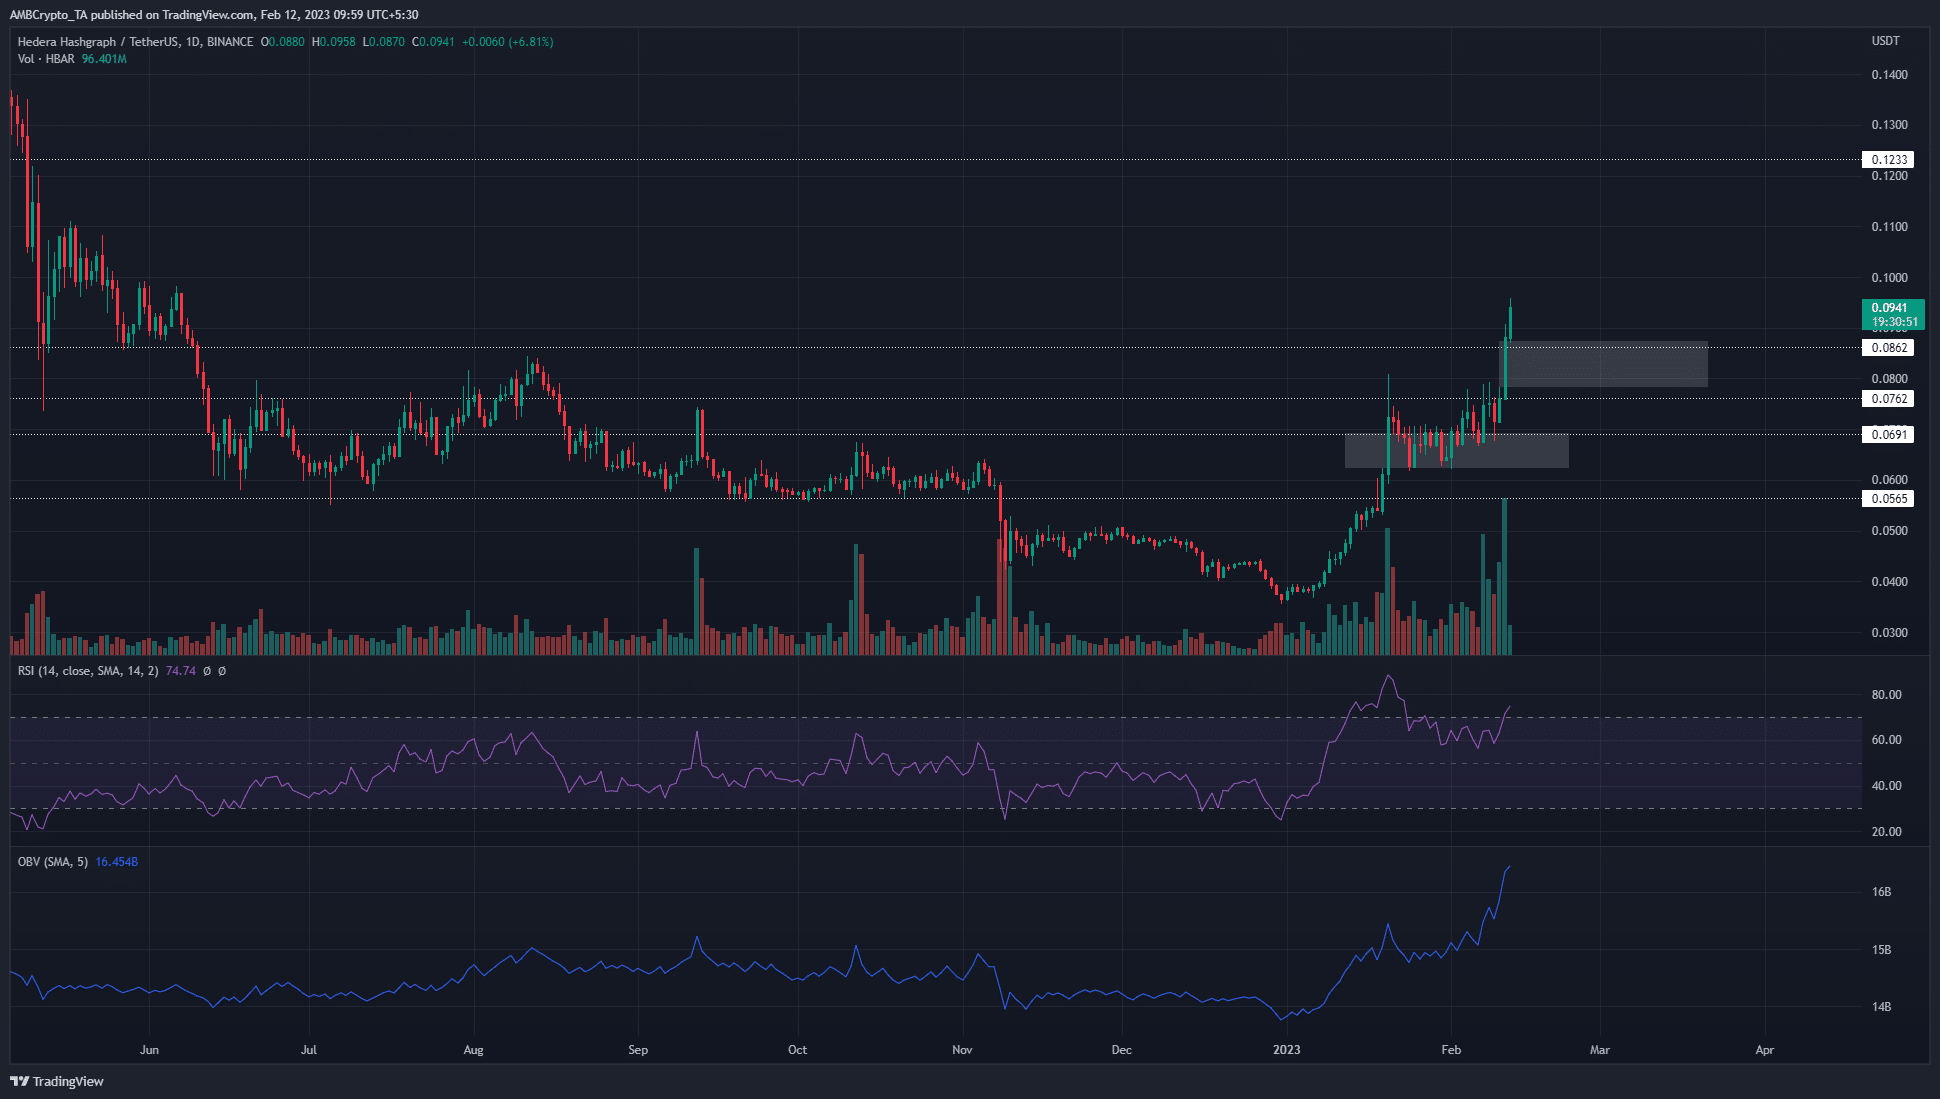
On the daily timeframe, it can be seen that HBAR left some inefficiencies on its way up over the past two months. While the smaller imbalances were not filled, an obvious and large one did witness a retracement recently.
This FVG extended from $0.062-$0.069. This area also acted as resistance from September to early November 2022. In the past two months, the price broke the market structure to bullish when it surged above $0.05 on 14 January.
How much are 1, 10, and 100 HBAR worth?
The price faced rejection at $0.07, retraced to fill the gap at $0.062. After two weeks of consolidation around $0.067, the bulls overpowered the sellers.
At the time of writing, HBAR traded at $0.094. But the strong recent move has left a similar FVG at $0.08. Hence, a retracement into this region is one that bulls can await. The daily RSI began to form a bearish divergence with the price. Yet, the OBV remained in a sharp uptrend,
Bears look to fade the rally but demand remained strong
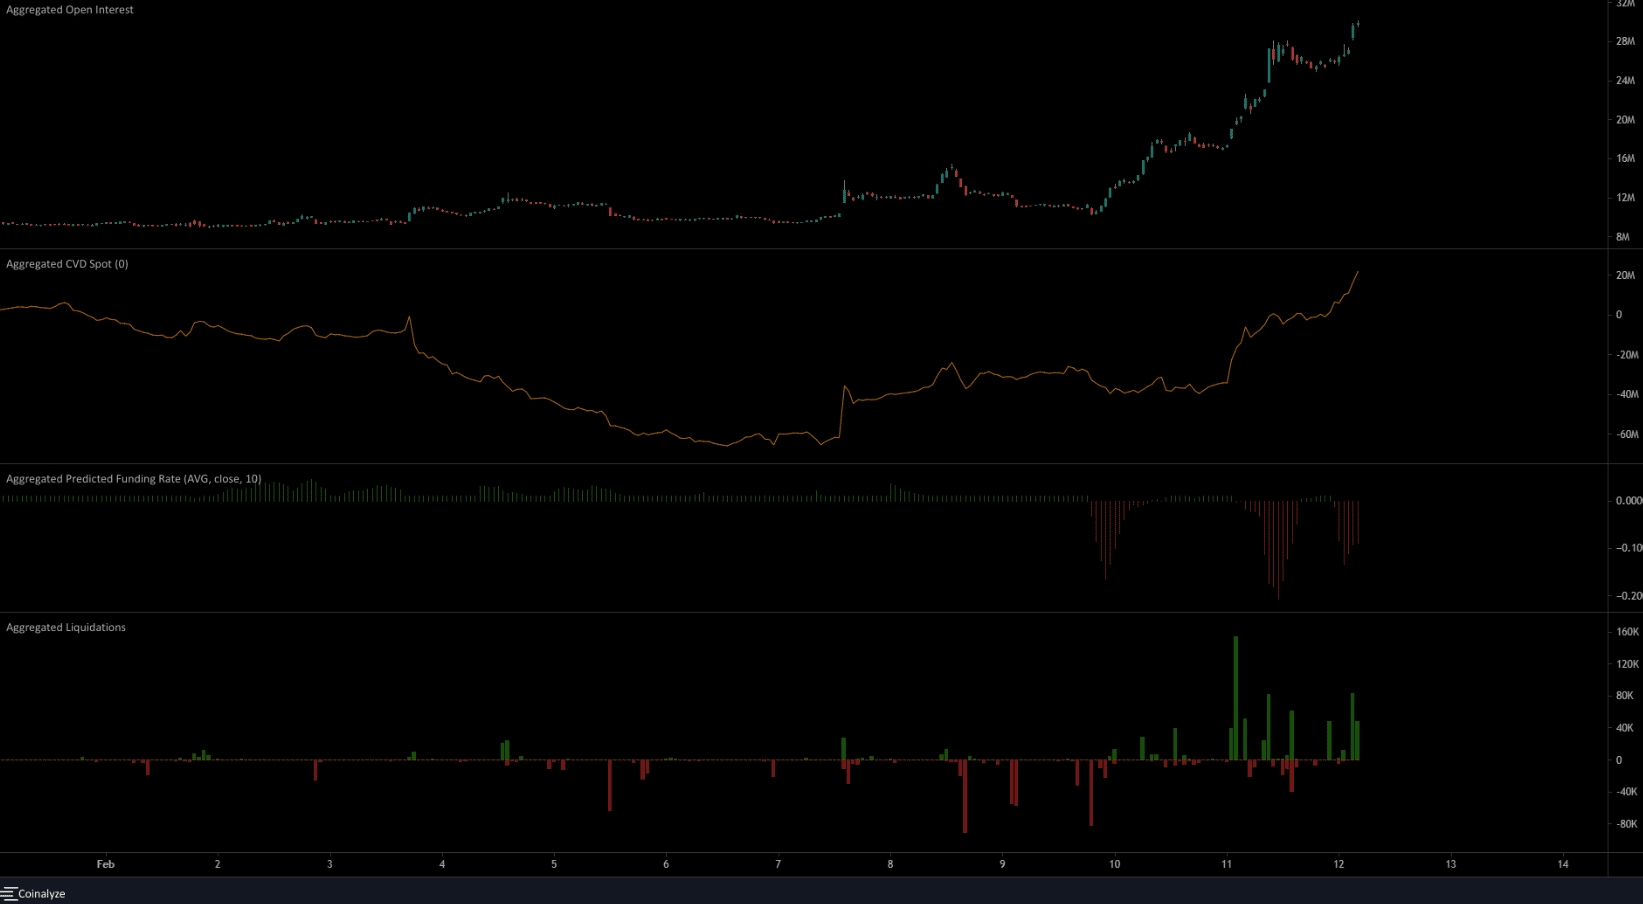
On the 1-hour chart, the prices and the Open Interest were in a strong uptrend. The spot CVD also climbed sharply upward. Together they signaled strong capital inflow to the market and underlined bullish strength.
The predicted funding rate dipped into negative territory multiple times over the past few days. At the same time, short positions saw a decent chunk of liquidations. Hence, it showed that market participants did try to fade the rally but got punished.
As things stand, it was dangerous to short HBAR, unless it is an intraday scalp trade. The higher timeframe structure remains bullish. A drop below $0.08 and $0.06 would flip the structure to bearish.