Despite the recent bounce, this can hurt Solana’s bullish prospects

The steady downtrend since early December appeared set to continue as Solana was unable to flip the $116 level from resistance to support. The coin was ranked the eighth cryptocurrency, with a market capitalization of $31.5 billion. Even so, there have been reports of congestion issues on the network as well as exploits that have shaken investors’ confidence. On the charts, SOL could see another leg downward.
SOL- 12H
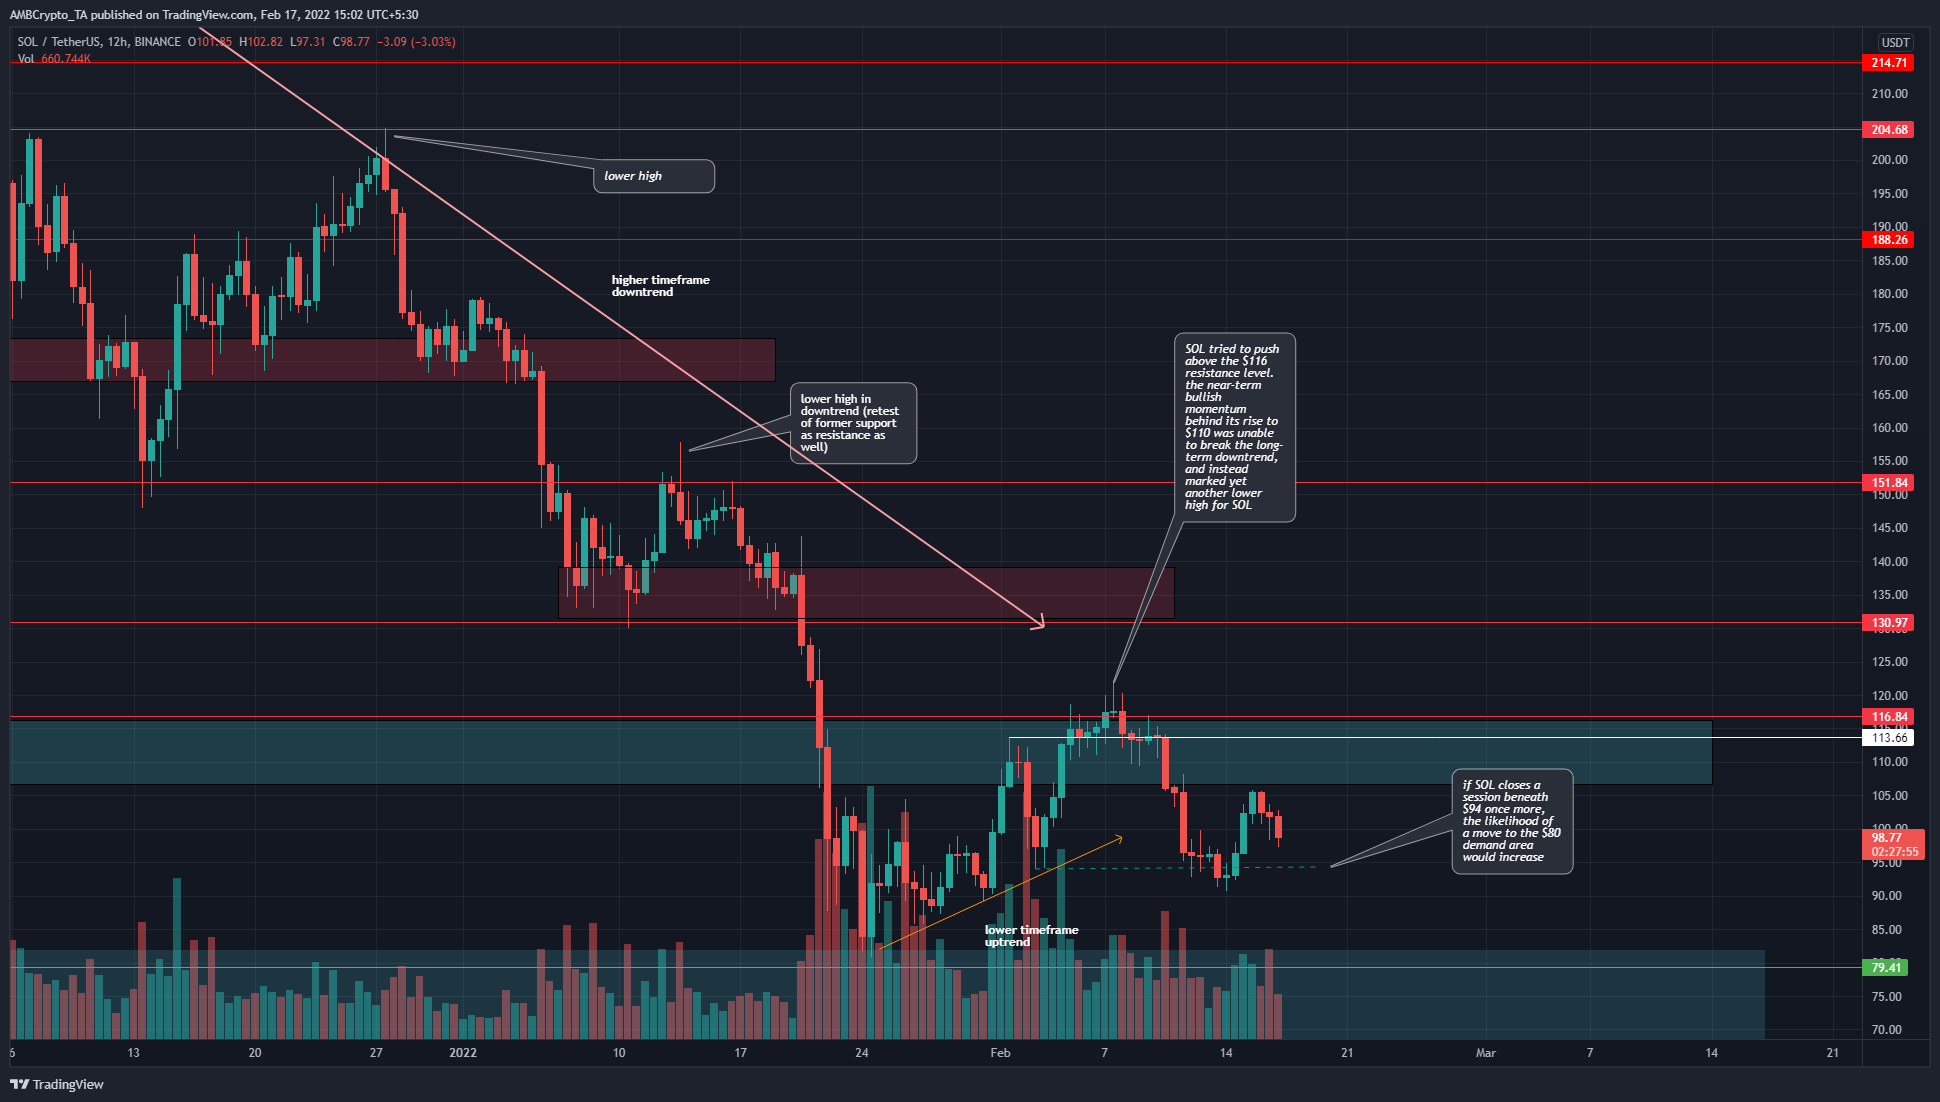
The $116 level has some significance because, in September of 2021, this level acted as resistance to SOL’s move up. Subsequently, the bulls drove prices above this level, and later in September, a retest of the same level occurred.
Market participants with a longer time horizon would have eyes on the $116 and $130 resistance levels, and the rejection at the $120 area showed that bears remained strong.
In late January and early February, there was a good amount of demand and bullish momentum for SOL – but it was not enough to break past the supply zone in the $115 area.
Rationale
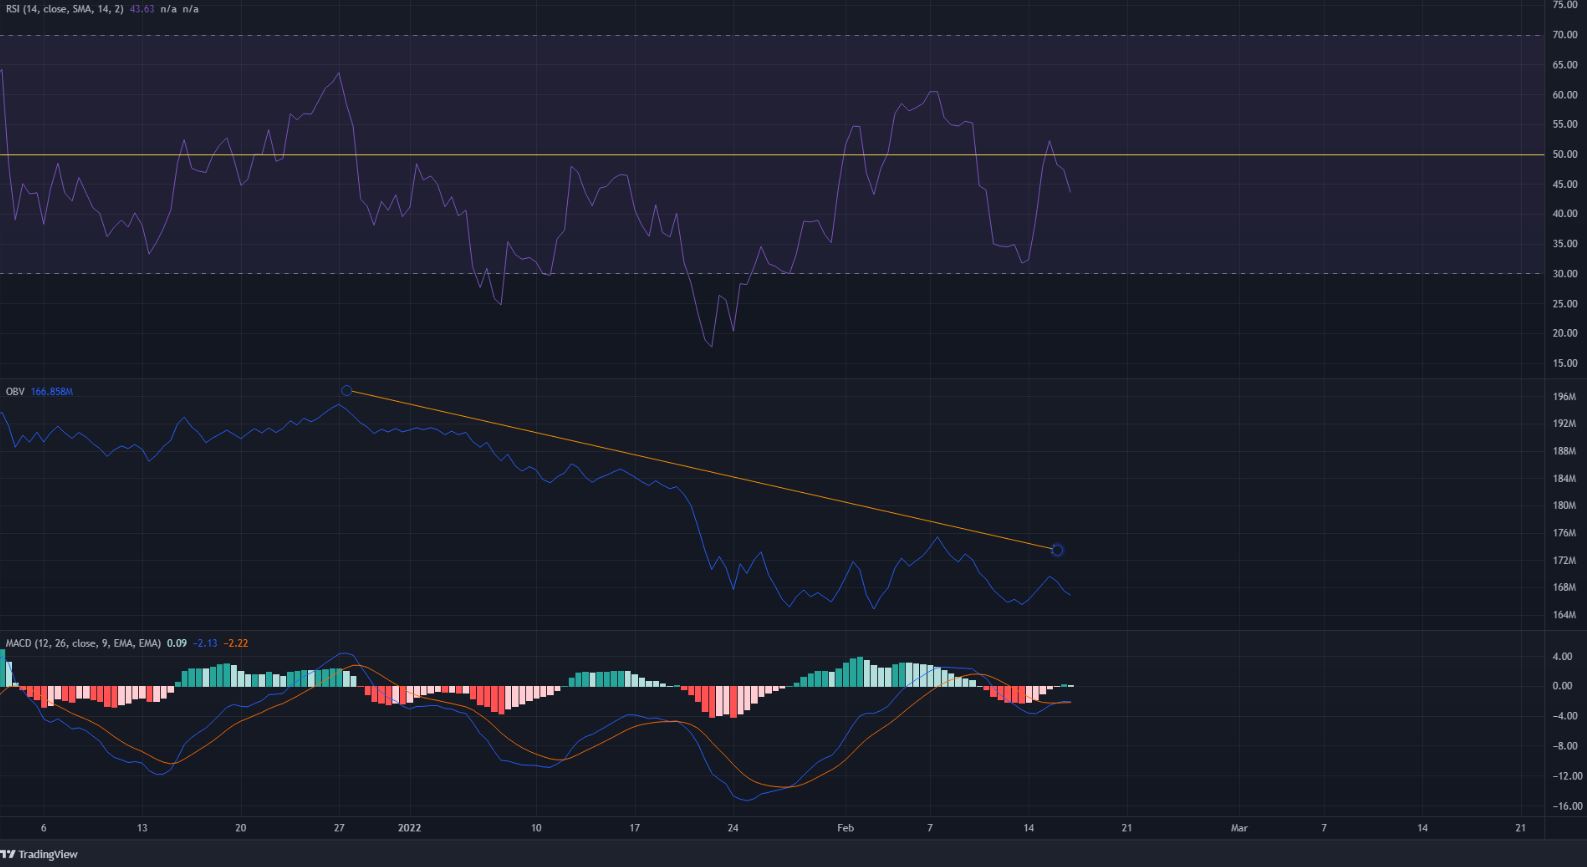
The RSI was able to climb as high as 60 when the price reached $121 but was soon pushed back beneath the neutral 50-level. At the time of writing, the 12-hour RSI appeared to retest neutral 50 as resistance before a rejection. This showed that bearish momentum was rising, and SOL could be pushed lower on the charts.
The OBV showed that selling volume has been steady, and has outweighed the buying volume since late December. Even when SOL bulls tried to break above $116, the demand/buying volume was simply not strong enough.
The MACD climbed back to the zero line but was unable to push convincingly past it. This highlighted bearish momentum could take over once again.
Conclusion
The indicators painted a bearish picture for Solana and showed that the recent move from $80 to $115 was only a relief rally. If Bitcoin can climb past $46k, it could see SOL make yet another attempt to climb above $116 as the rest of the market would reflect the confidence behind BTC. However, at the time of writing, a move downward appeared likely.
Disclaimer: The findings of the following analysis are the sole opinions of the writer and should not be considered investment advice