What are the odds on fresh losses for Dogecoin?
The indicators showed great selling pressure behind Dogecoin and continued losses on the price charts after the recent slump beneath $0.072.

Disclaimer: The information presented does not constitute financial, investment, trading, or other types of advice and is solely the writer’s opinion.
- The loss of the POC showed sentiment was strongly bearish.
- Higher timeframe range lows could get tested as support.
Dogecoin [DOGE] has been in a downtrend on the daily timeframe since 21 April, when DOGE prices fell below $0.081. The strength of this downtrend has slowed down over the past two weeks. However, the 4-hour charts showed that a spike in selling pressure could push prices downward again.
How much are 1, 10, or 100 DOGE worth today?
This spike came on 24 May when Bitcoin declined rapidly from $27,250 to $26,700. Bitcoin was trading at $26.2k at press time and looked likely to register new lows this month. In turn, this could hurt Dogecoin bulls.
Not all imbalances are created equal but there was additional confluence here
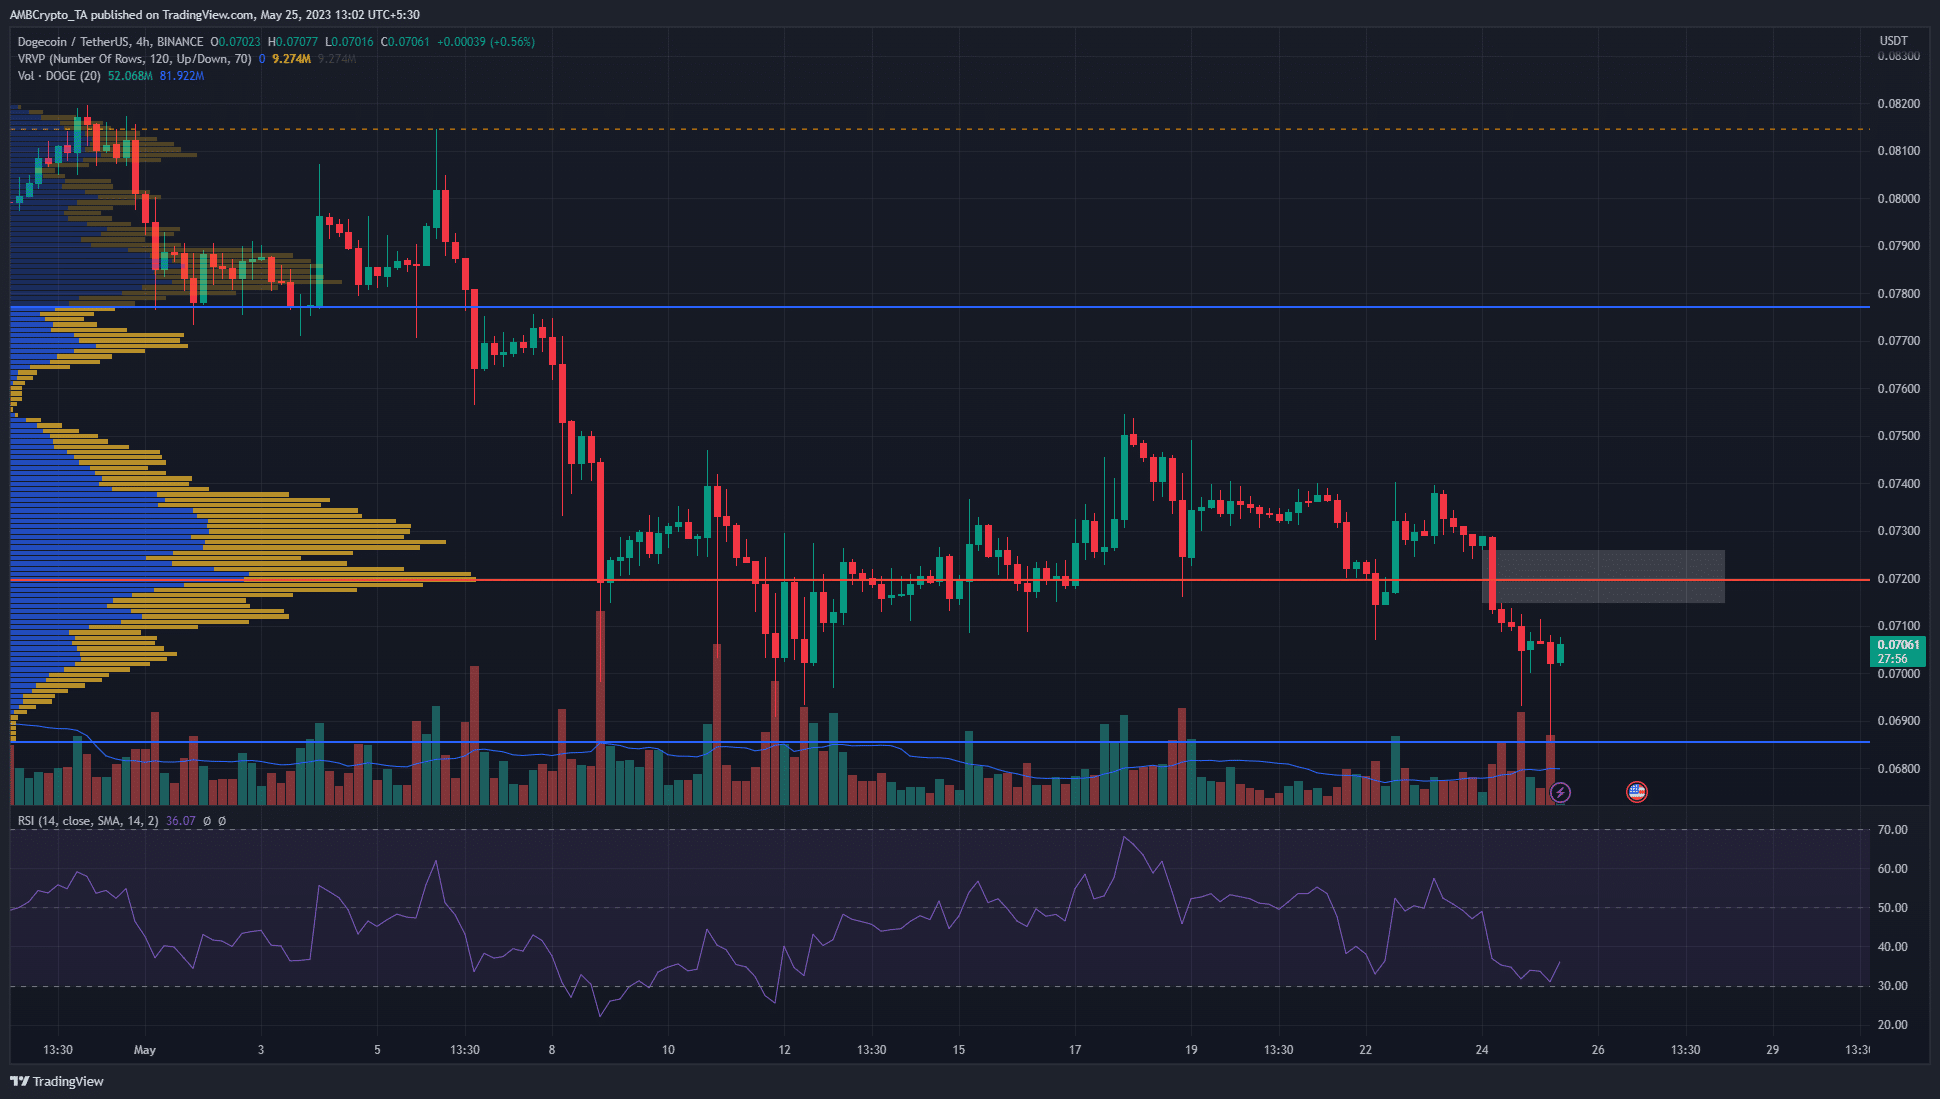
The Volume Profile Visible Range on the 4-hour chart from the beginning of May showed the Point of Control (red) at $0.072.
The Value Area Low was at $0.0687, and both of these levels were considered important support levels for Dogecoin prices.
This changed over the past 36 hours, as the sudden selling behind BTC led to a slump in DOGE prices. The H4 market structure was bearish once more, in line with the higher timeframe trend.
Therefore, traders can expect the meme coin to descend in the coming days. The RSI supported this idea with a bearish reading of 36.
Highlighted on the charts was a fair value gap (white) which had confluence with the POC. This showed two things- one, bears were enormously strong in that area. Two, that a retest of $0.072 as resistance could offer a good risk-reward shorting opportunity.
Realistic or not, here’s DOGE’s market cap in BTC terms
The selling pressure began to rise last weekend and has not slowed down
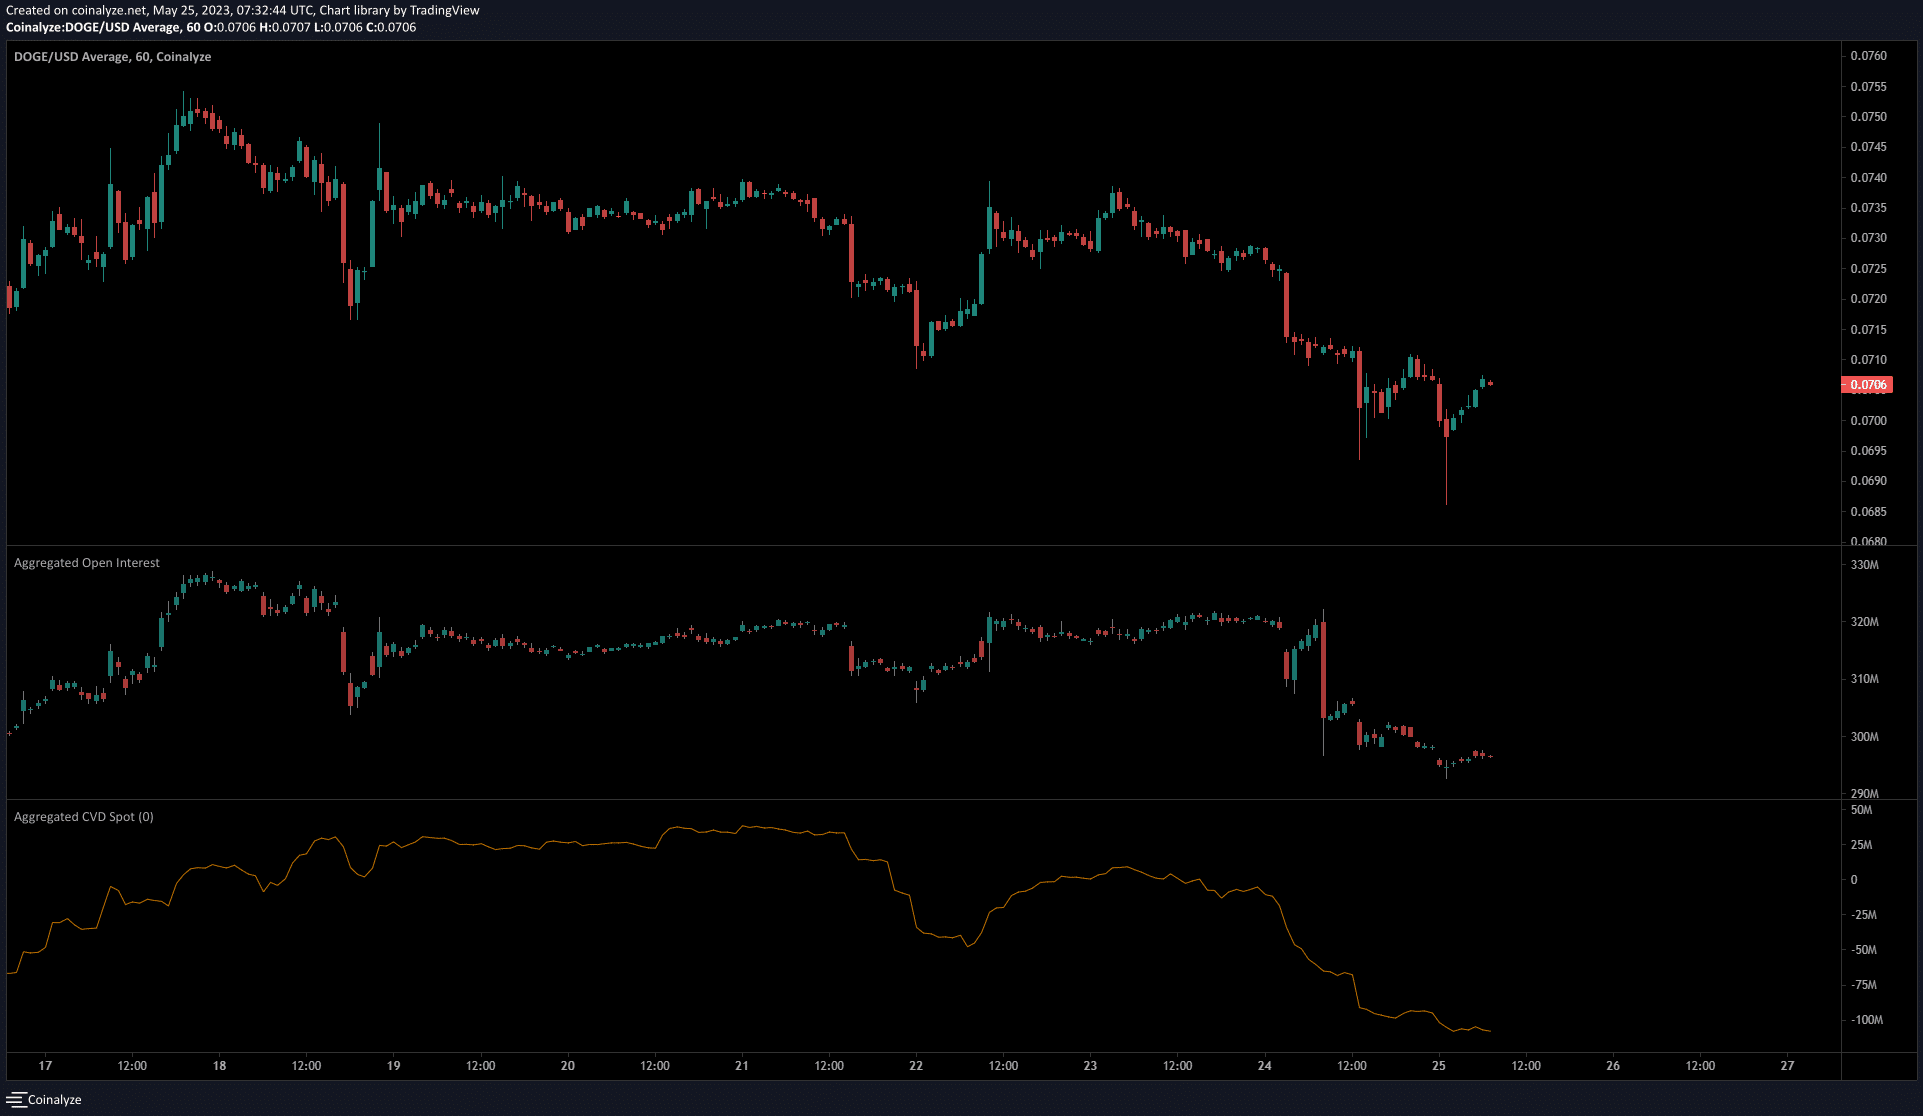
The Open Interest and spot CVD underlined bearish strength. The OI saw a sharp plummet on 24 May, losing nearly $20 million on the charts in response to the drop in prices. This showed discouraged longs and dominant bearish sentiment.
The large downturn in the CVD was another sign that sellers were in power. The $0.07 area has acted as support since 20 March, with $0.066 and $0.0635 to watch out for further south.
![BUILDon [B]: Can perpetual traders beat the death cross?](https://ambcrypto.com/wp-content/uploads/2026/07/Abdul-41-e1783324405822.webp)