Dogecoin can break past this bearish barrier, but caution is necessary for…

Disclaimer: The findings of the following analysis are the sole opinions of the writer and should not be considered investment advice.
Bitcoin [BTC] managed to hold on to the $19.8k mark and even forced its snout back above the $21k mark. Yet, the longer-term market structure remained bearish for Bitcoin. It was bearish for Dogecoin [DOGE] as well.
Dogecoin traded at $0.73 in the summer of 2021 but has fallen 90% in the past 14 months. It now sat beneath a resistance zone, and the gains of the past week could be quickly wiped out.
DOGE- 1-Day Chart
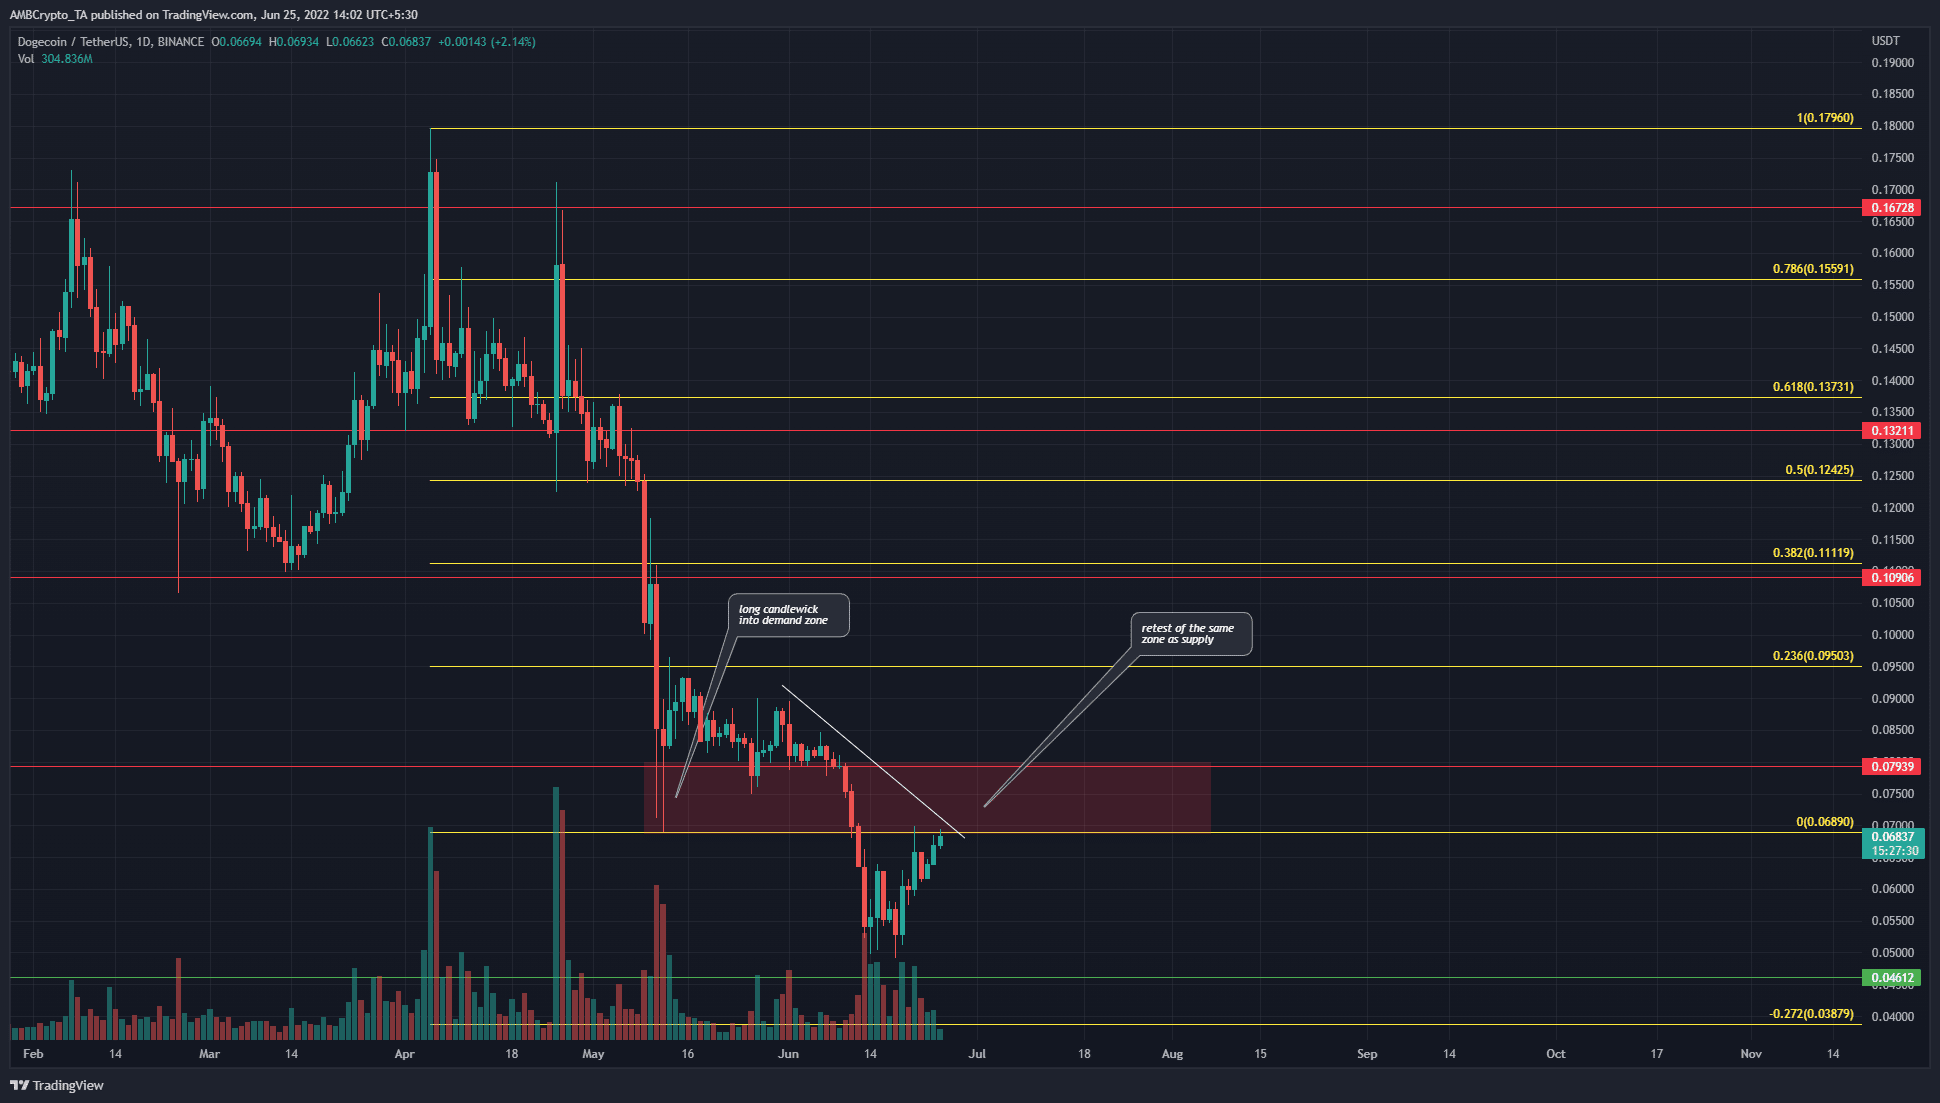
DOGE has been on a steady downtrend in recent weeks, especially since the pump to $0.17 in early April. Going back much further on the charts, DOGE has been on a higher timeframe downtrend since August 2021. That would make it a 10-month downtrend, interspersed by shorter timeframes of rapid rallies which were quickly sold off.
The Fibonacci retracement levels (yellow) were drawn based on DOGE’s move down from $0.179 to $0.0689. The levels plotted have acted as support and resistance, and also presented certain extension levels such as the 27.2% level at $0.0388 as support.
In May 2022, the price tested the $0.068-$0.08 area on multiple days in search of demand. However, the sellers eventually came out on top.
At press time, the price was on the verge of testing this former demand area from the south. This would be a bearish retest, and as things stood, it appeared likely that another move downward could occur.
Rationale
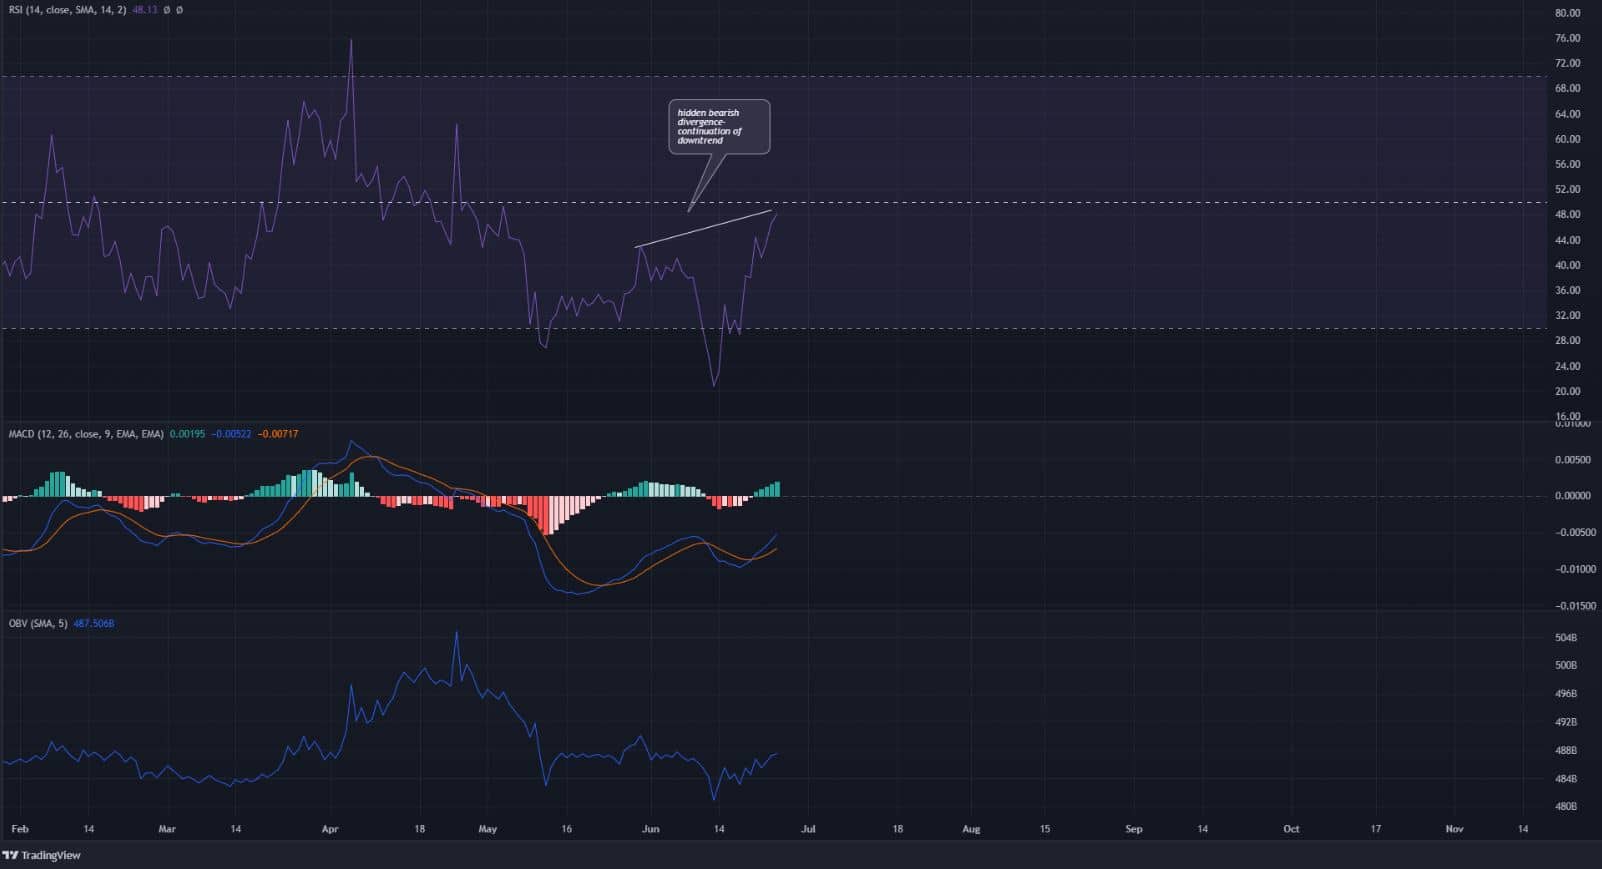
The RSI rose higher even as the price made a lower peak, highlighted in white. This was a hidden bearish divergence between momentum and price and was indicative of a continuation of the downtrend.
Moreover, the RSI remained beneath the neutral 50. Similarly, the MACD also moved beneath the zero line. If the indicators flipped to bullish, while DOGE also managed to climb past $0.08 and retest it as support, then the bearish bias would weaken somewhat.
In the meantime, the evidence remained bearish. The OBV has also snaked its way lower on the charts to highlight a lack of demand in the past two months.
Conclusion
The price was about to retest the former demand zone at around the same time the RSI would retest neutral 50 as resistance. The OBV showed no significant buyers in the market, and the next few days could see DOGE face rejection at resistance.


