Dogecoin: How to map the potential of this breakout

Disclaimer: The findings of the following analysis are the sole opinions of the writer and should not be considered investment advice
After reversing from the $0.3261-level, Dogecoin (DOGE) was on a long-term downslide for over four months. This bearish phase saw a down-channel trajectory (white).
From here on, the down-channel breakout could propel further recovery towards the $0.15-$0.16 zone. Then, it would likely face resistance near its 200 EMA pullback before the bulls gather more force to alter its long-term downtrend.
At press time, DOGE was trading at $0.1526, up by 9.71% in the last 24 hours.
DOGE Daily Chart
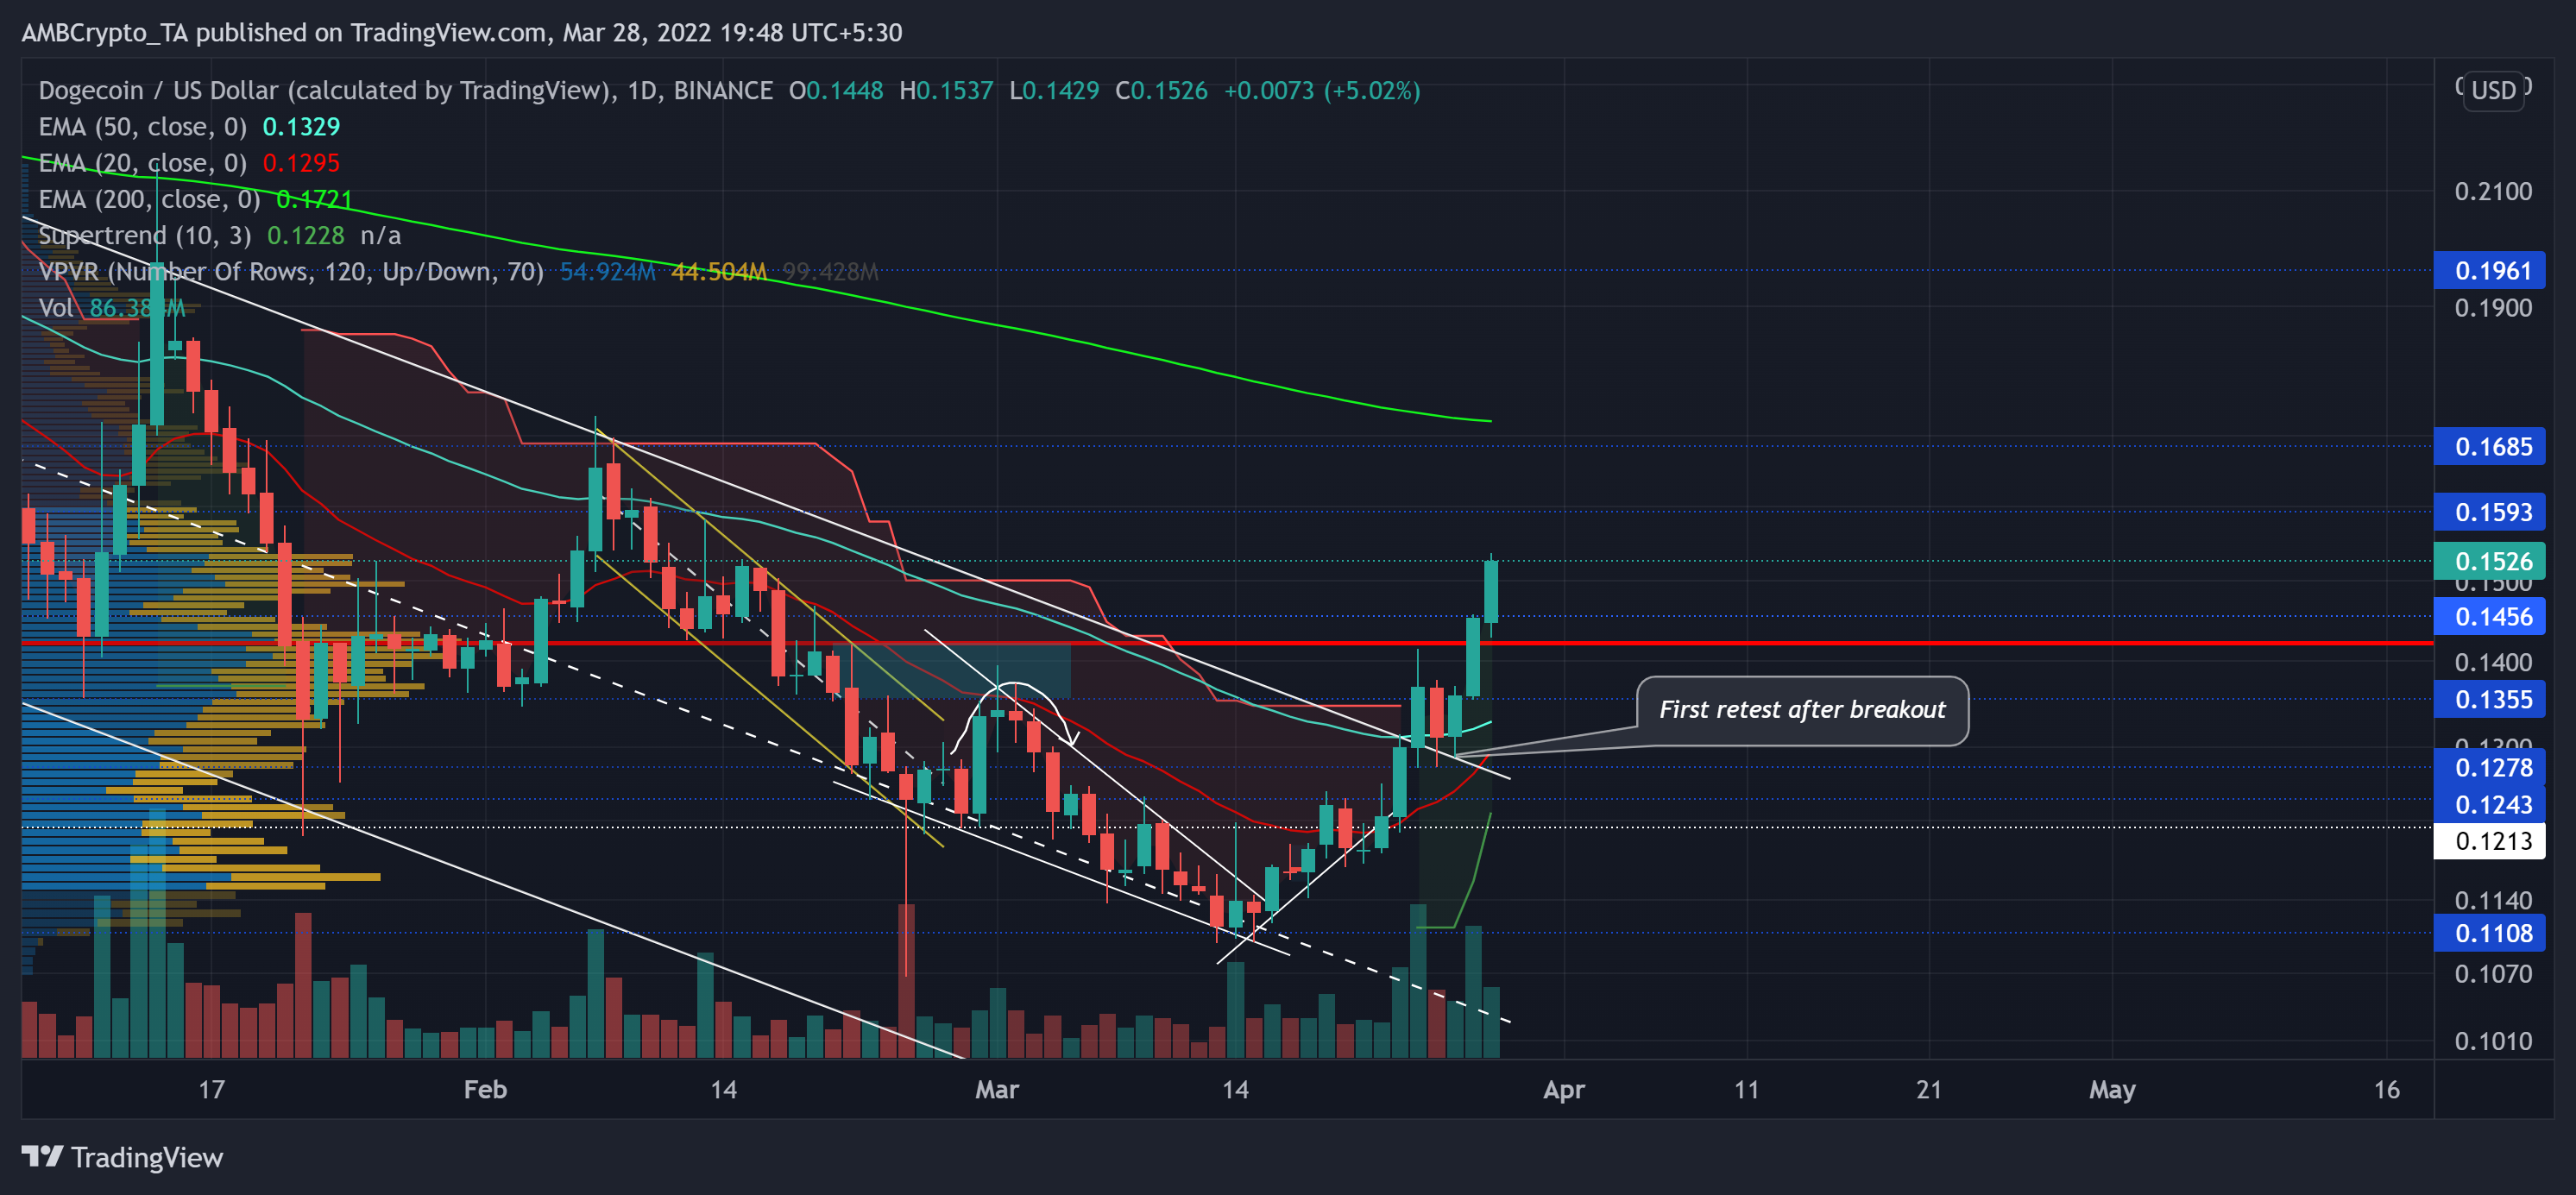
Since its October highs, the alt has declined by over 70% as it plunged towards its ten-month low on 24 February. During this fall, the upper trendline of the down-channel was a strong selling point, one that shunned most bullish recovery attempts.
The downfall led the altcoin to lose the crucial $0.14-mark POC, one that offered the highest liquidity in the last three months. The latest recovery saw a falling wedge breakout after the alt reversed from its long-term $0.11 support. As a result, the price jumped to its 20/50 EMA and reclaimed the $0.14-support.
With the Supertrend finally entering the green zone, the bulls would aim to steer the current rally towards its 200 EMA to challenge its long-term trend. On its way, the $0.15-mark could pose barriers in the short term.
Thus, bulls still need to ramp up the current volumes to trigger a sustained rally. Any retracements would continue to find support near the $0.14-level.
Rationale
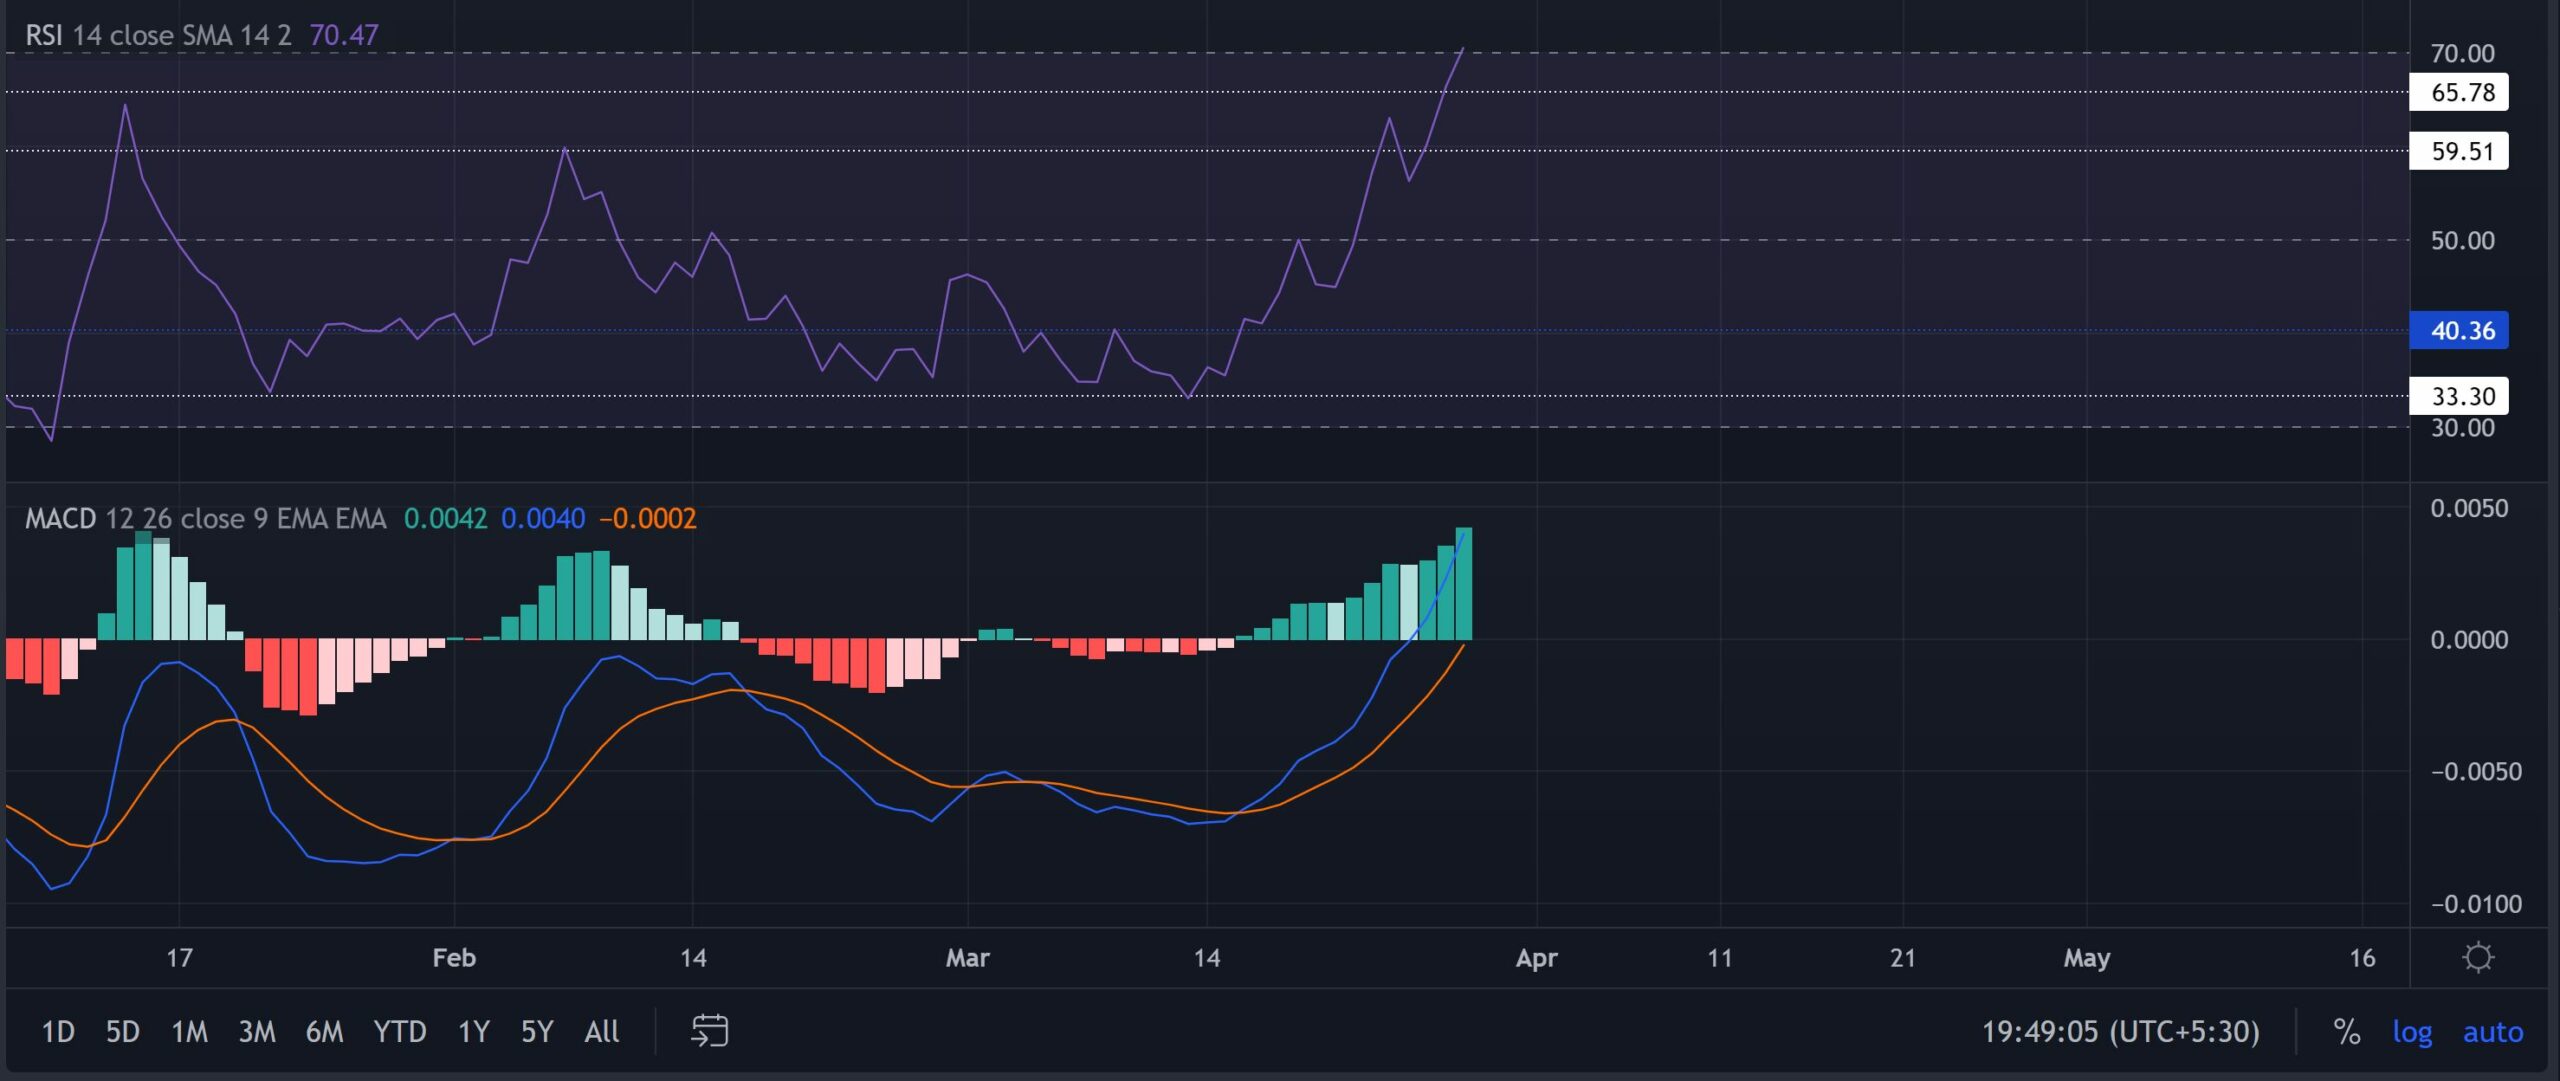
The RSI pictured solid recovery in the last ten days from the 33-base. Now that it is heading into the overbought territory, a potential reversal could be lurking around the corner. In such a case, a near-term pullback before an uptick would be likely.
The MACD line finally closed above the zero-line and affirmed greater buying momentum. Thus, this trajectory kept the bullish hopes of testing the 200 EMA alive.
Conclusion
With the 20 EMA endeavoring to jump above the 50 EMA, the long-term tendencies favoured the bulls. To top it up, the Supertrend corresponded with this sentiment. But with the overbought RSI, a potential retest of the $0.14-level before a sustained upturn could be likely.
Moreover, the dog-themed coin shares an 87% 30-day correlation with the king coin. Thus, keeping an eye on Bitcoin’s movement would complement these technical factors.


