Dogecoin: Important resistance level on lower timeframe will be…

Disclaimer: The findings of the following analysis are the sole opinions of the writer and should not be considered investment advice.
The Dogecoin price chart has followed the longer-term trend of Bitcoin quite closely since April. In fact, going back as far as December, DOGE still moved upward when Bitcoin had green trading days.
However, Dogecoin lost value quickly on days when Bitcoin slid lower. Combined with technical indicators and the market structure on the chart, it can be concluded that sellers remained dominant in the Dogecoin market.
DOGE- 1-Day Chart
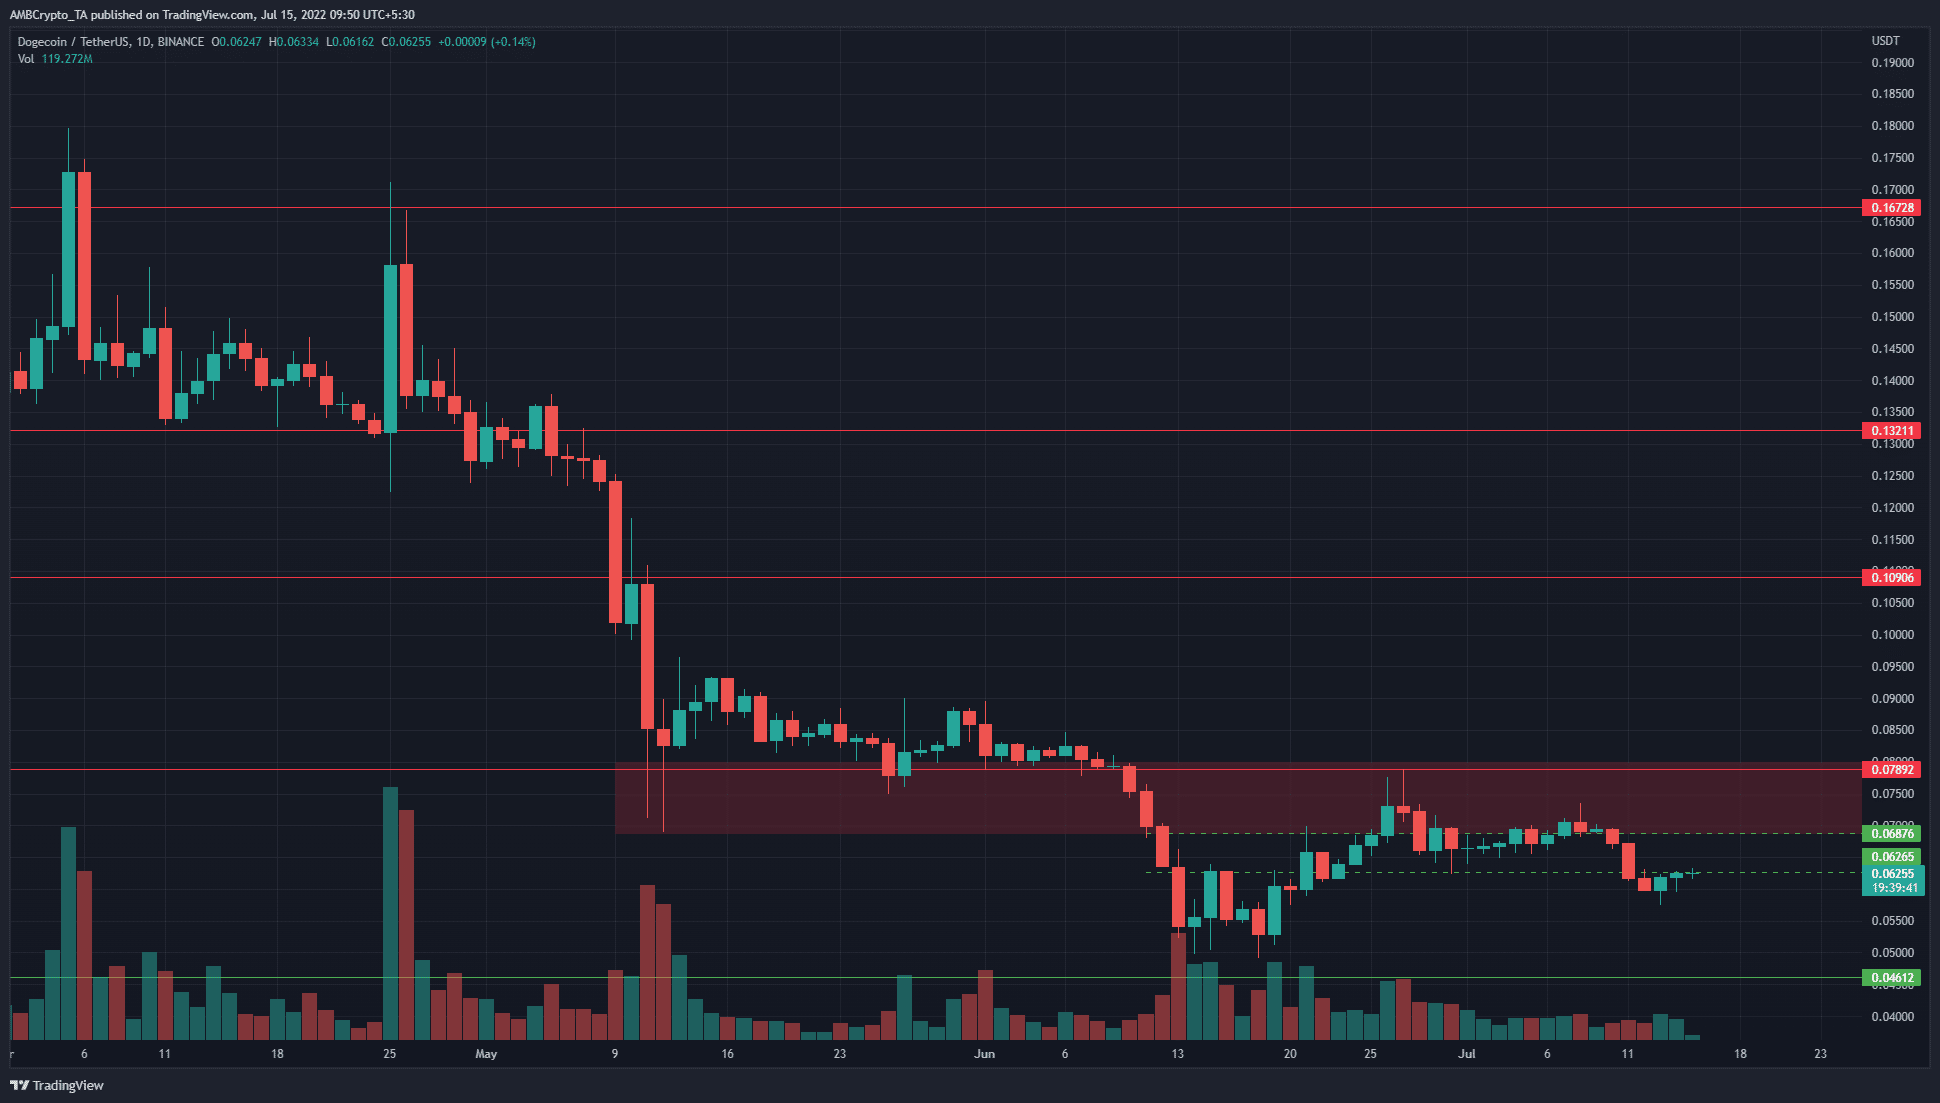
The 12 May crash saw Dogecoin drop from $0.085 to $0.07 in a single day, a near 18% move. However, the trading session for the day closed at $0.082, which meant that the entire $0.07-$0.08 area had acted as a zone of demand.
In the following weeks, this zone held up against selling pressure for a while but eventually gave way. Thereafter, it has been tested as a resistance area. The buyers have tried and failed to force a Dogecoin rally past the $0.075 region.
In the past few months, the price has posted a series of lower highs on the chart, which indicated a long-term downtrend in progress. This downtrend remained unbroken, as none of the recent lower highs have yet been breached.
The $0.068 and $0.062 levels will likely be important resistance levels on lower timeframes as well.
Rationale
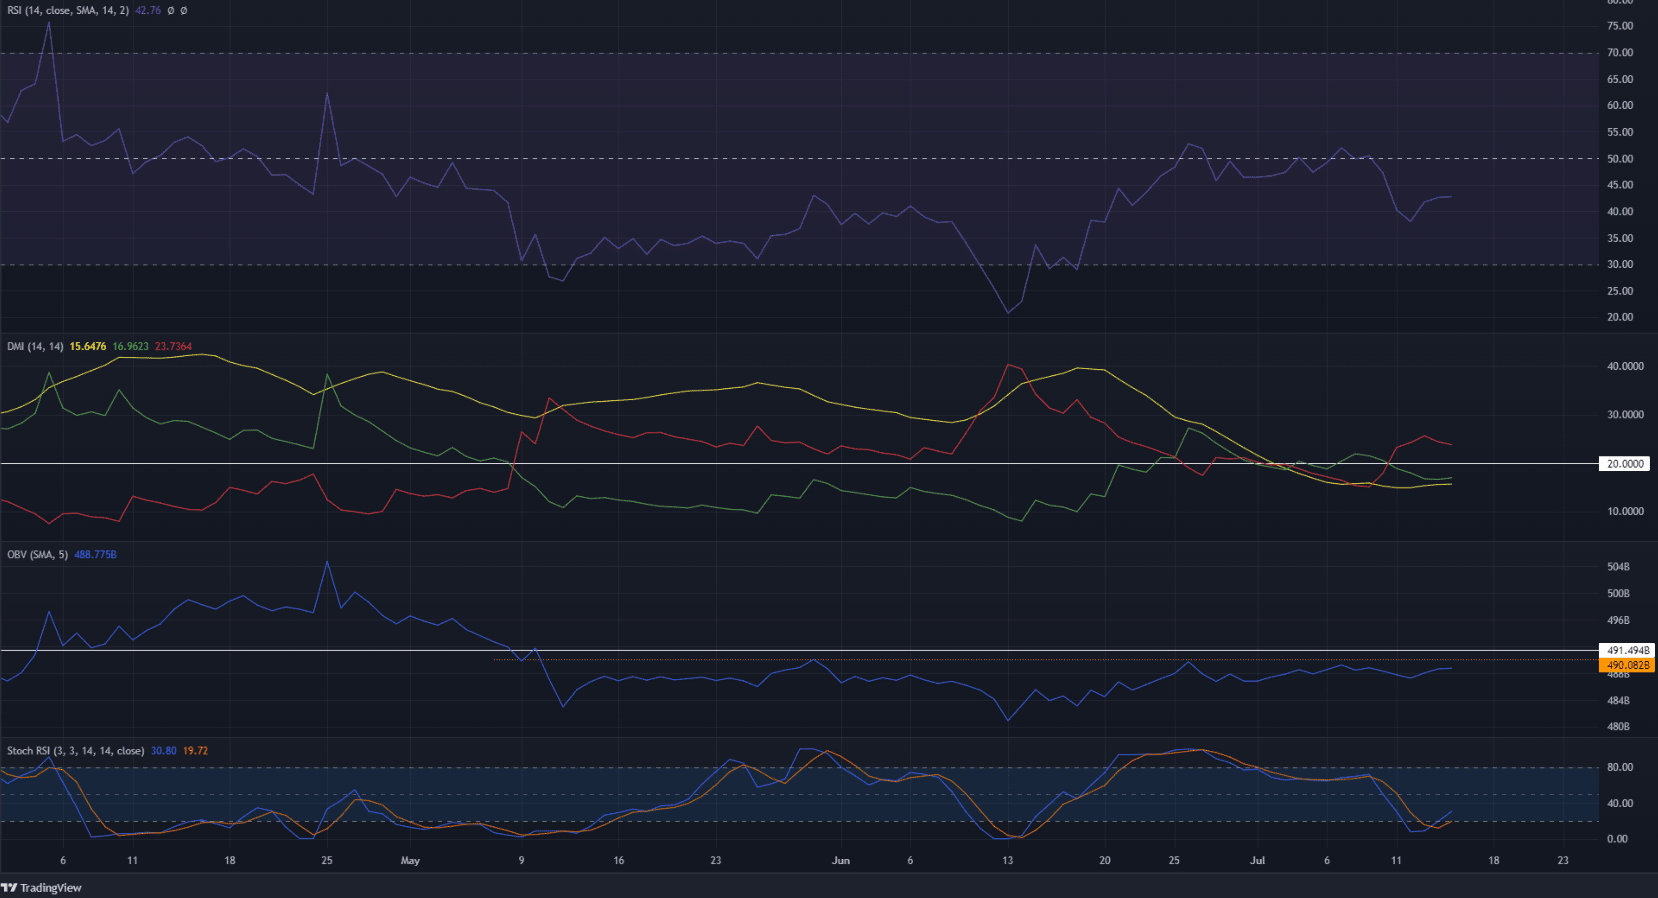
The indicators also supported a bearish bias for DOGE. The RSI remained below the neutral 50 line, to show that the downtrend was still in play. The DMI did not show a strong trend to be ongoing as the ADX (yellow) was beneath the 20 mark.
The OBV has seen some gains in the past month, but it still remained below two crucial resistance levels. The Stochastic RSI formed a bullish crossover in oversold territory, but this need not presage a move upward for Dogecoin.
Conclusion
Overall, the market structure favored the bears. Although Dogecoin saw a decent bounce from the $0.05 lows of June, it was likely to face stiff resistance to the north. Hence, selling opportunities were more likely to present themselves in the next couple of weeks.


