Dogecoin, Polkadot, MATIC Price Analysis: 29 October

A majority of coins in the global crypto market stood in green on 29 October. Altcoins showed positive signals. Dogecoin touched its eleven-week high, and Polygon (MATIC) hit its five-month high over the past two days.
Polkadot and MATIC continued to project overall bullish tendencies on their charts. However, Dogecoin technicals hinteed towards possible ease in bullish momentum.
Dogecoin (DOGE)
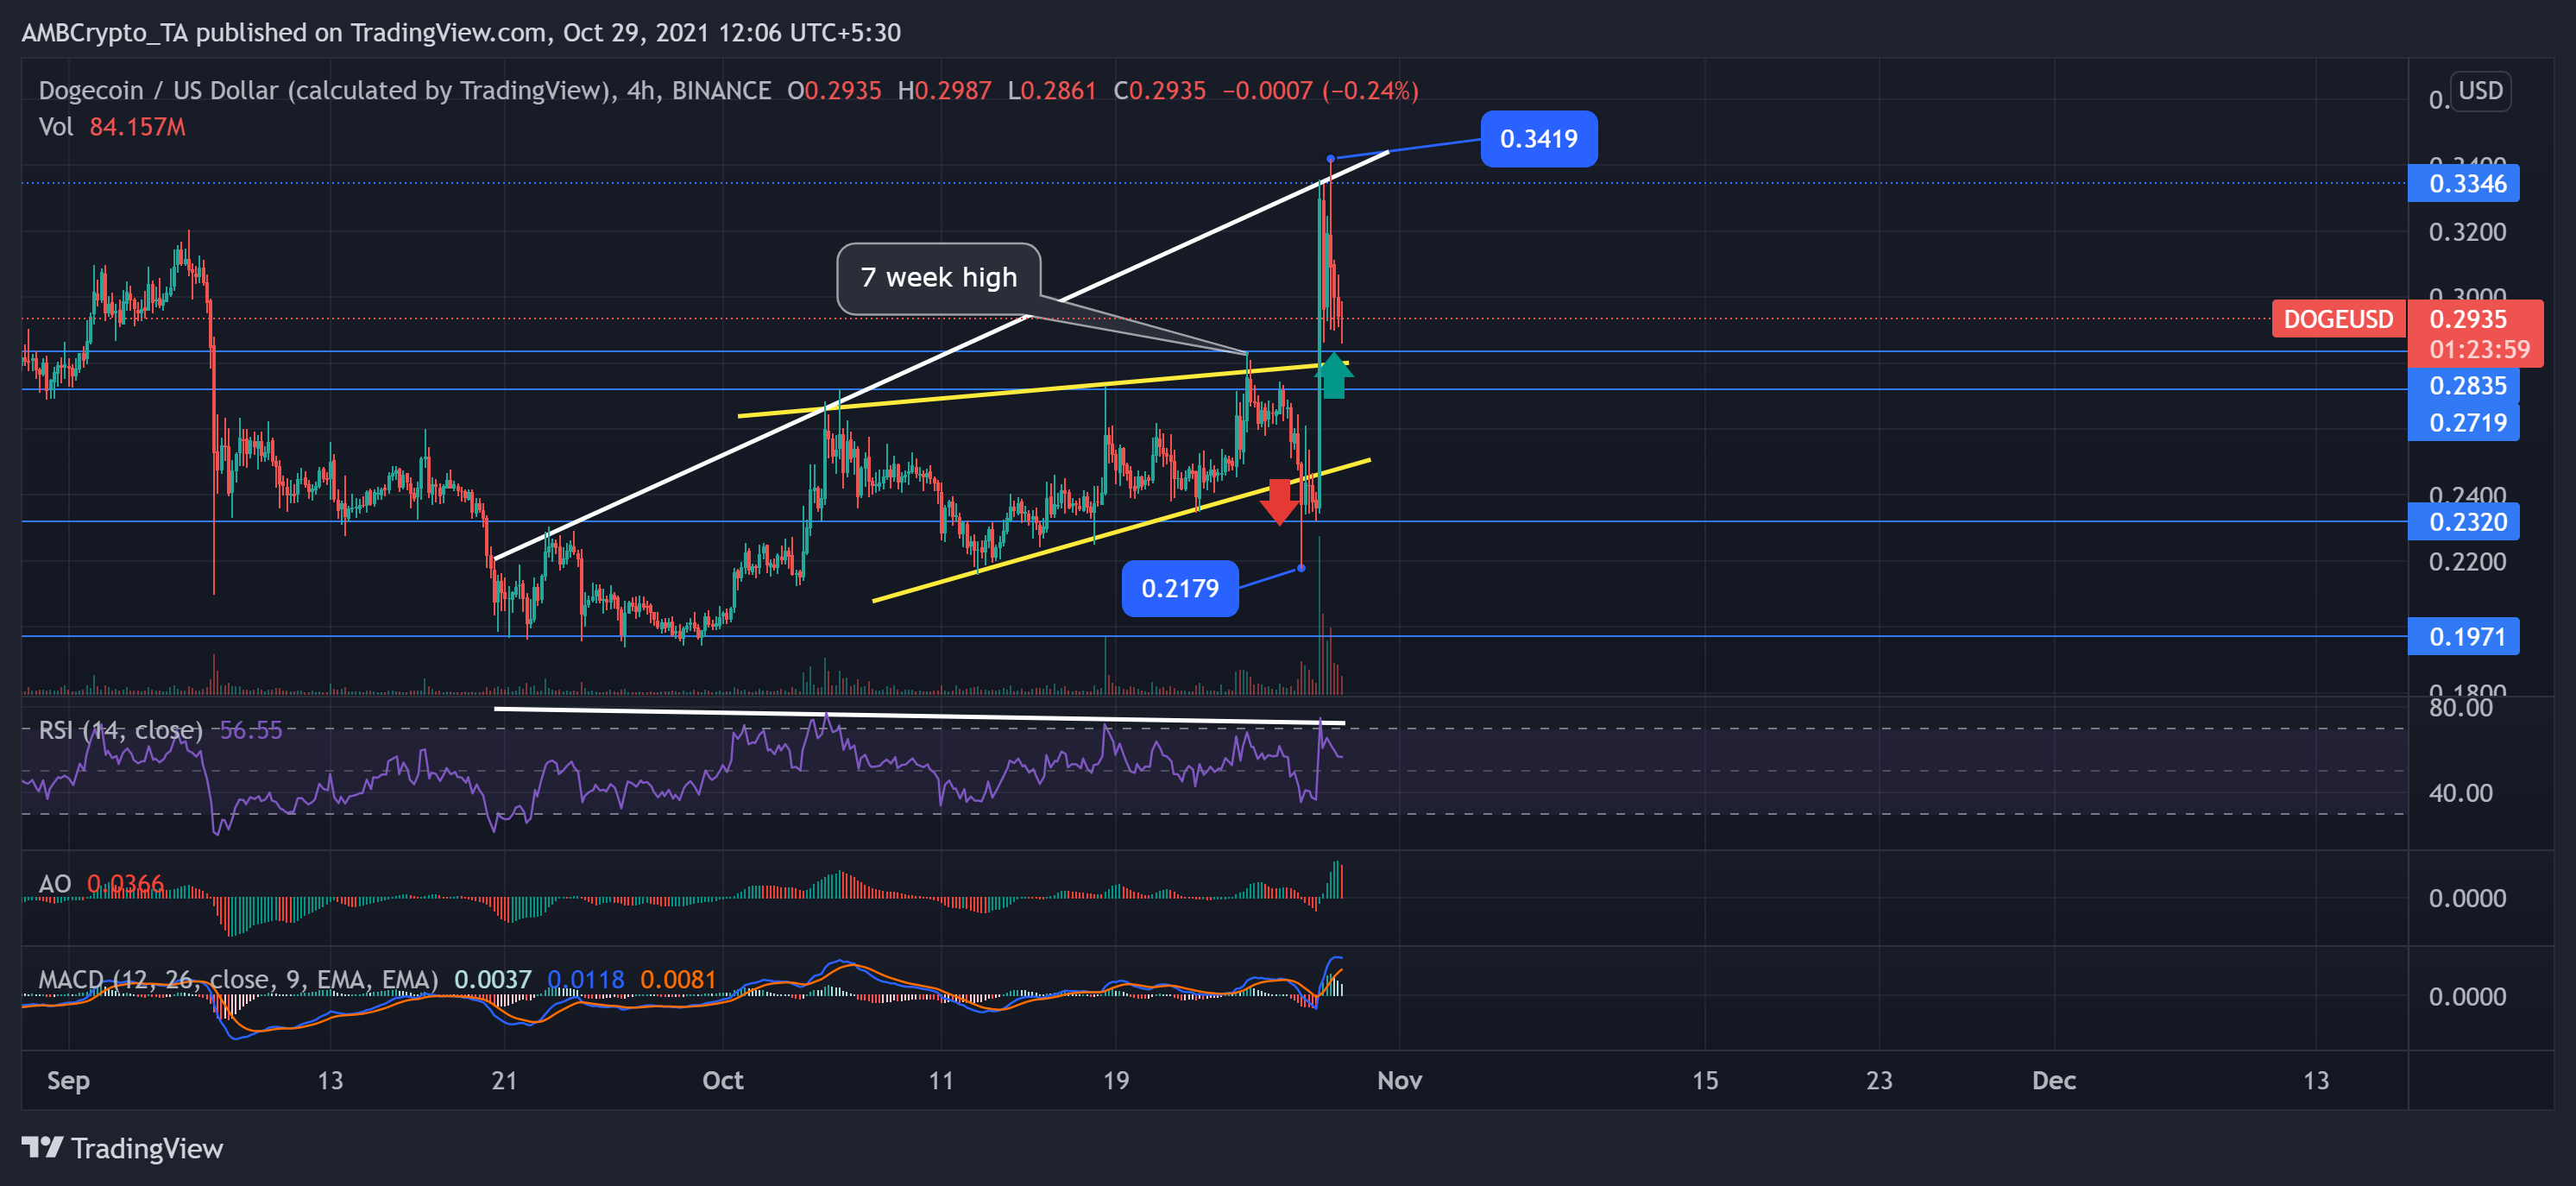
Over the past month, DOGE traversed within a rising wedge until it hit its seven-week high on 25 October. After which, the altcoin witnessed a correction and headed south after breaching the lower trendline to poke its 15-day low at $0.2179.
From 27 October, DOGE bulls exerted immense pressure as its rival Shiba Inu overtook the meme coin in its market share. Since then, the price rally skyrocketed to breach the upper trendline and touch its eleven-week high at $0.3419. Also, the trendline break accompanied high trading volumes, signaling a healthy trend.
DOGE traded at $0.2935 after noting over 20% gain on its weekly charts and found support at $0.2835.
The Relative Strength Index (RSI) plunged from the overbought territory towards the midline over the last 24 hours, indicating a decreasing buying power.
Further, MACD flashed light green bars while the Awesome Oscillator (AO) flashed a red bar and thus affirmed the previous readings.
Polkadot (DOT)

The altcoin traded at $42.76 after noting a nearly 57.88% one-month ROI. Since the past month, DOT price action has displayed a bullish trajectory by oscillating in an ascending wedge pattern. The DOT bulls see the immediate resistance at $43.09. However, if they sustain their pressure, they can push it to $44.87. Also, the salient technical indicators pointed towards increasing buying strength.
The RSI stood near the midline after surging by nearly 15 points, indicating a significant decrease in selling power.
Additionally, the MACD and the AO flashed green signal bars affirming the previous readings.
MATIC
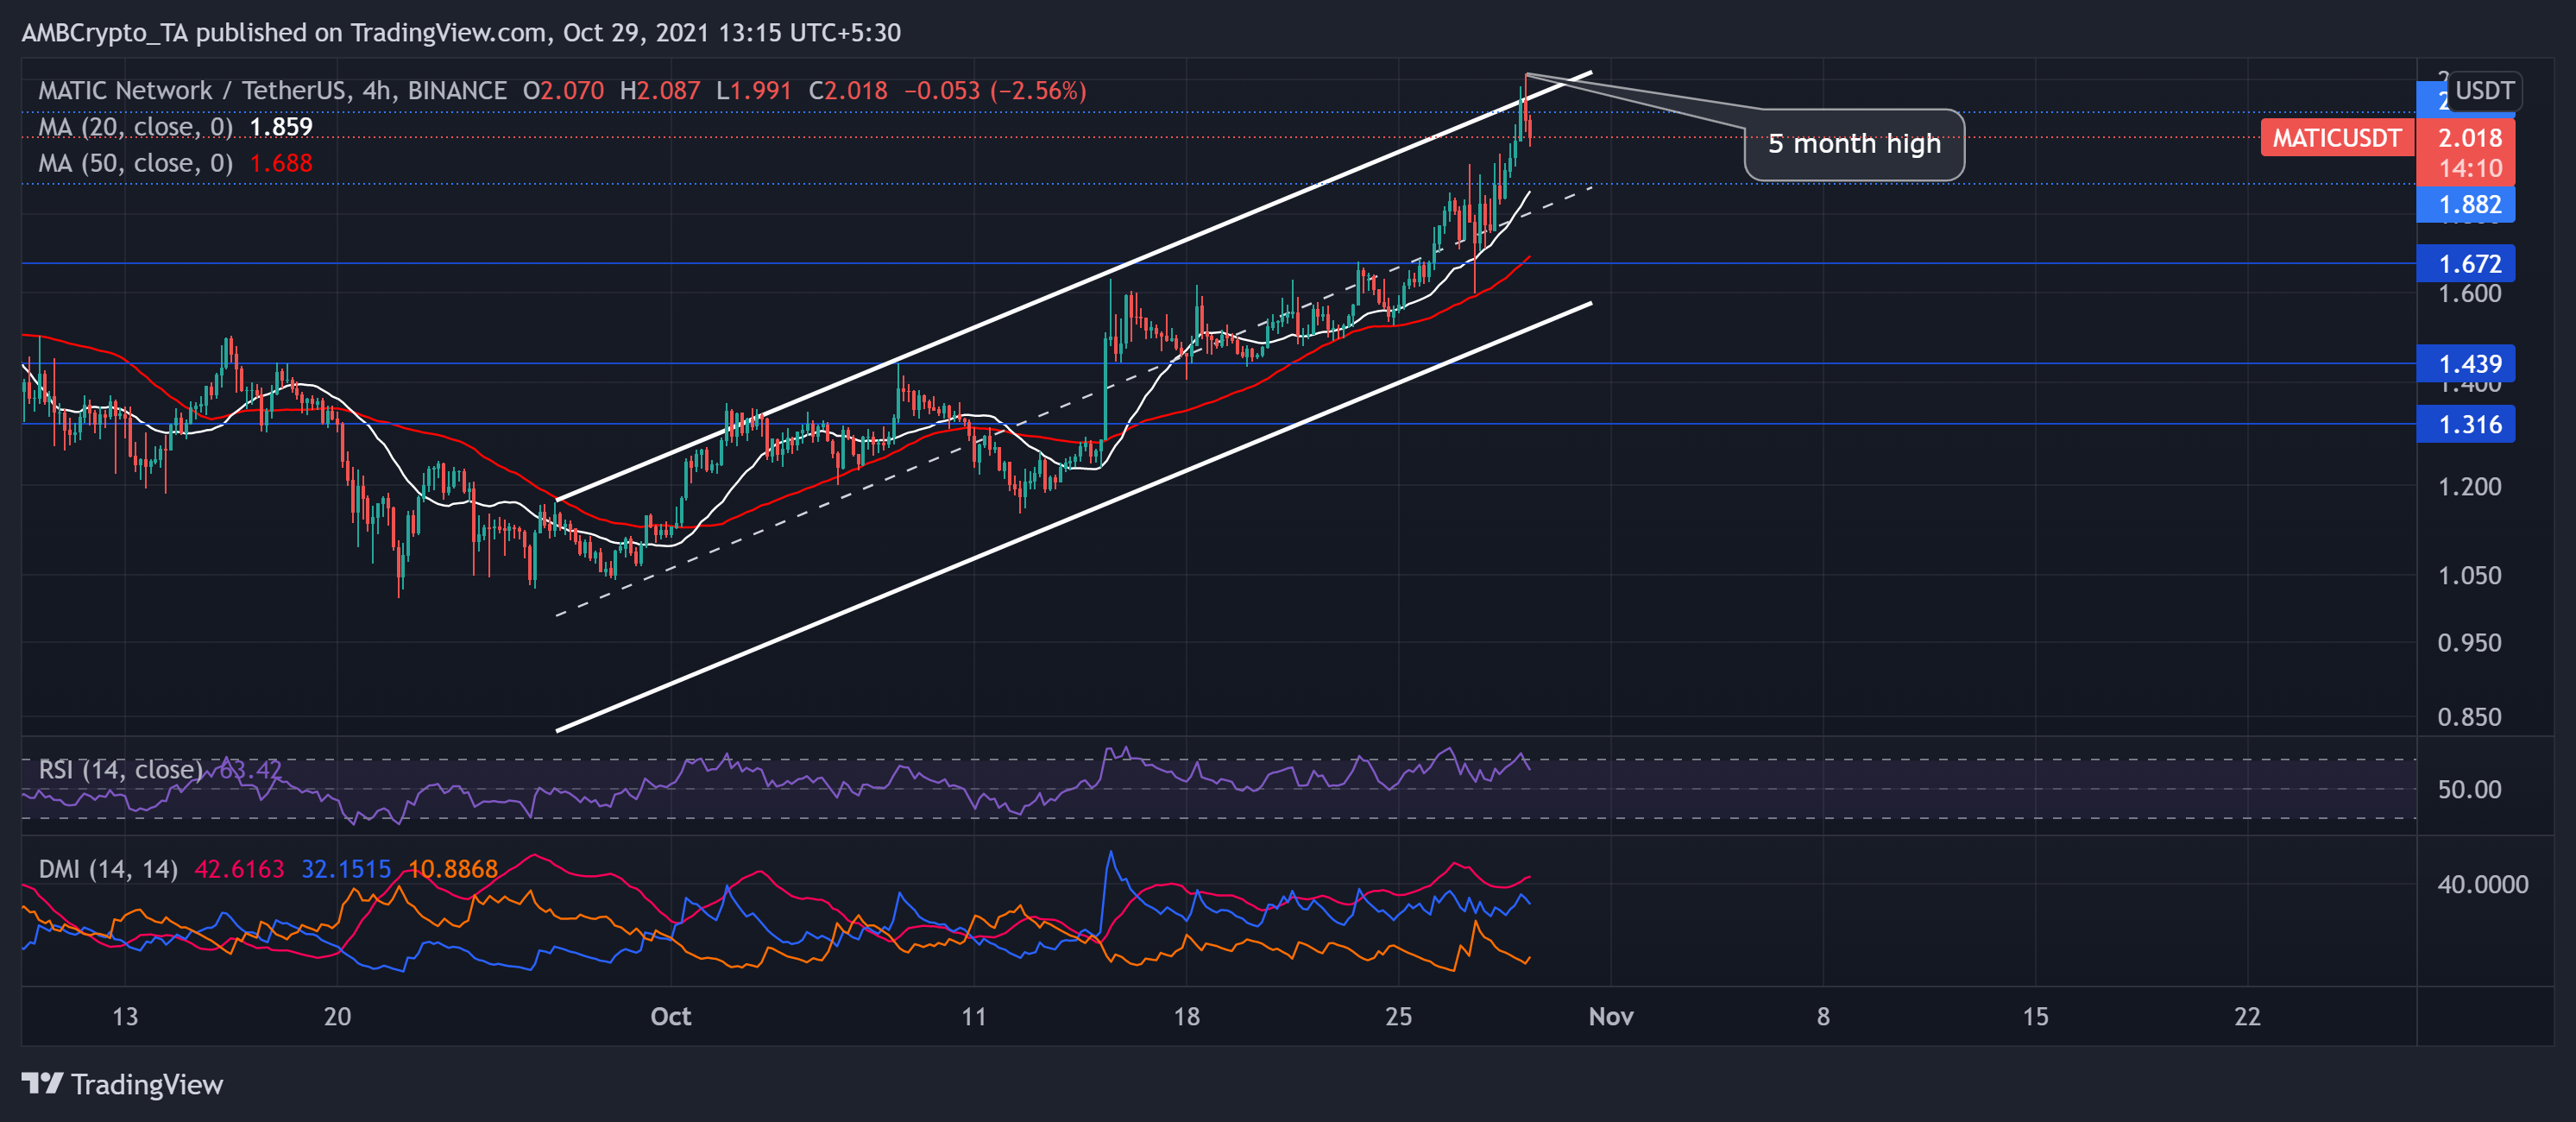
Since the inception of the month, MATIC price action undertook a bullish trajectory as the price bounced between the two parallel lines heading north. The digital currency noted a staggering 88% and 36% growth on its monthly and weekly charts, respectively. MATIC touched its five-month high on 29 October and bounced back between the parallel lines following the trend.
The trading price was above its 20-SMA and 50-SMA levels and visibly suggested that the momentum was with the buyers.
The RSI plunged by 10 points and headed towards the midline, indicating decreasing buying strength in the near term.
Moreover, the DMI depicted the buying strength but pointed at possible ease in bullish momentum as the DI line looked downwards.


