Dogecoin, Solana, Bitcoin Cash Price Analysis: 23 December

Although bears refrained from giving the bulls a free hand, Bitcoin Cash managed to cross its immediate hurdle and found support at the 23.6% Fibonacci level.
On the other hand, even though Dogecoin and Solana technicals displayed a slightly bullish bias, they encountered bearish divergences with the Volume Oscillator.
Dogecoin (DOGE)
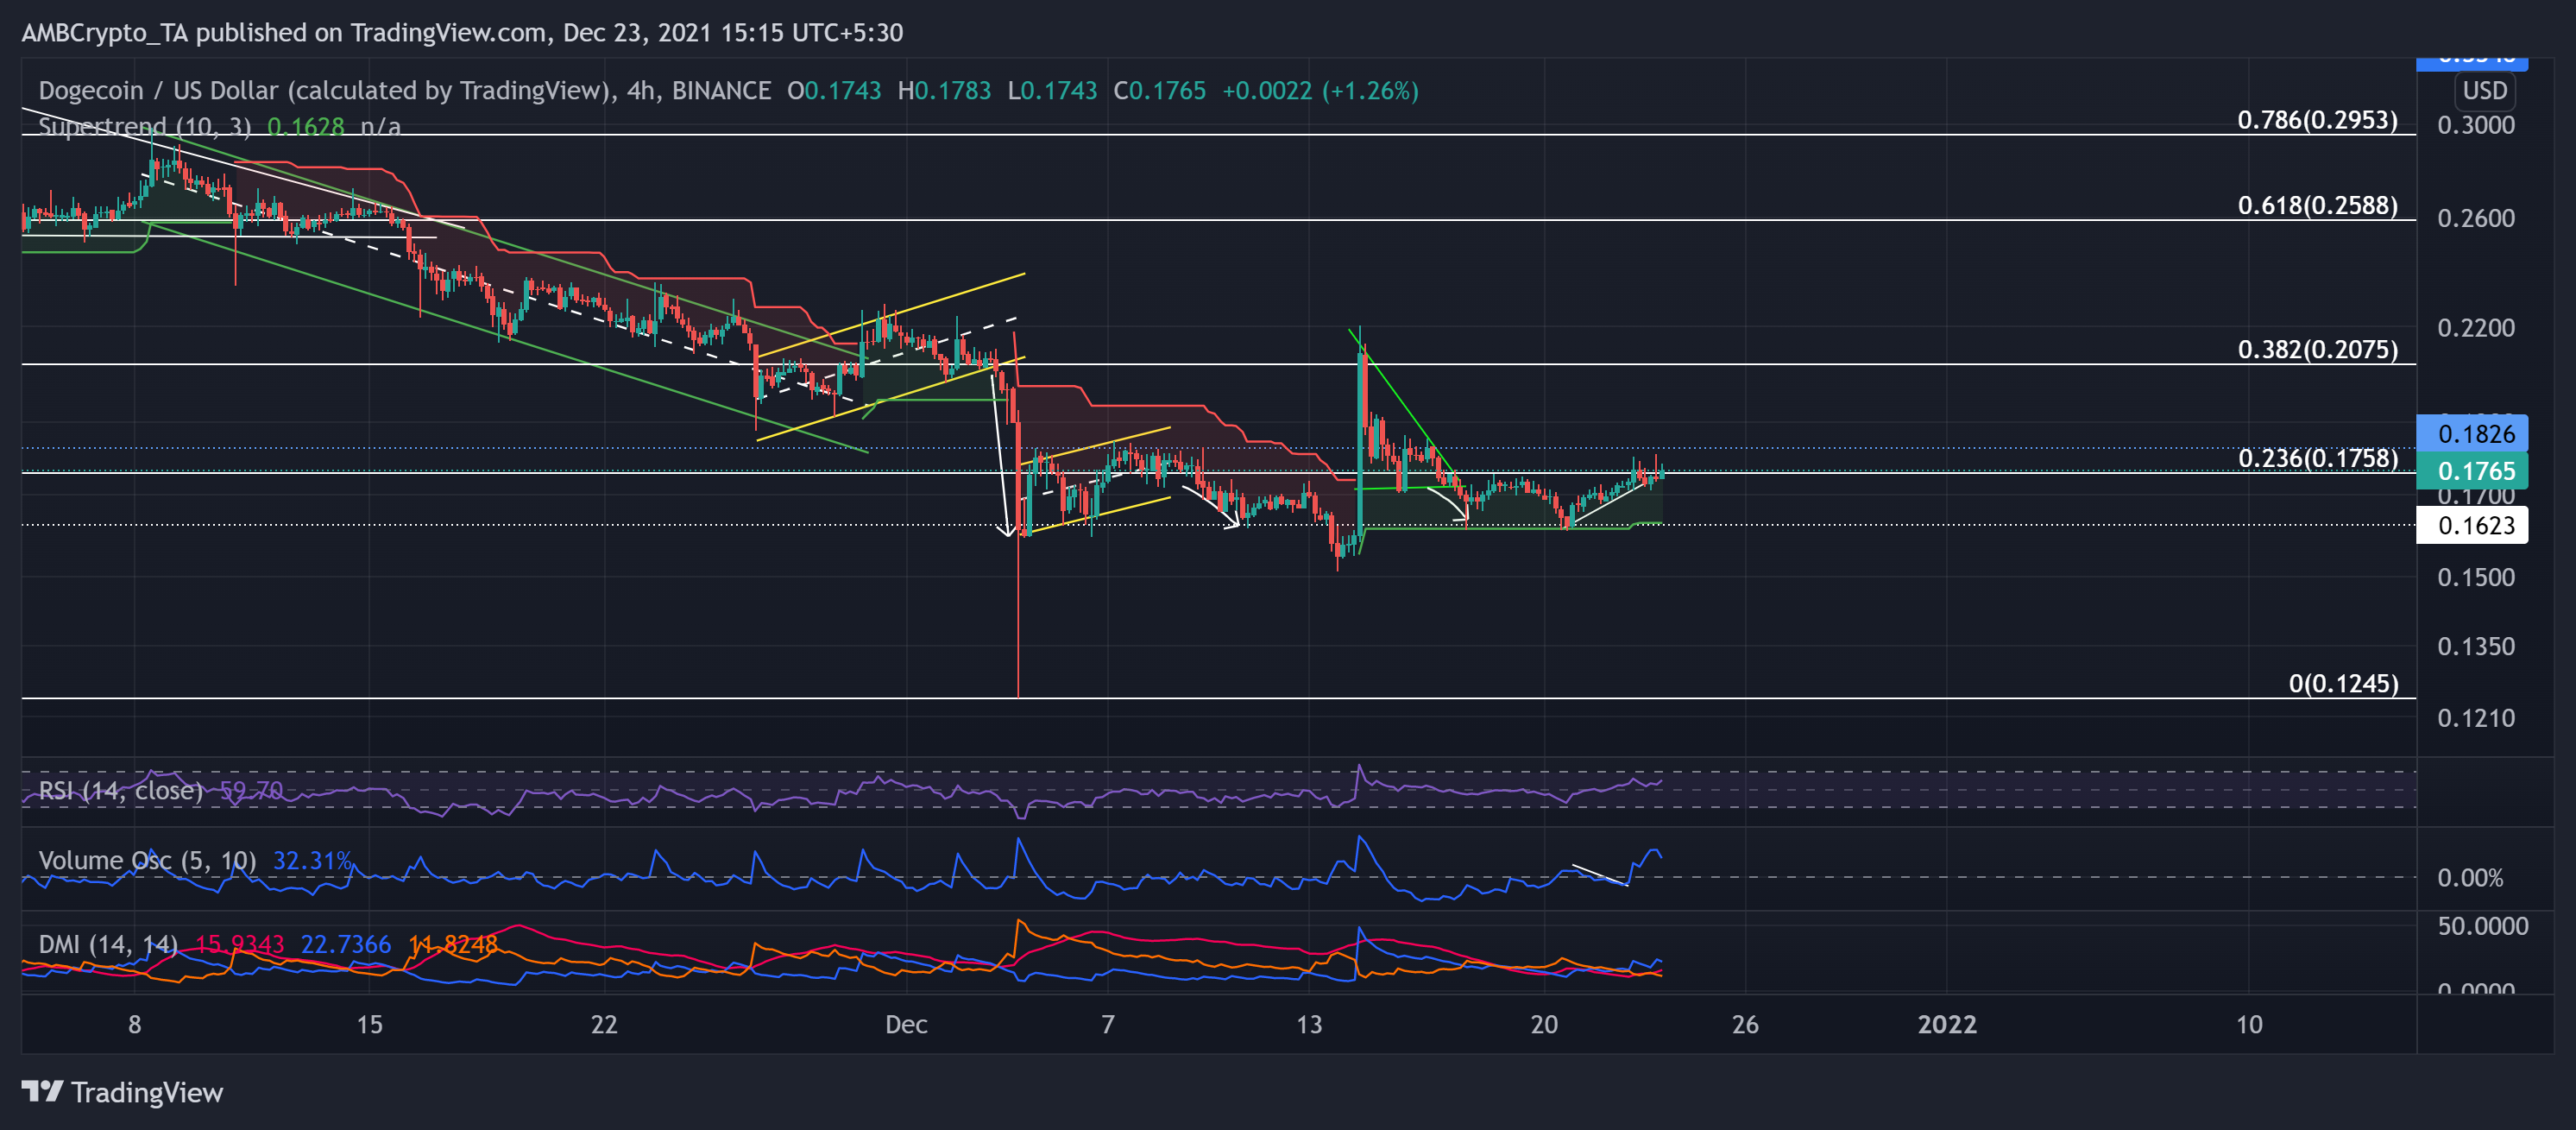
After retracing by nearly 48.96% over the past 55 days, the largest meme coin found an oscillating range between the $0.162 and $0.182-mark. The bears retested the $0.162-level six times over the past 19 days, but the bulls held their ground.
It becomes crucial to note that the Volume Oscillator marked lower lows while the price action saw an upturn towards the 23.6% Fibonacci level. Now, as DOGE crossed the $0.175-mark, the Supertrend seemed hopeful for the bulls as it flashed buy signals.
At press time, DOGE traded at $0.1765. The RSI saw a steady recovery over the past three days and chose the buying strength. Further, the DMI displayed a bullish bias but the ADX remained substantially weak.
Solana (SOL)
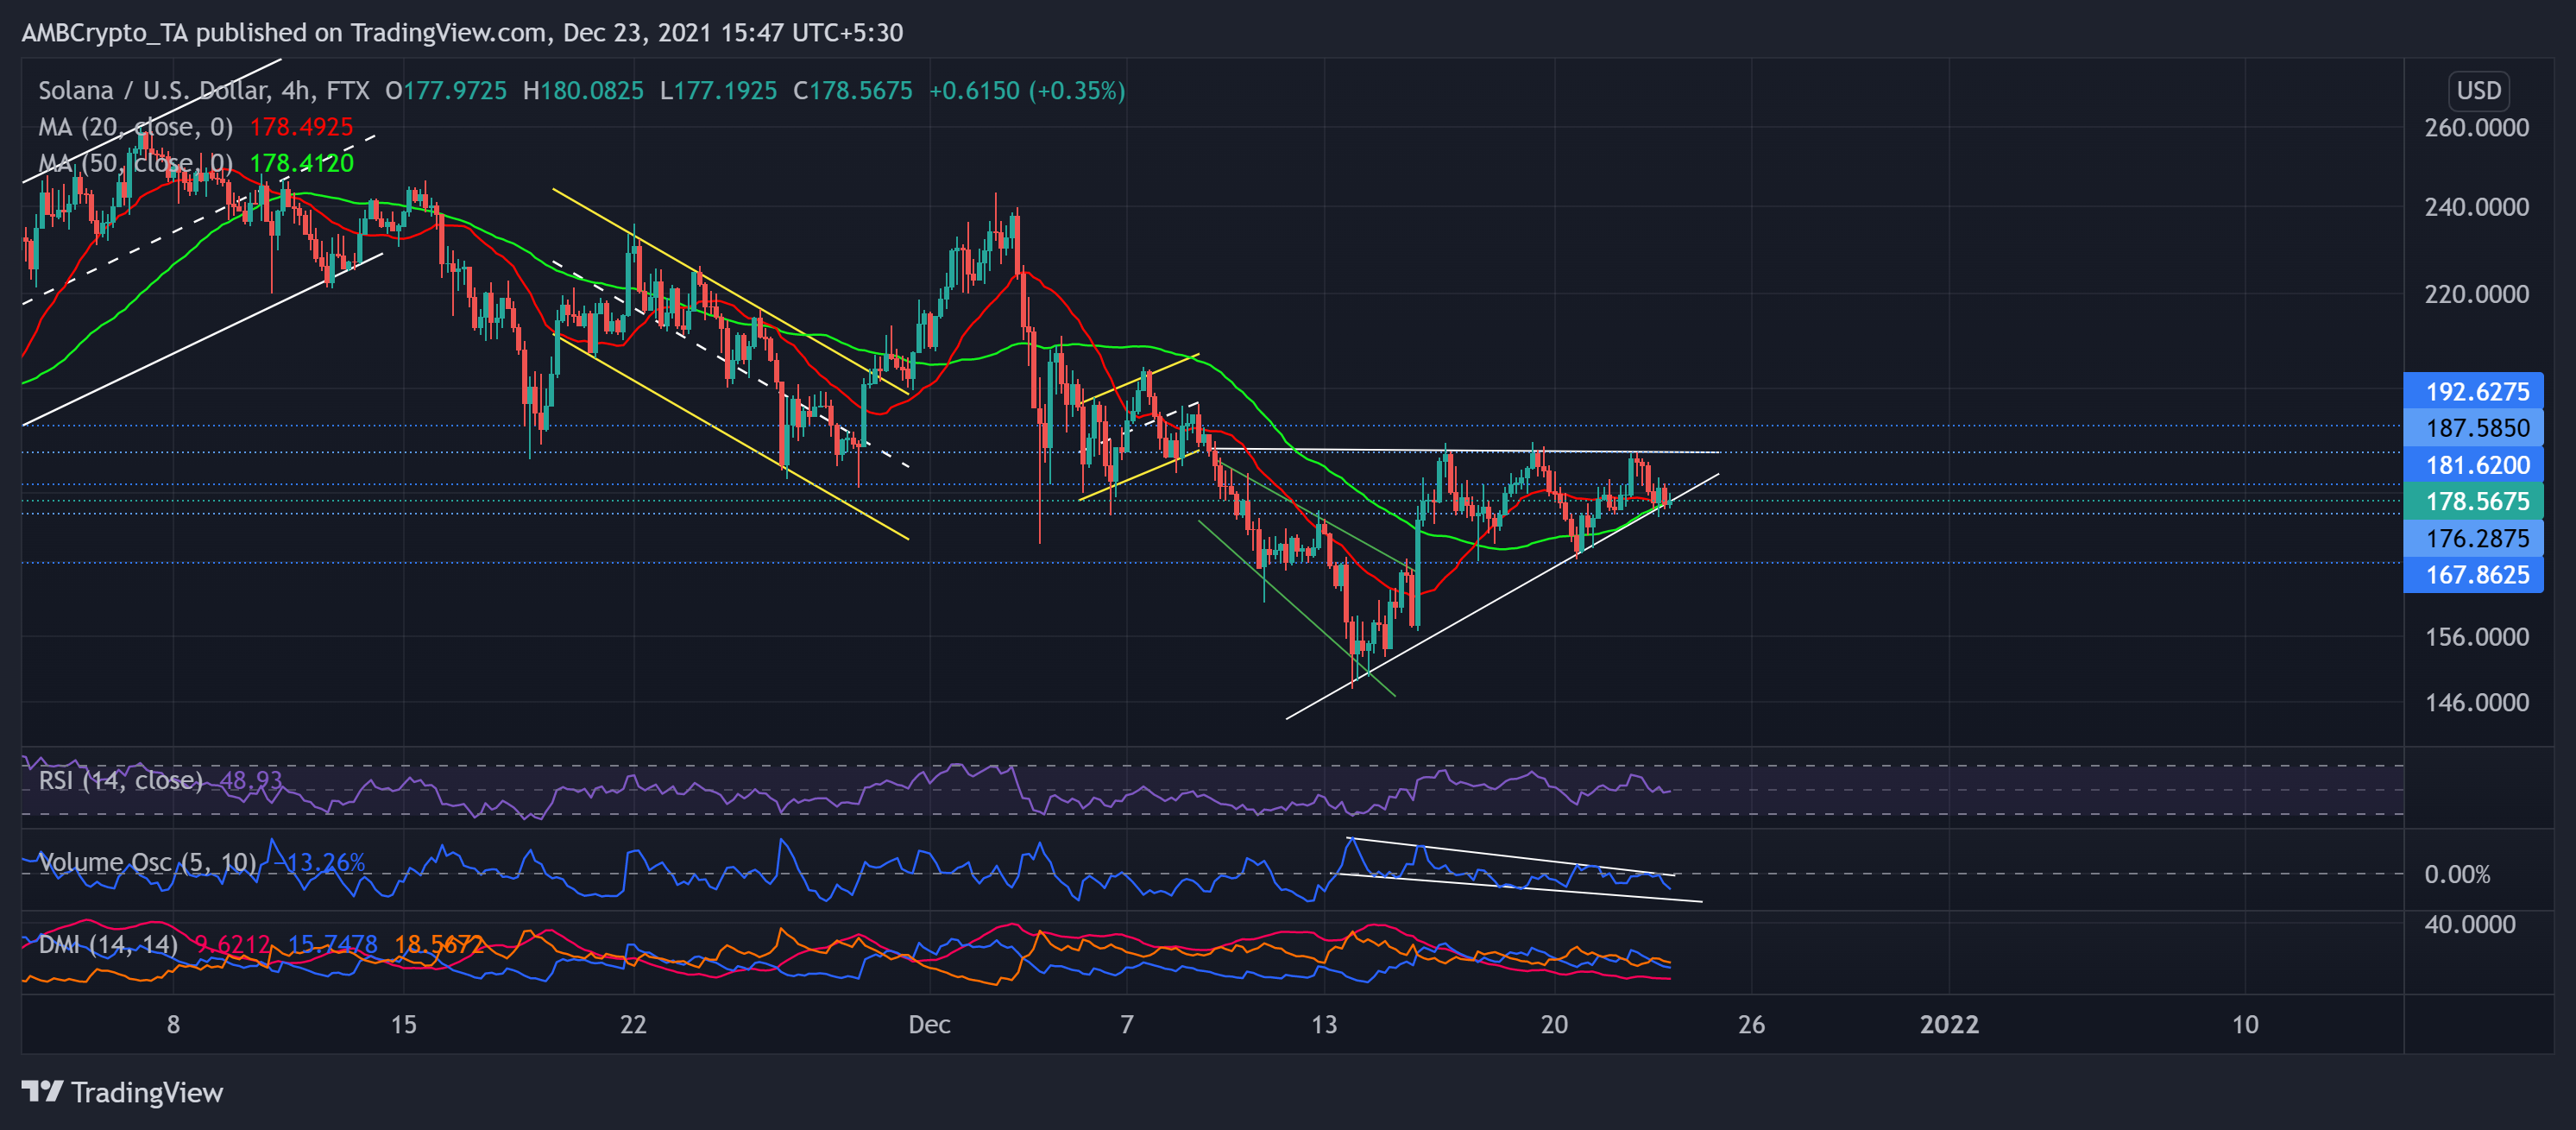
The $181-level became a vital mark for the alt since the falling wedge (green) breakout on 15 December. SOL bears have ensured this level but have failed to stop the bulls from marking higher lows over the past ten days.
Like DOGE, it is necessary to take note of the lower lows marked on the volume oscillator, indicating a weak bullish move. The fifth-largest crypto formed an ascending triangle on its 4-hour chart after a v-shaped recovery over the past three days.
The immediate testing support stood near the lower trendline (white) that coincided with the 20-50 SMA around the $178.4-mark.
At press time, SOL traded at $178.5675. The RSI flashed neutrality after being slightly below the midline. Further, DMI depicted a slight bearish bias. But the ADX displayed a weak directional trend for SOL.
Bitcoin Cash (BCH)
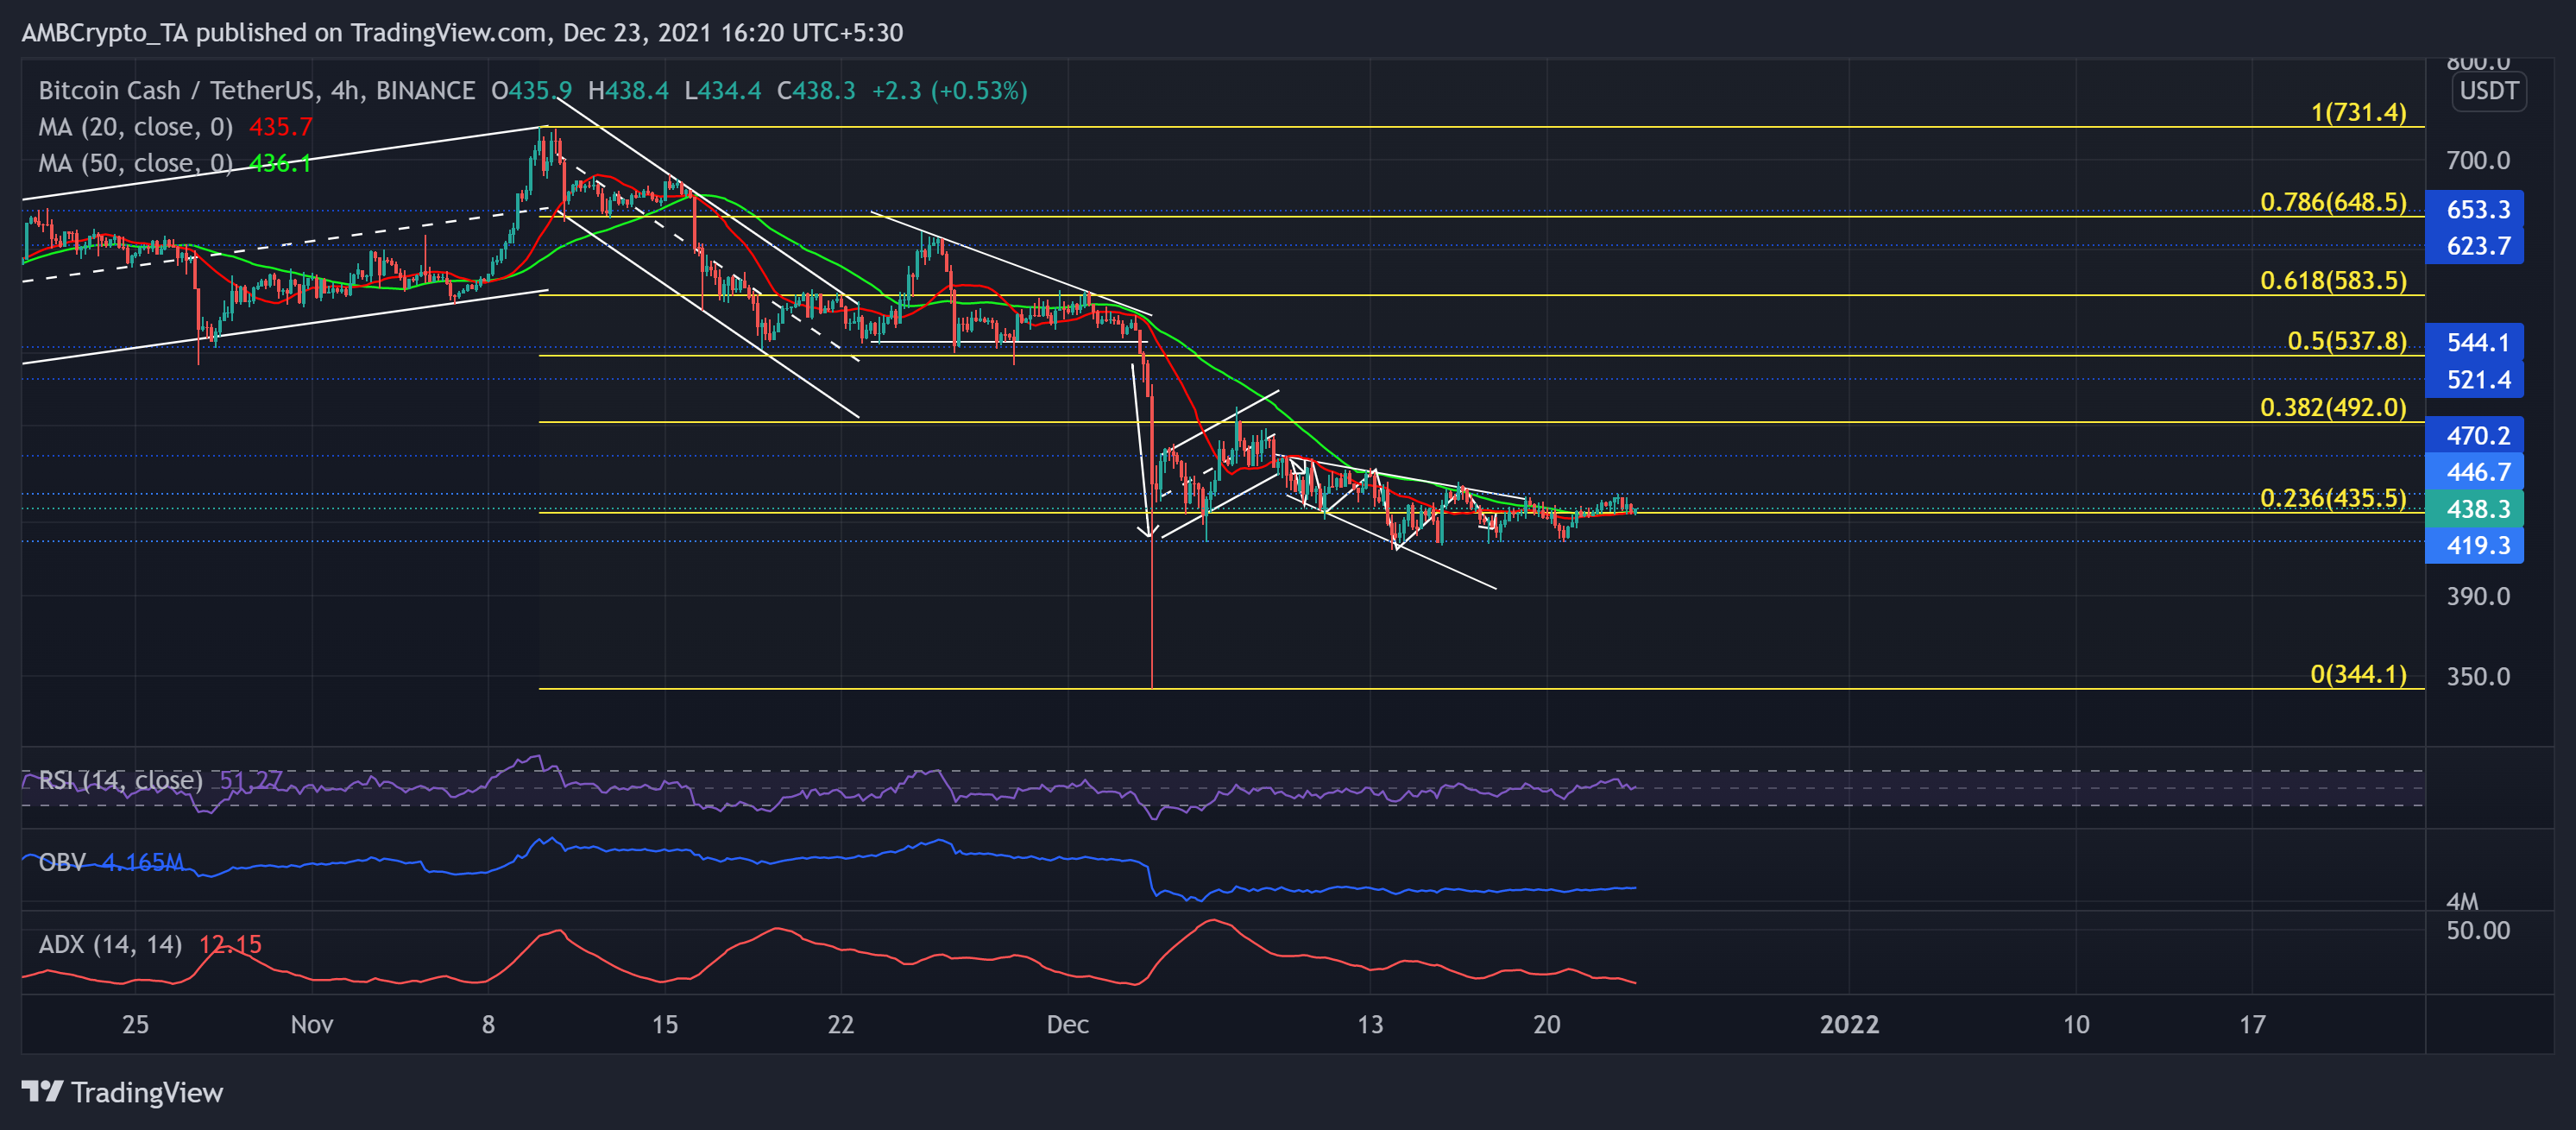
After forming a descending broadening wedge (reversal pattern) on its 4-hour chart, the altcoin saw an expected breakout above the 23.6% Fibonacci level. The bears retested the $419-mark nearly six times while the bulls consistently upheld this testing point.
The alt saw a 6.58% two-day jump from 20 December but saw a pullback from its near-term resistance at the $446-mark. Since then, it fell by nearly 2.58% and found support at the 23.6% level that also overlapped with the 20(red) and 50 (green) SMA.
At press time, BCH traded at $438.3. The RSI stood at the midline after flashing an uptrend. Further, the OBV saw a steady incline over the past few days. But the ADX showed an extremely weak directional trend.


