Assessing the direction of Bitcoin’s price action, as bullish divergences show up

The king coin after smashing a move above the $49,000 mark rekindled the market’s hopes for a higher year-end Bitcoin price close after the over 30% price fall since its all-time high on November 10.
For the last one and a half months Bitcoin’s recovery after a dip has been a rather short-term pump, lasting for three days at most. While most of the macro market signals looked bullish as price maintained above the $48K level, BTC’s fall from the above $49.5K level raised some skepticism about the coin’s near-term trajectory.
Nonetheless, with bullish divergences knocking on the door, can BTC’S recovery sustain?
Signs of a pump
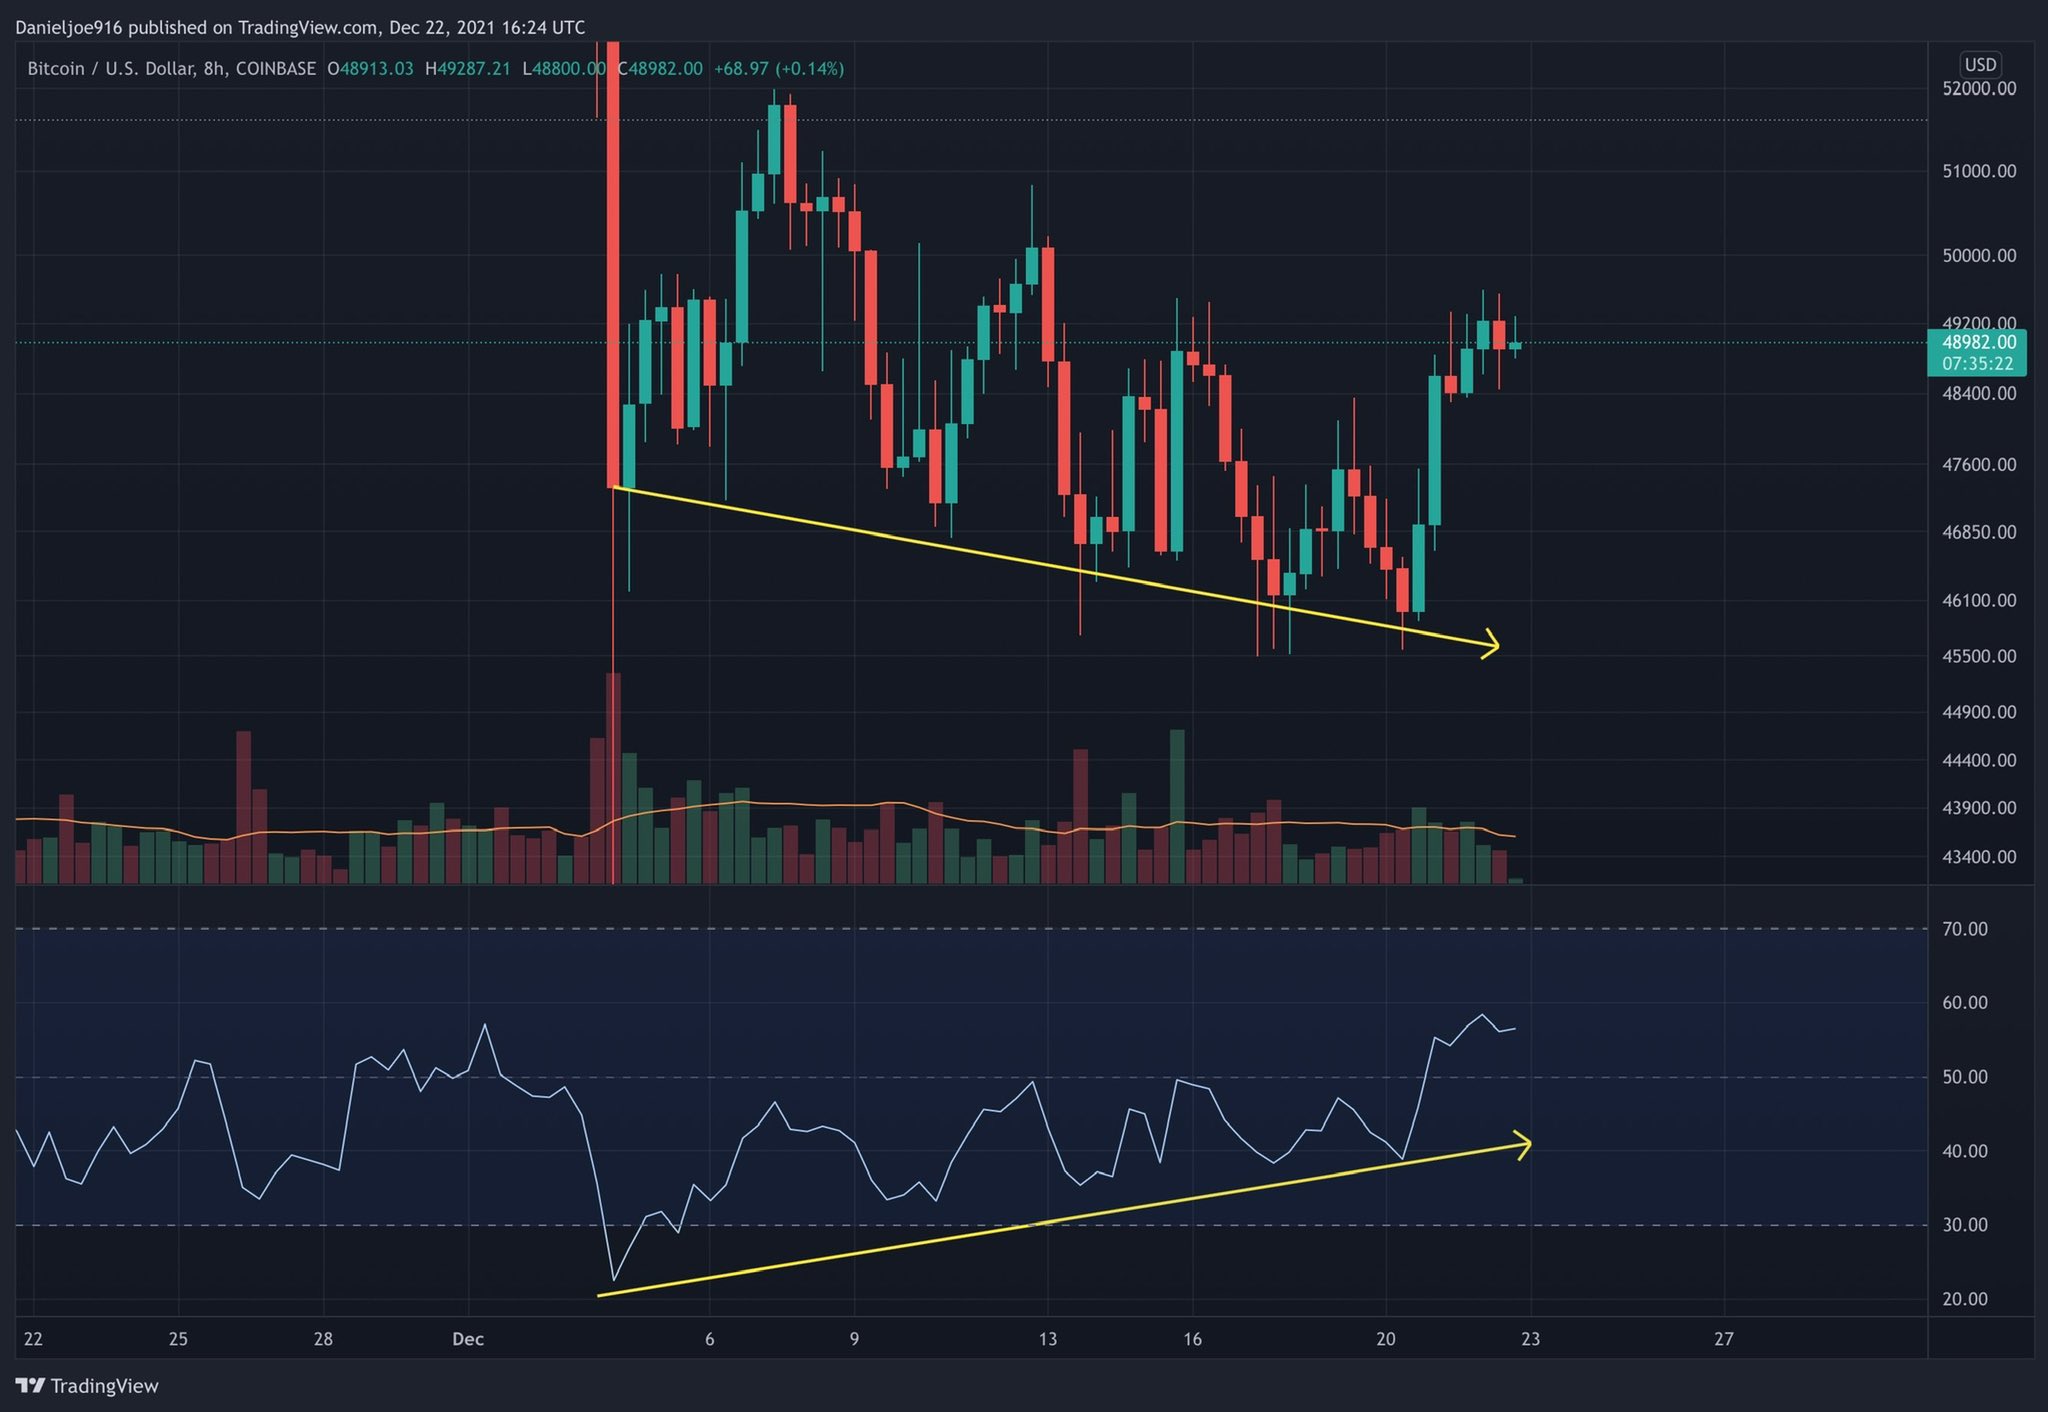
As Bitcoin established itself above the $48K level there were considerable bullish divergences presenting a reversal in BTC’s trajectory. Major deviations include BTC breaking the price downtrend on an 8-hour chart indicative of a price breakout.
Apart from that, a downtrend in price alongside an uptrend in Mean Coin Age, Miner Reserve, and Hash Rate all indicate that the network looked healthy and coins were getting accumulated.
Further, there was also a massive price bounce off the same level where we found support in October 2020, before the 189-day uptrend. When the 140-day Delta Gradient flips to positive, it indicates that an expected uptrend is in play for at least 140 days from flip point.

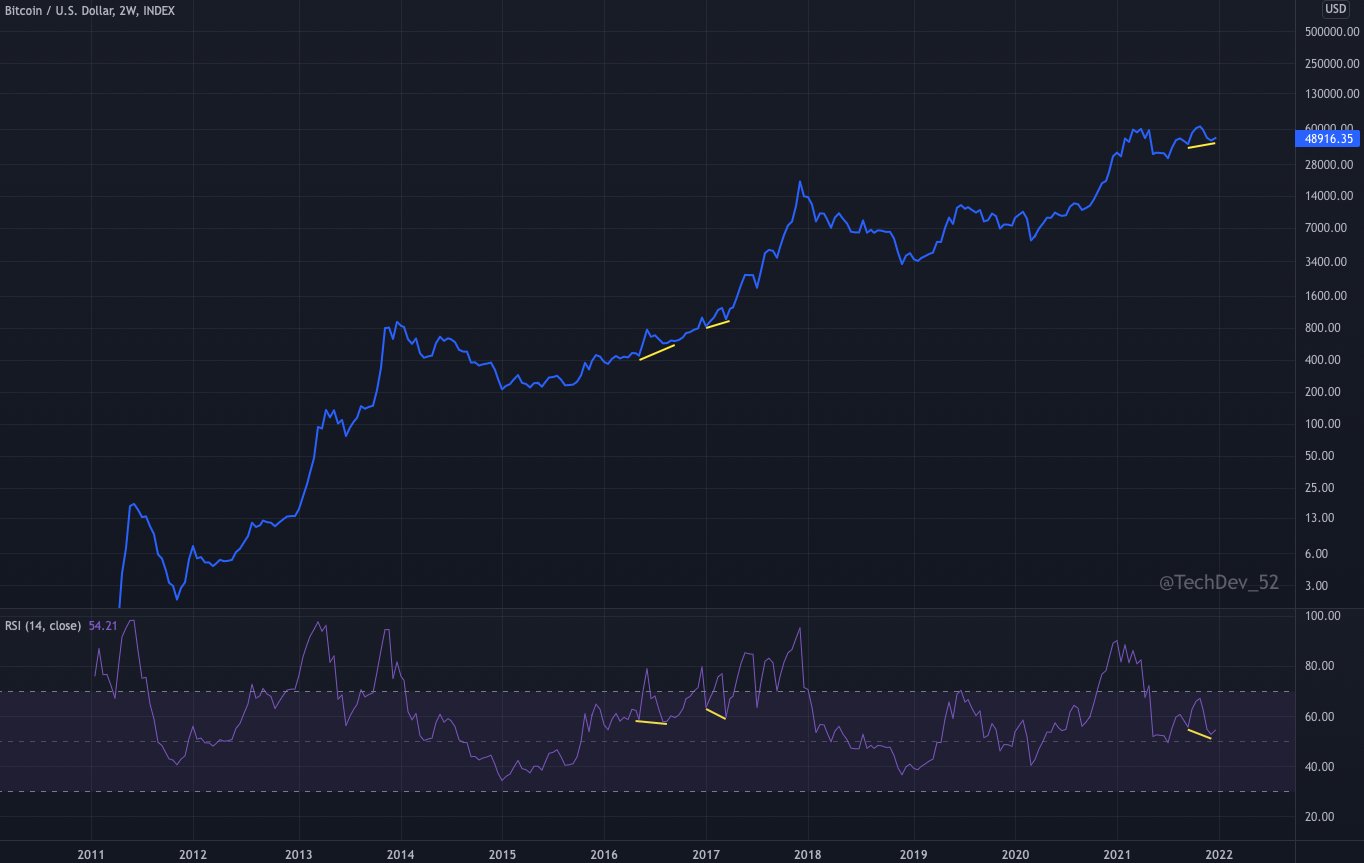
Looking at this trajectory on a more long-term basis, the BTC 2-week chart presents a hidden bullish divergence with price and RSI making two double bottoms. When the same was seen in 2016 and 2017, BTC’s price saw a massive pump.
However, with the price already pulling back from $49K, Bitcoin may be bearish in the short term. In fact, for the price action to turn bullish, the next 24-hours could be crucial.
Be on the lookout for…
Bitcoin’s price was rising for the third consecutive day at the time of writing and after the fall from its all-time high, levels BTC has managed to sustain the bullish outlook for a maximum of three days. If BTC’s uptrend continues for another day a recovery phase could truly be in play.
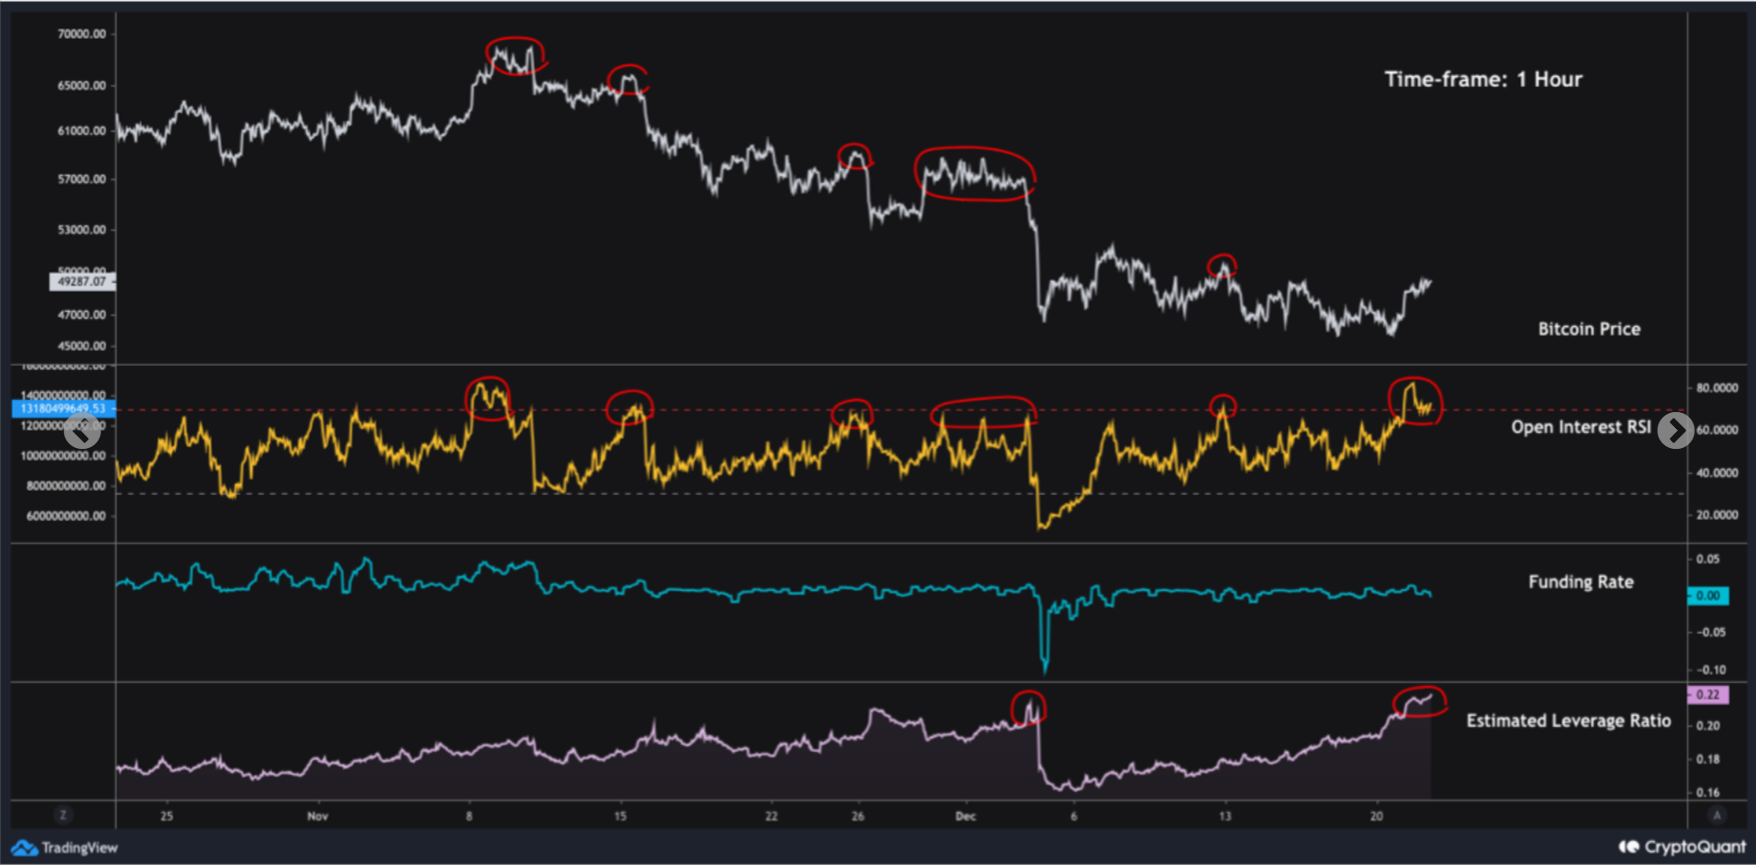
Looking at the futures market sentiment (hourly), for BTC, it looked overheated and the estimated leverage ratio was higher than the level it was on December 3, before the massive dump from $57K to $42K.
Further, the hourly Exchange Reserves (especially spot exchanges) have been rising over the last day, indicating potential selling pressure in the short term which could lead to a short-term price pullback. In that case, the upcoming volatility may be a good opportunity for day-traders.
Additionally, with the daily metrics looking more bullish rather than bearish it does seem like the festive season can bring some joy for BTC HODLers.