Dogecoin: This price level could make or break your portfolio
In the last month, Dogecoin [DOGE] bulls seemingly impeded the selling spree after the alt dipped from the $0.12-level. As a result, it saw a revival above the 20 EMA (red). However, DOGE struggled to find a volatile break away from the Point of Control (POC, red).
With the bearish hammer candlestick rejecting higher prices at the $0.07-zone, any red candlesticks from here on could provoke a rather sluggish phase on the charts. At press time, DOGE was trading at $0.0712, up by 3.62% in the last 24 hours.
DOGE Daily Chart
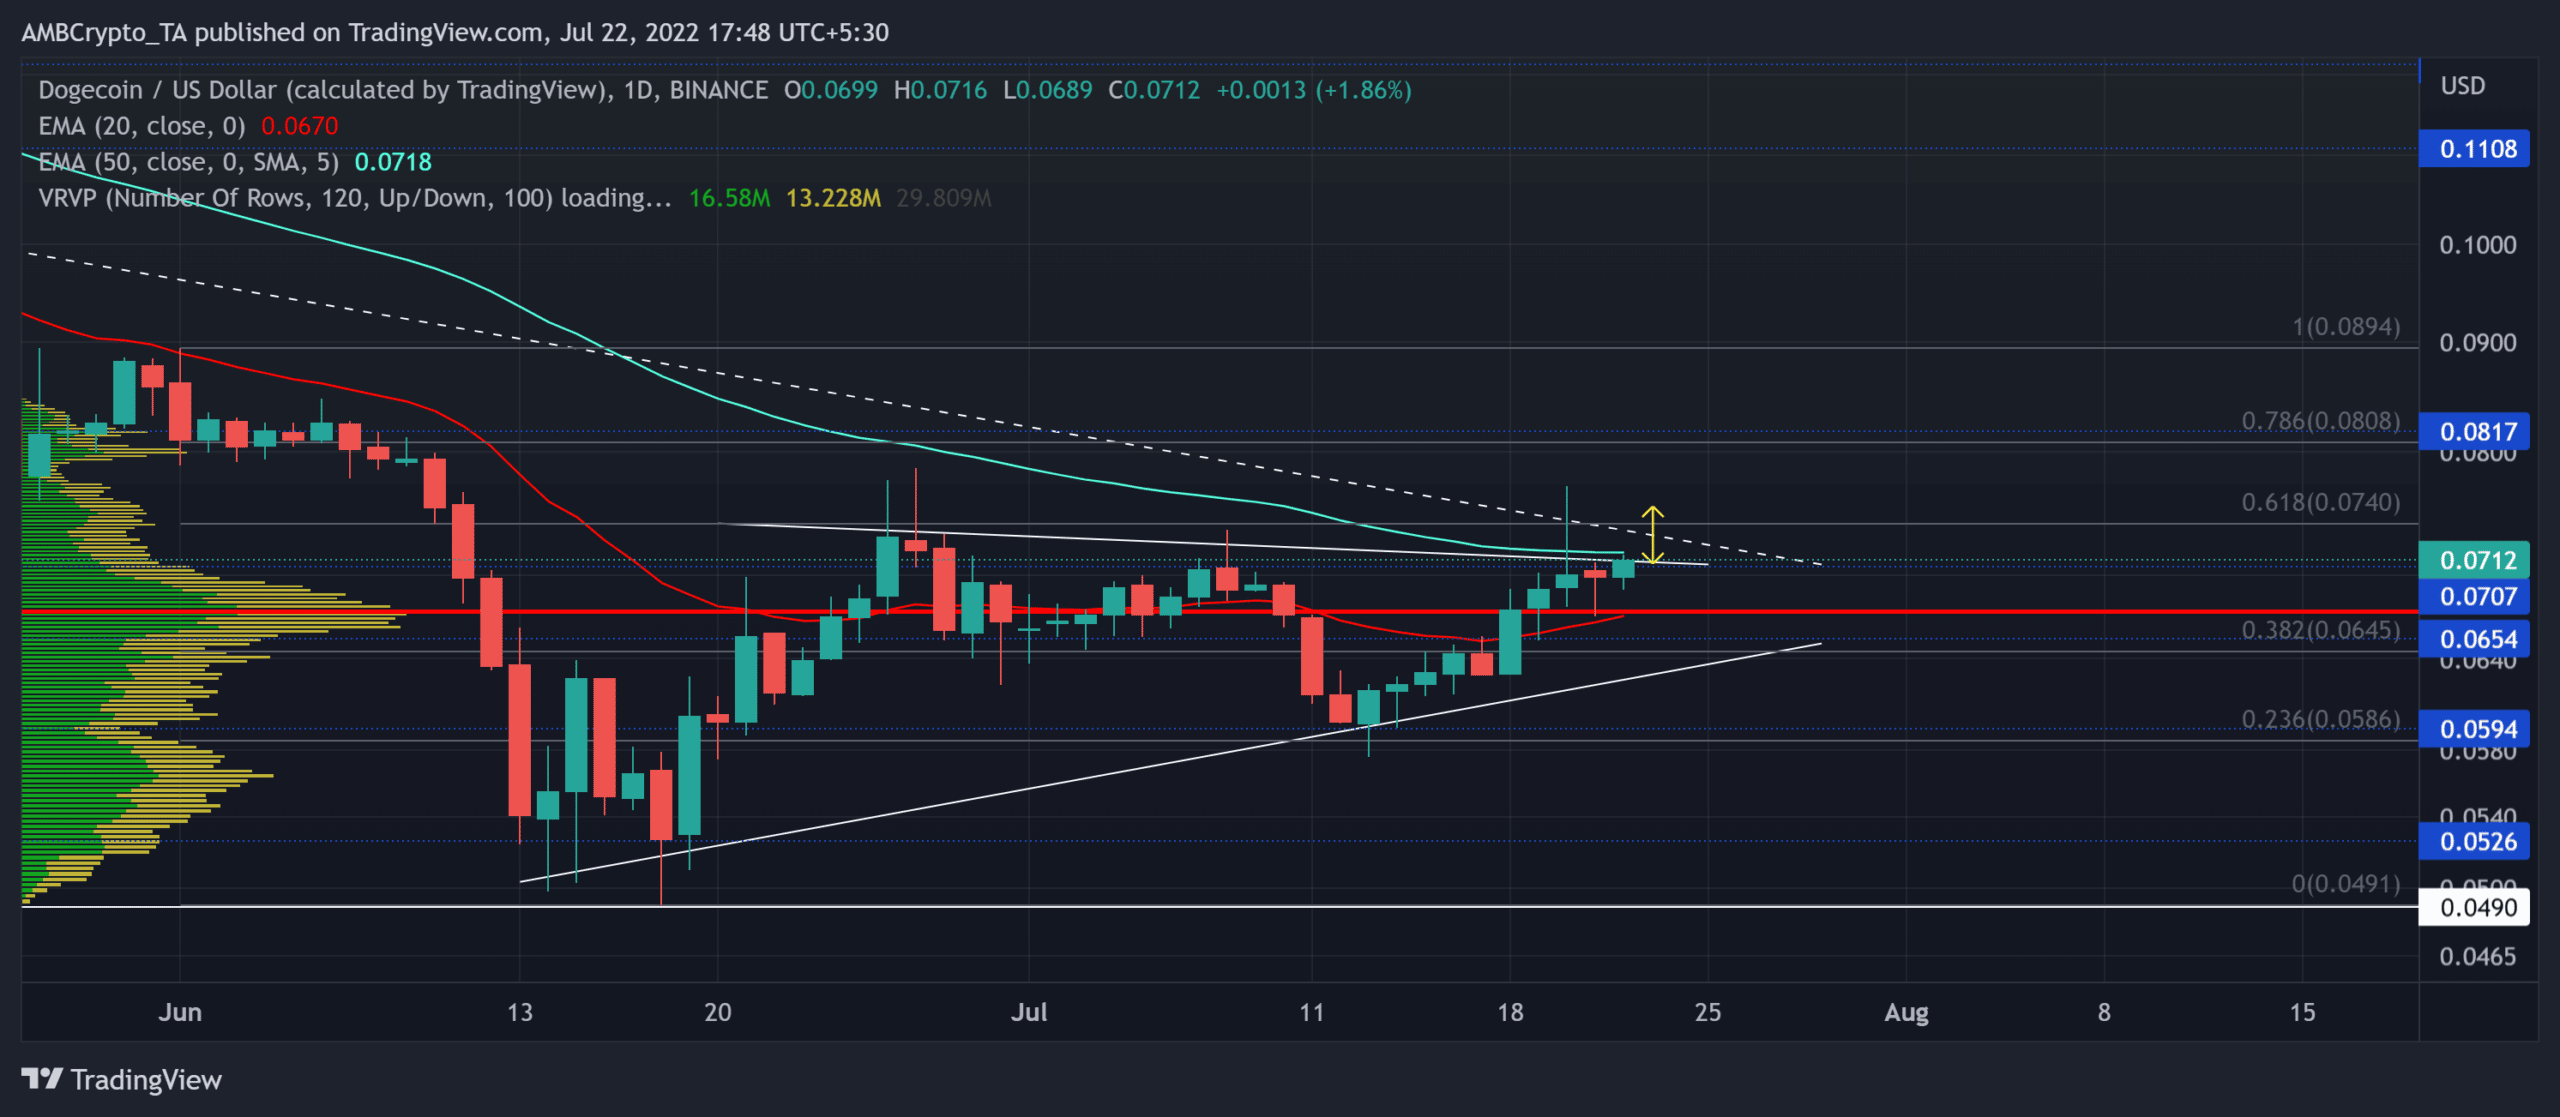
After flipping from the $0.159-resistance, DOGE lost over 70% of its value and poked its 15-month low on 18 June. Meanwhile, the meme-coin maintained its position below the 50 EMA (cyan) and reflected a long-term bearish edge.
Also, the altcoin dipped below the nine-month trendline resistance (white, dashed) and reaffirmed the selling strength from a long-term outlook. With the 61.8% Fibaqoncci level standing sturdy, the bulls still needed to ramp up the buying pressure to alter the broader trend.
Over the last month, DOGE formed a symmetrical triangle-like structure in the daily timeframe. Given the previous downtrend, the coin could see a setback in coming sessions if the bulls fail to step in. Any break below the 20 EMA could trigger a sell-off toward the $0.05 zone.
However, a bullish intervention at the $0.07-mark could help the buyers push for more. Any recovery above the 50-55 EMA would aid the bullish endeavors. The 61.8% level would continue posing hurdles in this case.
Rationale
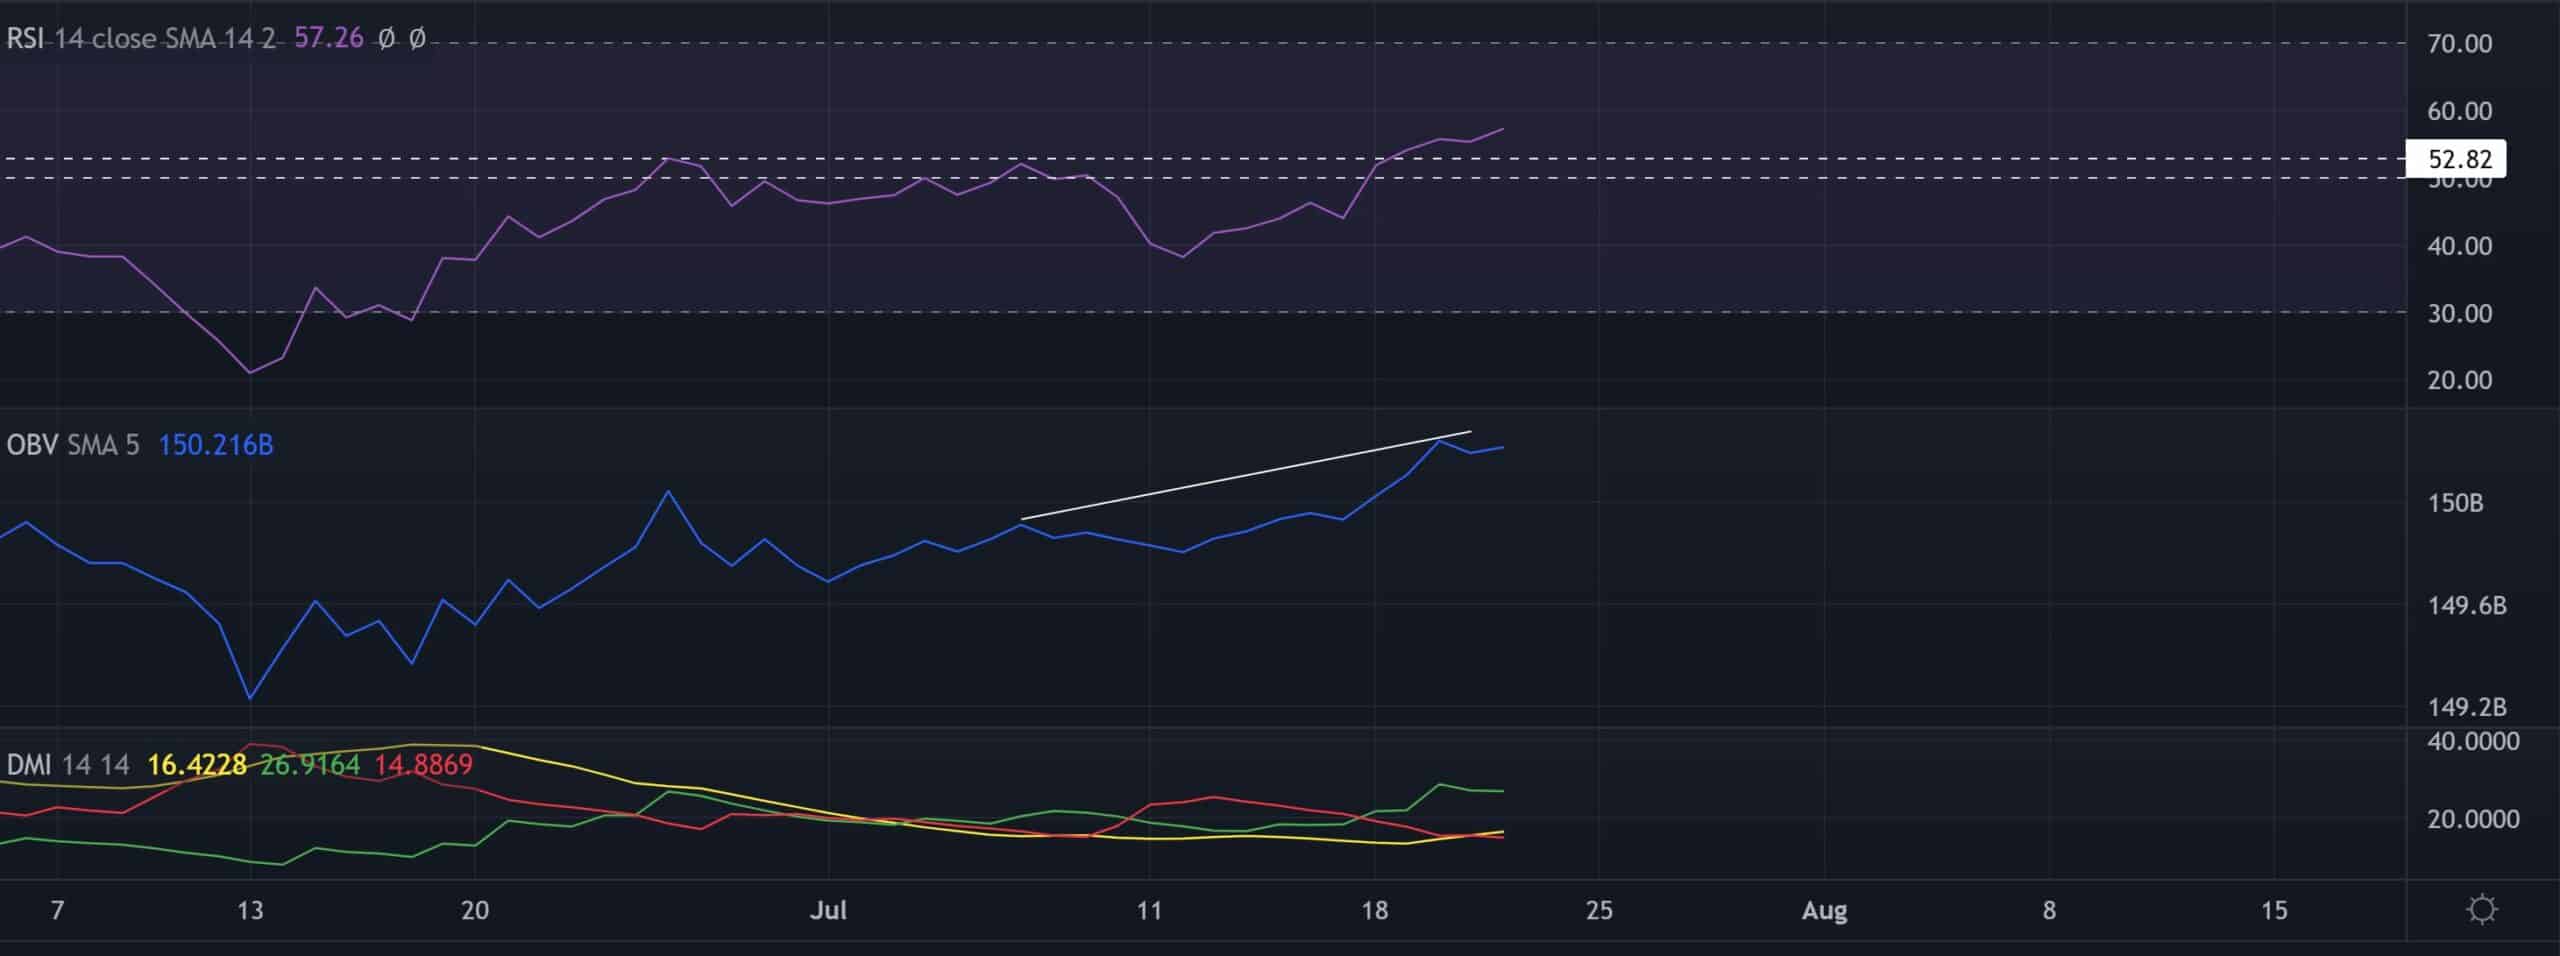
The RSI finally snapped the 50-52 range to claim a bullish edge. Bulls still needed to maintain the buying streak to consistent gains beyond the trendline resistance on the chart.
The OBV resonated with the increased buying pressure, but its recent peaks saw a bearish divergence with price. Also, the DMI lines coincided with the previous readings to depict a buying advantage. But the ADX displayed a considerably weak directional trend for DOGE.
Conclusion
DOGE walked on thin ice at the time of writing. An inability of the buyers to close above the 20/50 EMA could reignite the selling vigor. In such a case, the targets would remain the same as discussed. On the flip side, a robust close above the 50 EMA could invalidate the bearish tendencies.
Finally, the dog-themed coin shares a 51% 30-day correlation with the king coin. Thus, keeping an eye on Bitcoin’s movement would complement these technical factors.


