DOT suffers the wrath of the bears but recovery may be close. Here’s why…

- DOT exchanged hands 1.81% higher than its opening price on 8 August
- However, DOT’s indicators and metrics may have a tough recovery considering the strength of the bulls
As Bitcoin [BTC] briefly crossed the 30k mark on Tuesday, 8 August, the rest of the cryptocurrency market also showed some signs of revival. Although Polkadot’s [DOT] seven-day price action stayed in the red, its 24-hour price trajectory showed improvement.
At press time, DOT exchanged hands at $5.06 and traded 2.33% higher in the last 24 hours. Furthermore, a roundup of Polkadot’s weekly activity was posted by Polkadot Insider that highlighted the blockchain’s performance over the last seven days.
POLKADOT WEEKLY RECAP
?Another weekly go through & however, @Polkadot is still on the way to growth
?Based on the data from @tokenterminal & @subscan_io
✅AVG Developers: 173
✅AVG Transactions: > 6000
✅AVG Users ~3400?Check out the details below#Polkadot #DOT pic.twitter.com/F6X536Up8O
— Polkadot Insider (@PolkadotInsider) August 8, 2023
Is your portfolio green? Check out the Polkadot Profit Calculator
Much to celebrate here?
As per the update posted on X (formerly Twitter), Polkadot’s social mentions surged by over 15% in the last seven days. However, the bearish sentiment outweighed the bullish sentiment with the former at 33.3% and the latter at 9.8%. This wasn’t a great sign for the network.
POLKADOT SOCIAL METRICS WEEKLY RECAP
?Dive into the social buzz around @Polkadot
?Over the past 7D, Polkadot has been making waves across social media platforms.
?The community is buzzing with excitement from discussions, mentions, and engagements
Detail?#Polkadot #DOT pic.twitter.com/ydRdQA6eIX
— Polkadot Insider (@PolkadotInsider) August 8, 2023
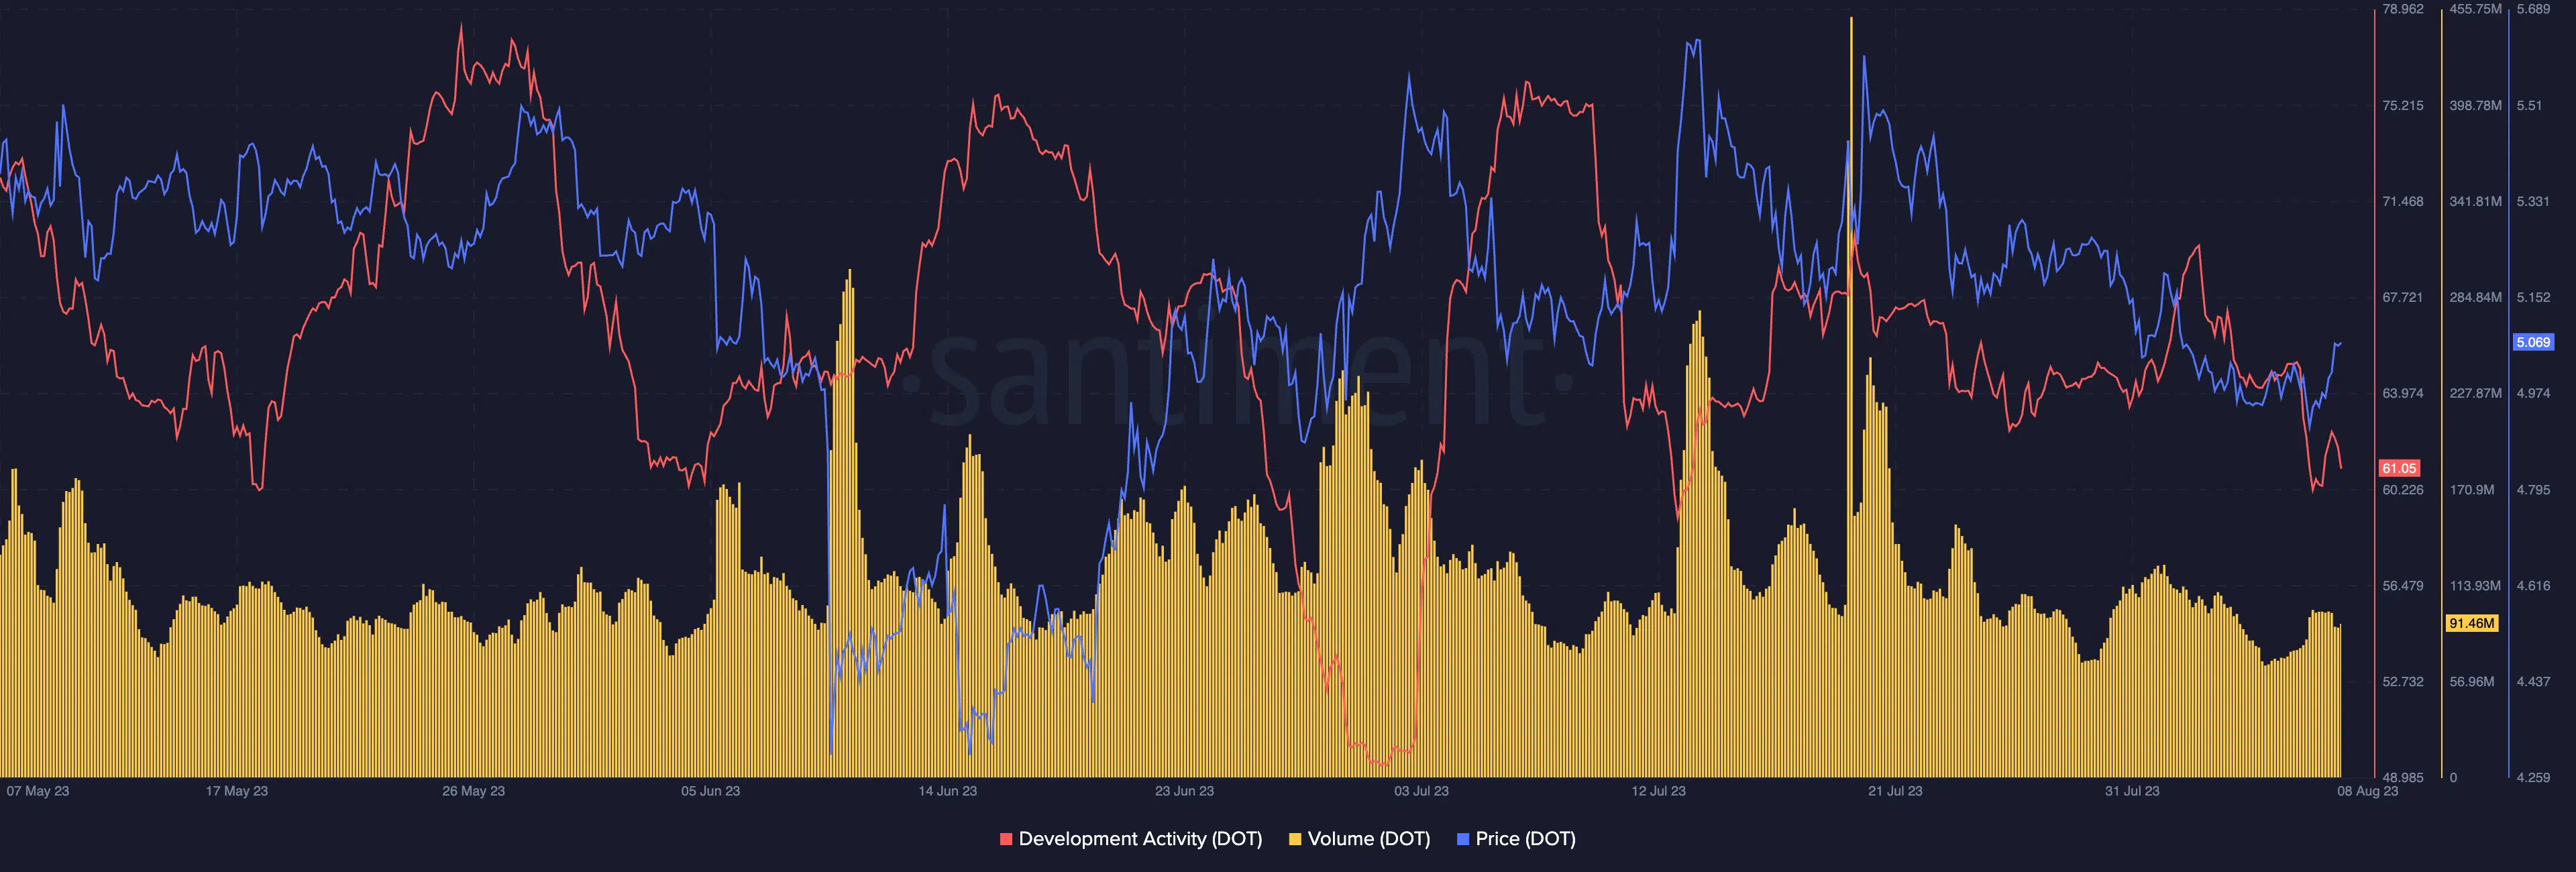
Additionally, data from the intelligence platform Santiment, showed that DOT’s volume wasn’t at its best. For the better part of the last three months, DOT’s volume laid low and only managed to touch a few peaks.
Furthermore, DOT’s development activity also witnessed some highs and lows, but at press time, witnessed a downfall. DOT’s development activity stood at 61.05 which was a drop from the previous day. A fall in the development activity indicated that developers weren’t contributing much toward the development of the chain.
Will DOT’s price be the game changer?
Although DOT’s price action wandered in the green, its indicators were far from recovery. DOT’s Moving Average Convergence Divergence (MACD) displayed a bearish crossover at the time of writing. Although the MACD indicator moved below the zero line seven days ago, DOT’s price action has been in the midst of a power struggle since the beginning of July.
However, DOT’s Relative Strength Index (RSI) may turn things around for the altcoin. Although DOT’s RSI stayed below the neutral line at 46.21, a change in direction could be on the cards. The upward stance of the RSI was an indication of recovering buying pressure.
How much are 1,10,100 DOTs worth today?
To add to the aforementioned sentiment, DOT’s Money Flow Index (MFI) also showed some recovery and witnessed an uptick. This could be an indication that DOT could witness some recovery but only if the buying pressure regained strength.


