Enjin Coin, Harmony Coin, IOTA Price Analysis: 05 March

Despite recovering from the turmoil of the Ukraine conflict, the bears seemed to be influencing the market. The likes of Enjin, Harmony, and IOTA give similar indications.
Enjin Coin (ENJ)
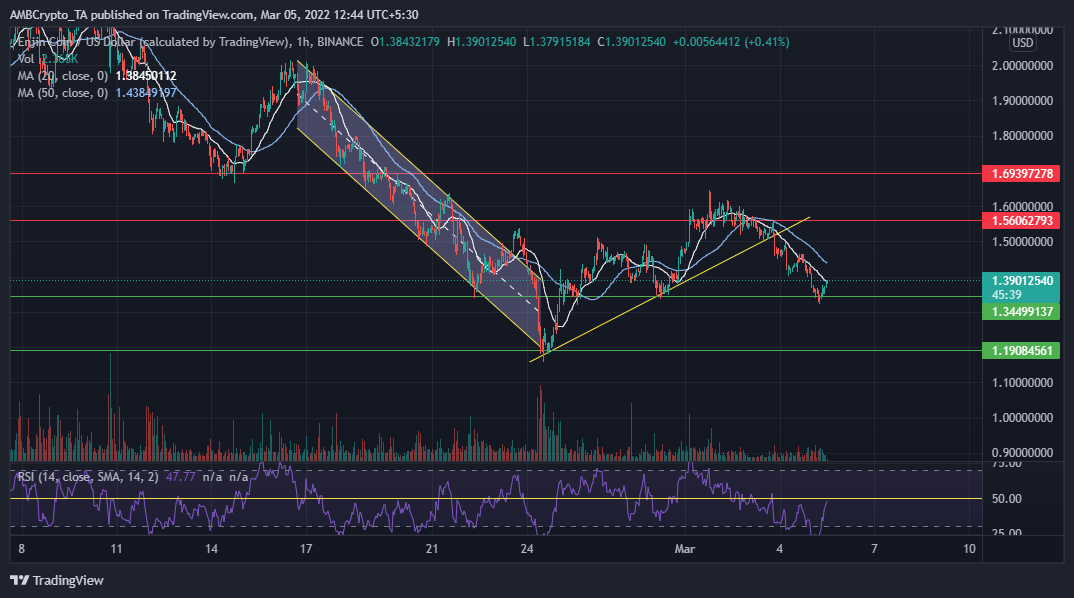
ENJ followed a downtrend since mid-February as the strength index hit rock bottom. The crisis in Ukraine was a potent factor behind the rapid sell-off. However, ENJ gained critical support at the $1.19 level on 24 February, following which the coin moved up the chart.
A favorable buying strength helped ENJ move up to meet a resistance near the $1.56 level on 1 March. However, the bears exerted pressure. Consequently, the alt breached the trendline support (yellow trendline) and declined once again. It retested the previous support level at $1.34 and was trading at $1.38 during press time.
The RSI recovered momentarily over the past one hour from being oversold and hovered at 46.57, at the time of writing. However, if the overall bearish momentum continues, ENJ could retest the $1.19 level again and might as well go down further.
Harmony (ONE)

After breaking down from the $0.19 mark, ONE lost almost half of its value before plummeting to a five-month low on 24 February. However, after gaining support at the $0.13 level, it bounced up.
Furthermore, the coin reached resistance at $0.16 on 26 February and has been trading between $0.16 and $0.13 since. Over the last week, it dropped by 6.7%. The immediate support level at $0.13 has been retested twice over the last week. During press time, ONE was trading at $0.14, gaining 0.51% over the previous day.
The RSI at 42.50 recovered from the oversold area over a few hours due to a momentary spurt in buying strength. However, the CMF was still under the zero line. Thus, indicating an overall bearish directional momentum. Failure to maintain the buying strength might move the coin even lower on the price chart.
IOTA
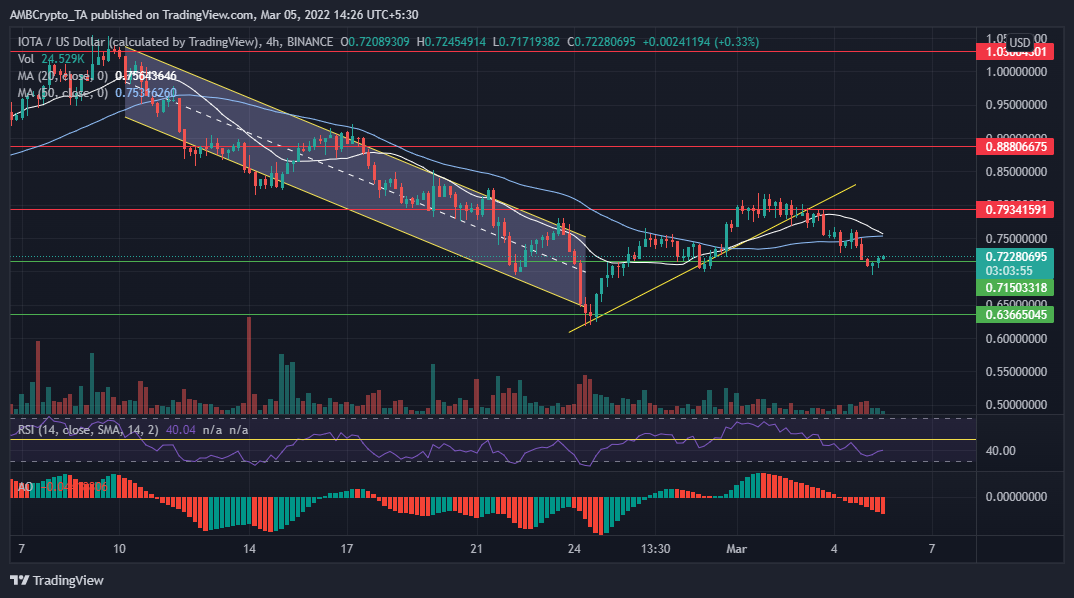
Similar to the aforementioned coins, IOTA witnessed a downtrend from the $1.03 mark However, it gained critical support at $0.63 on 24 February. Interestingly, it quickly recovered as the buying support kicked in, thus reaching resistance at $0.79 level.
Over the past couple of days, IOTA broke the trendline support (yellow line) and headed for a southward journey. It retested the immediate support at the $0.71 level. The RSI indicated a bearish directional momentum at 39.03 which could continue forward. Even the AO went beneath the zero line indicating the same. The coin was trading at $0.72 at press time.