EOS, Aave, UNI Price Analysis: 10 February

EOS, at press time, had risen to its highest point in nearly a year, but flashed bearish signals on the charts too. AAVE broke above its ascending triangle and awaited confirmation over the next few trading sessions. Finally, Uniswap seemed to be trading at record levels, with the RSI pointing towards a saturated market.
EOS

EOS noted strong bullish momentum over the past couple of days as the price climbed to its highest level in nearly a year at $4.45. However, there was a chance of the momentum fizzling out as the On Balance Volume dipped after EOS flipped the $4.3-resistance.
The Stochastic RSI also favored the sellers as the index moved lower after a bearish crossover in the overbought zone. A selloff at this level could see the support level at $4.15 come into focus.
Aave [AAVE]
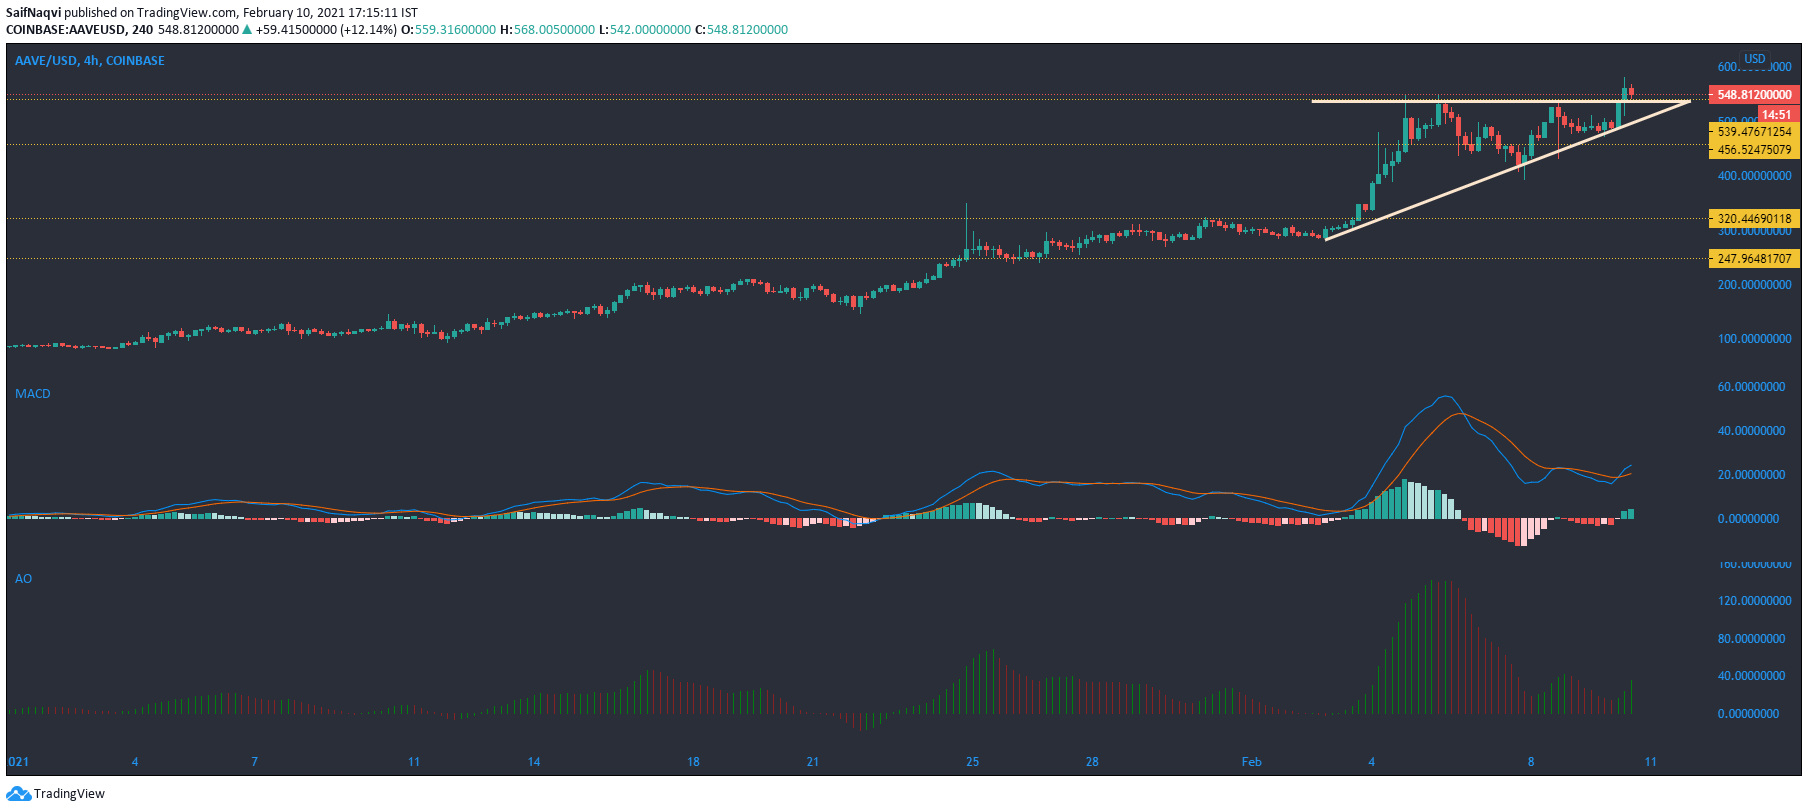
Aave formed an ascending triangle and registered a northbound breakout on the 4-hour chart. Since the upward move occurred on relatively lower volumes, there was a chance that the price could move back within the pattern following a false breakout. Bullish candlesticks over the next few sessions would confirm the breakout and see AAVE rise to a fresher all-time high on the charts.
The MACD backed a favorable outcome for the cryptocurrency after a bullish crossover on the index. The Awesome Oscillator also noted rising bullish momentum in the market. In a bearish scenario, the price could move back within the pattern and trade near the lower trendline.
Uniswap [UNI]
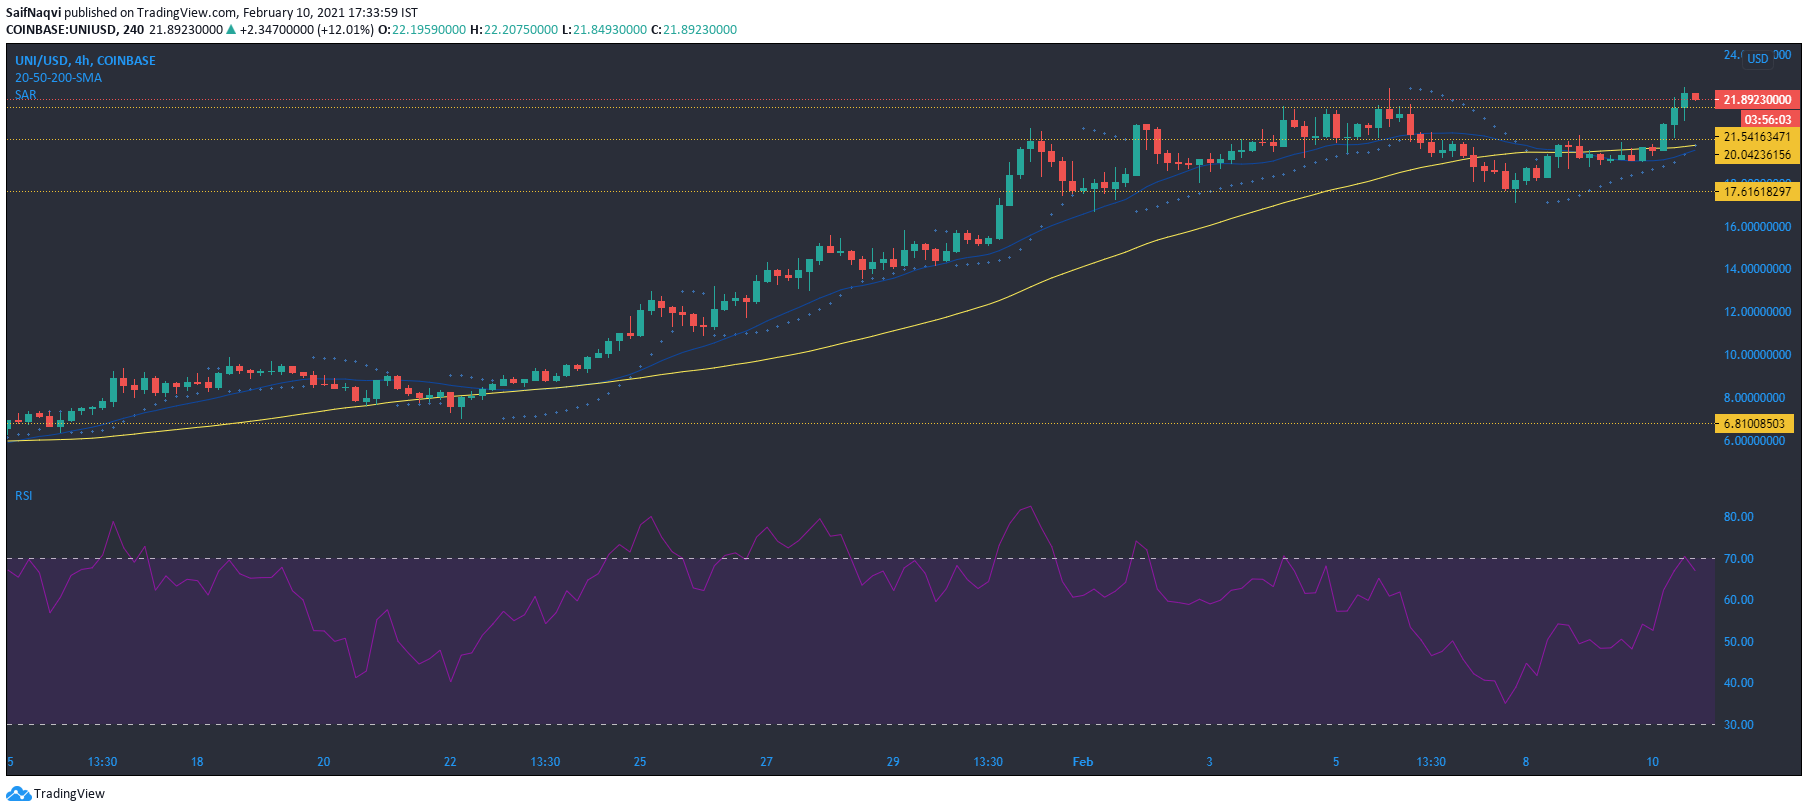
Uniswap flipped the $21-resistance as buyers ramped up the pressure over the last few trading sessions. However, the Relative Strength Index added some skepticism in the mix as the index could potentially fall sharply going forward. A move below the $21.5-support mark would present some buy signals for short to medium-term traders if the price remains above its 20-SMA (blue) and 50-SMA (yellow).
Meanwhile, the Parabolic SAR confirmed the recent uptrend as the dotted markers moved below the candlesticks.